. 2023 Nov 24;24(1):267.
doi: 10.1186/s13059-023-03115-4.

Acute expression of human APOBEC3B in mice results in RNA editing and lethality

Affiliations

Acute expression of human APOBEC3B in mice results in RNA editing and lethality

Alicia Alonso de la Vega et al. Genome Biol. .

Abstract

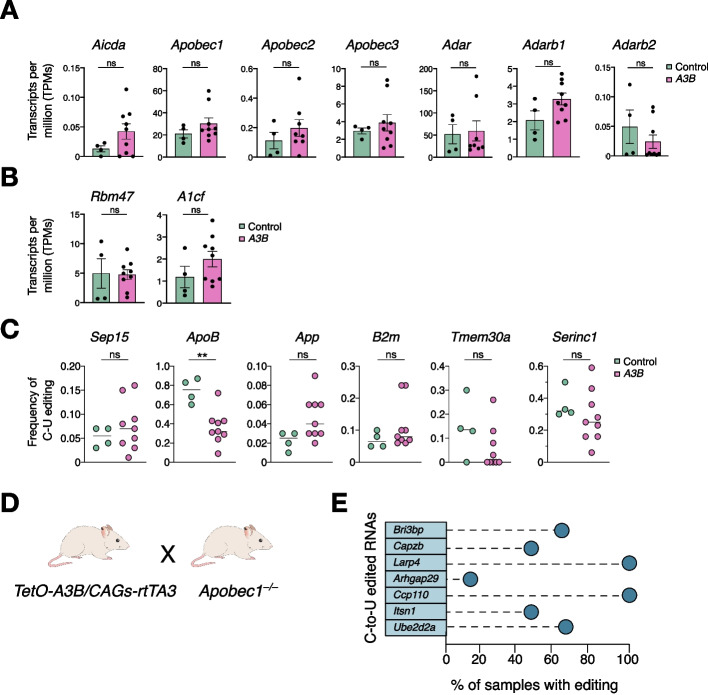
Background: RNA editing has been described as promoting genetic heterogeneity, leading to the development of multiple disorders, including cancer. The cytosine deaminase APOBEC3B is implicated in tumor evolution through DNA mutation, but whether it also functions as an RNA editing enzyme has not been studied.

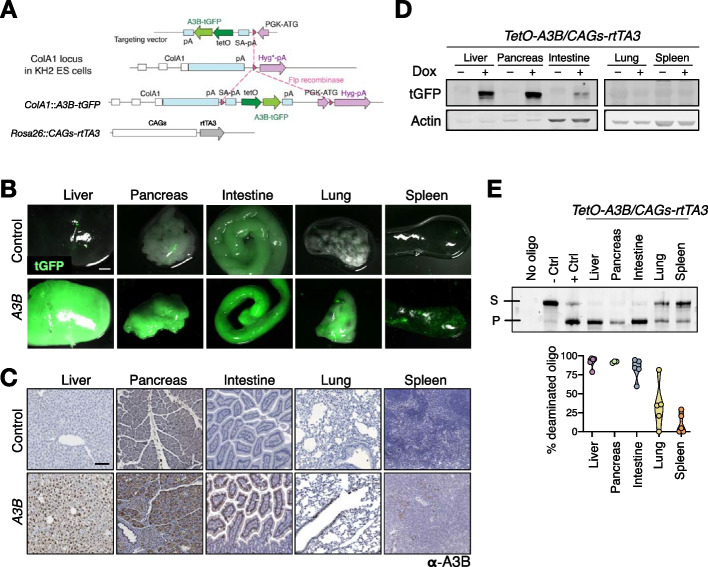
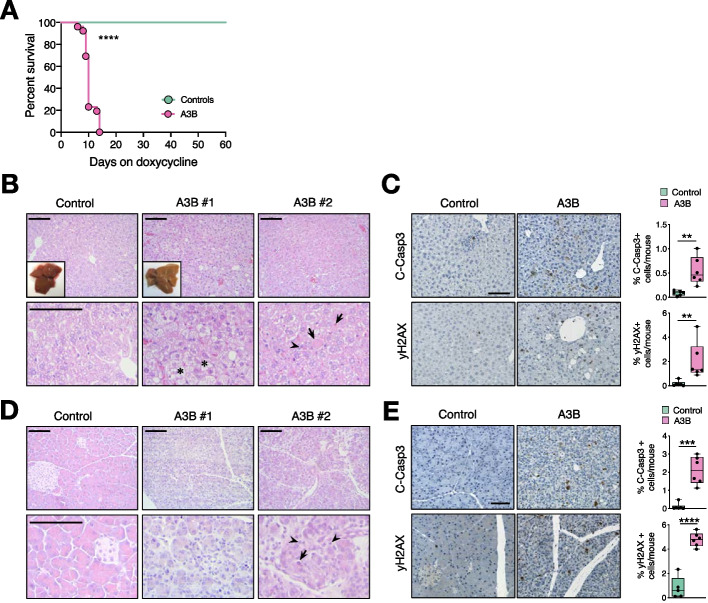
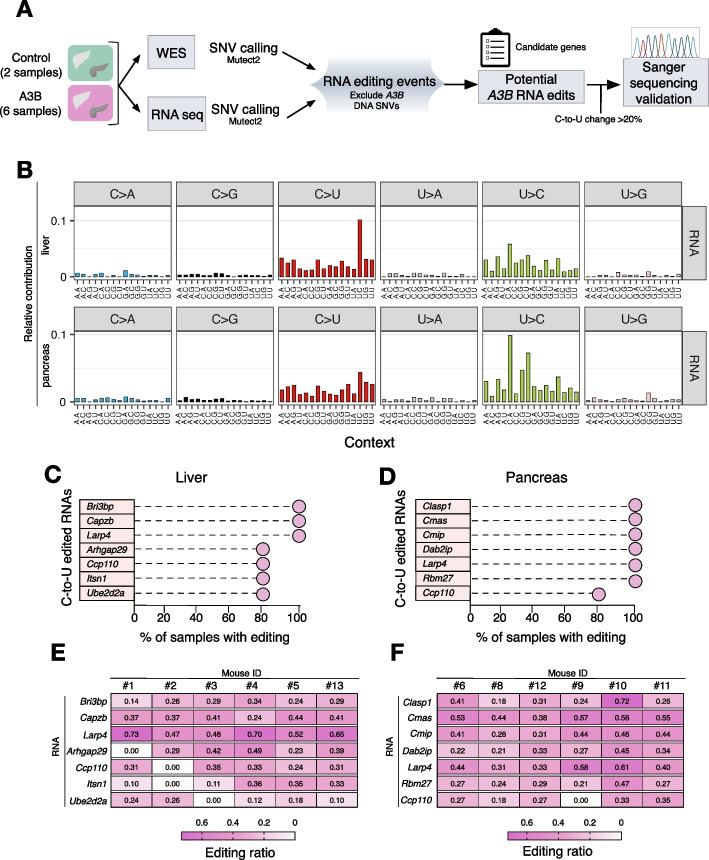
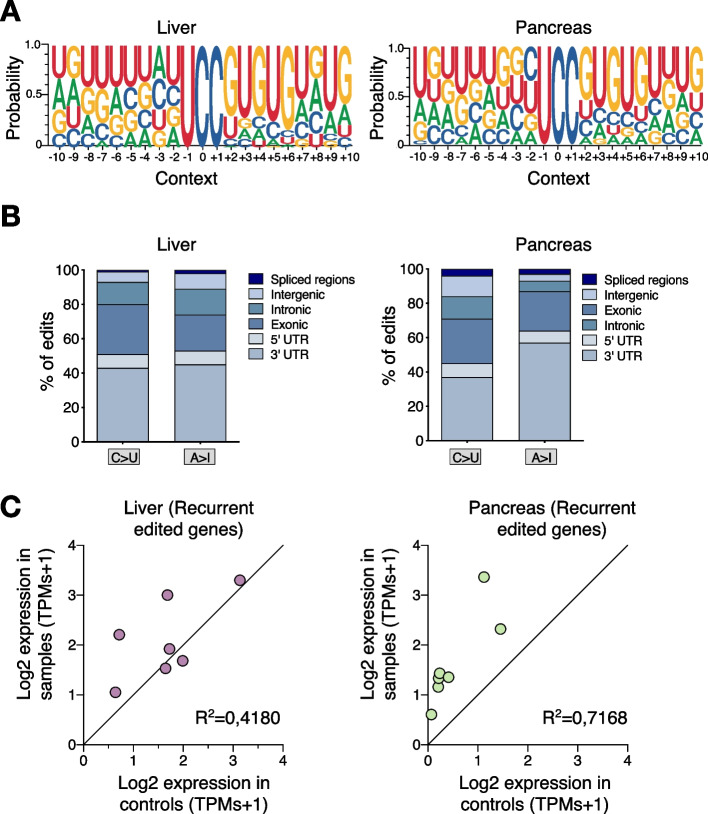
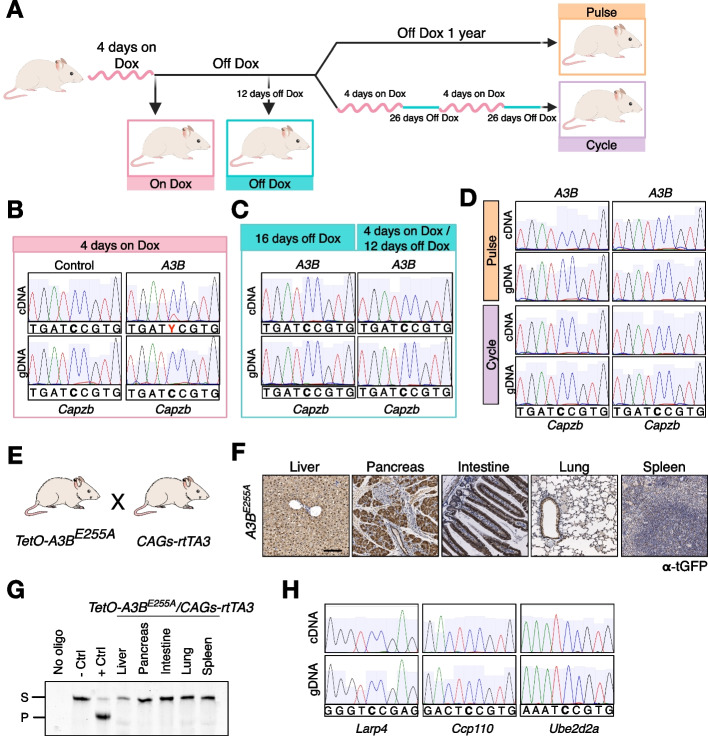
Results: Here, we engineer a novel doxycycline-inducible mouse model of human APOBEC3B-overexpression to understand the impact of this enzyme in tissue homeostasis and address a potential role in C-to-U RNA editing. Elevated and sustained levels of APOBEC3B lead to rapid alteration of cellular fitness, major organ dysfunction, and ultimately lethality in mice. Importantly, RNA-sequencing of mouse tissues expressing high levels of APOBEC3B identifies frequent UCC-to-UUC RNA editing events that are not evident in the corresponding genomic DNA.

Conclusions: This work identifies, for the first time, a new deaminase-dependent function for APOBEC3B in RNA editing and presents a preclinical tool to help understand the emerging role of APOBEC3B as a driver of carcinogenesis.

Keywords: APOBEC3B; DNA damage; Mouse models; Mutations; RNA editing.


Conflict of interest statement

The authors declare no competing interests.

Figures

Fig. 1
Fig. 1
Generation of A3B-inducible mice. A Schematic representation of the strategy used for the generation of human A3B transgenic mice. Under a TRE promoter, the human A3B cDNA fused to tGFP was inserted after homologous recombination into the ColA1 locus of KH2 ES cells. B Macroscopic images demonstrate tGFP fluorescence in tissues from A3B mice fed with doxycycline for 10 days (scale bar: 3 mm). C Immunohistochemistry of A3B in the indicated tissues from A3B mice fed with doxycycline for 10 days (scale bar: 100 μm). D Western blot analysis showing A3B levels in the indicated tissues from A3B mice with and without doxycycline treatment for 10 days. Anti-actin blots are shown as loading controls. E Representative DNA cytosine deaminase activity from whole cell extracts in the indicated tissues (S, Substrate; P, Product) and the corresponding quantification showing the % of the deaminated oligo (n = 5 mice per tissue)
Fig. 2
Fig. 2
A3B overexpression causes early lethality. A Survival of TetO-A3B/CAGs-rtTA3 mice after doxycycline administration (controls n = 9; A3B n = 26; P < 0.0001 by Log-rank (Mantel-Cox) test). B H&E-stained sections of livers from control and A3B mice (insets: macroscopic images). Asterisk point microvesicular steatosis, arrowhead point lymphocytes and arrows to apoptotic cells. C Immunohistochemistry against C-Caspase3 and γH2AX in liver sections from control and A3B mice and corresponding quantification (n = 6). D H&E-stained sections of the pancreas from control and A3B mice. Arrowheads point to lymphoplasmacellular infiltration and arrows to apoptotic cells. E Immunohistochemistry against C-Caspase3 and γH2AX in paraffin sections from control and A3B pancreas and the corresponding quantification (n = 6). Data in panels C and E were analyzed by unpaired t-test **p < 0.01, ***p < 0.001, ****p < 0.0001. Data is represented as mean ± SD shown by dots, where each dot represents a mouse, and error bars, respectively. Scale bars: 100 μm. Scale bars upper panels B and D: 10 μm
Fig. 3
Fig. 3
Local preference of APOBEC3B-driven RNA editing. A Schematic of the pipeline used to call RNA-editing sites in the A3B livers and pancreas. We used Mutect2 to identify DNA mutations and RNA edits. We pooled the WES and RNA-seq of the two control animals (no dox), and used them as a reference to identify variants of the A3B expressing tissues. This step was performed separately for DNA and RNA sequences, leading to the identification of DNA variants or RNA variants that were detected in at least one A3B expressing tissues but not in any of the other two control tissues. After that, we compared the RNA variants with the DNA variants from each sample to identify the RNA edits that are not DNA SNPs. B Trinucleotide mutation profiles for all base substitutions in the RNA from liver and pancreatic tissues of A3B mice (n = 6 in each group). Relative contribution refers to the contribution that each single base substitution has to the overall base substitution spectrum in A3B mice. C-D Lollipop plots indicating the percentage of mice showing C-to-U editing after experimental validation by RT-PCR in selected targets (n = 6 tissues in each group). E–F Heatmap plot showing the editing ratios of each sanger sequence validated position in each individual sample (liver shown in E and pancreas in F)
Fig. 4
Fig. 4
APOBEC3B-driven RNA editing occurs at a specific hotspot and mainly at 3’ UTRs. A Web logo representations of the broader sequence preferences surrounding the C-to-U editing events in 5’-UCC motifs in liver (left) and pancreas (right). B Distributions of the editing sites by region of the RNA editing events in liver (left) and pancreas (right). C Correlation of the expression levels in the recurrent edited transcripts in liver (left) and pancreas (right) samples obtained from RNA seq data (Log2 of transcripts per million + 1 (TPMs); each dot represents the average expression of each transcript (n = 2 controls and 6 A3B in each liver and pancreas samples)
Fig. 5
Fig. 5
Endogenous Apobec enzymes are not responsible for the observed RNA editing. A Average expression levels of the different endogenous Apobec and Adar family members in liver samples obtained from RNA seq data (transcripts per million (TPMs); each dot represents data from one animal n = 4 controls and 9 A3B livers). B Average expression levels of Apobec1 cofactors obtained from the RNA seq data and shown as transcripts per million (TPMs); each dot represents data from one animal (n = 4 controls and 9 A3B livers). C Frequency of C-to-U mRNA editing in well-known Apobec1 editing sites measured by quantification of RNA seq data from controls and A3B livers. Each dot represents data from one animal (n = 4 controls and 9 A3B livers). D) Schematic of the breeding strategy to obtain A3B/Apobec1−/− mice. E Lollipop plots indicating the percentage of mice showing C-to-U editing after experimental validation by RT-PCR in selected targets in A3B/Apobec1.−/− mice (n = 6 liver tissues)
Fig. 6
Fig. 6
Continuous expression of A3B is required for RNA editing. A Schematic representation of the strategy used to study whether A3B expression is needed to detect the RNA edits. B, C and D Examples of Sanger sequencing chromatograms from the livers for the A3B-driven edited positions. B Mice 4 days after dox administration. Control refers to a mouse that has the TetO-A3B transgene but not the CAGs-rtTA3, while A3B is a mouse with TetO-A3B/CAGs-rtTA3 genotype. C Mice on dox for 4 days and placed back on a normal diet for 12 days or off dox for 16 days. D Mice that received a pulse of A3B expression (4 days dox and up to a year on normal diet) or expressing A3B in a cycle manner (4 days dox-26 days off dox/monthly). Samples were collected at experimental endpoint (1 year). E Schematic of the breeding strategy to obtain TetO-A3B-E255A/CAGs-rtTA3 mice. F Immunohistochemistry of tGFP in the indicated tissues from A3B-E255A fed with dox for 8 days. Scale bar: 100 μm. G Deamination activity assay in the indicated tissues from TetO-A3B-E255A/CAGs-rtTA3 mice fed with dox for 8 days (S, Substrate; P, Product). H Examples of Sanger sequencing chromatograms showing no RNA editing in A3B-E255A liver tissues

Similar articles

Cited by

References

    1. Rayon-Estrada V, Papavasiliou FN, Harjanto D. RNA Editing Dynamically Rewrites the Cancer Code. Trends Cancer. 2015;1:211–212. doi: 10.1016/j.trecan.2015.10.008. - DOI - PMC - PubMed
    1. Baysal BE, Sharma S, Hashemikhabir S, Janga SC. RNA Editing in Pathogenesis of Cancer. Cancer Res. 2017;77:3733–3739. doi: 10.1158/0008-5472.CAN-17-0520. - DOI - PubMed
    1. Kung CP, Maggi LB, Weber JD. The Role of RNA Editing in Cancer Development and Metabolic Disorders. Front Endocrinol. 2018;9:762. doi: 10.3389/fendo.2018.00762. - DOI - PMC - PubMed
    1. Kurkowiak M, Arcimowicz Ł, Chruściel E, Urban-Wójciuk Z, Papak I, Keegan L, et al. The effects of RNA editing in cancer tissue at different stages in carcinogenesis. Rna Biol. 2021;18:1524–1539. doi: 10.1080/15476286.2021.1877024. - DOI - PMC - PubMed
    1. Lerner T, Papavasiliou FN, Pecori R. RNA Editors, Cofactors, and mRNA Targets: An Overview of the C-to-U RNA Editing Machinery and Its Implication in Human Disease. Genes-basel. 2018;10:13. doi: 10.3390/genes10010013. - DOI - PMC - PubMed

Publication types