. 2023 Nov 25;11(1):262.
doi: 10.1186/s40168-023-01709-5.

Gut microbiota-bile acid crosstalk regulates murine lipid metabolism via the intestinal FXR-FGF19 axis in diet-induced humanized dyslipidemia

Affiliations

Gut microbiota-bile acid crosstalk regulates murine lipid metabolism via the intestinal FXR-FGF19 axis in diet-induced humanized dyslipidemia

Hongtao Xu et al. Microbiome. .

Abstract

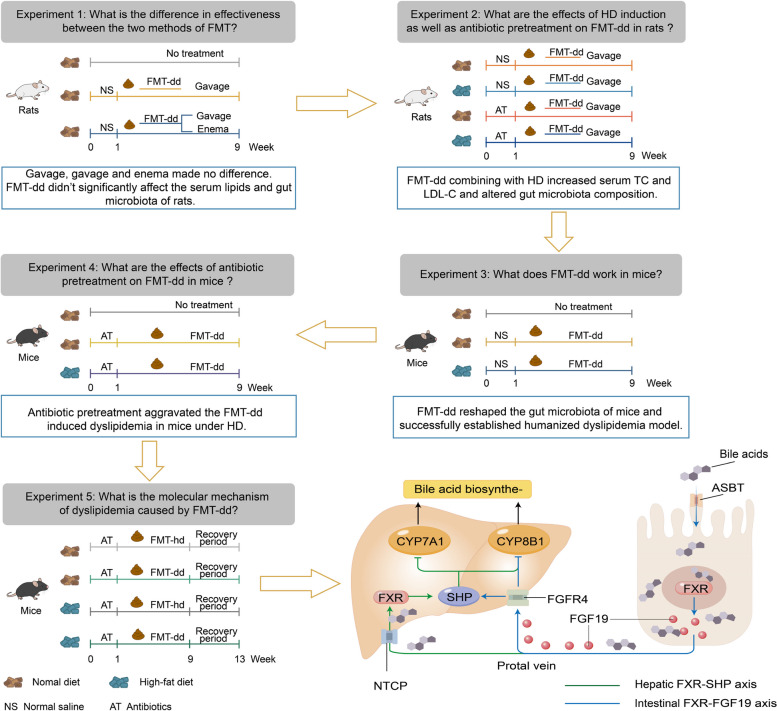
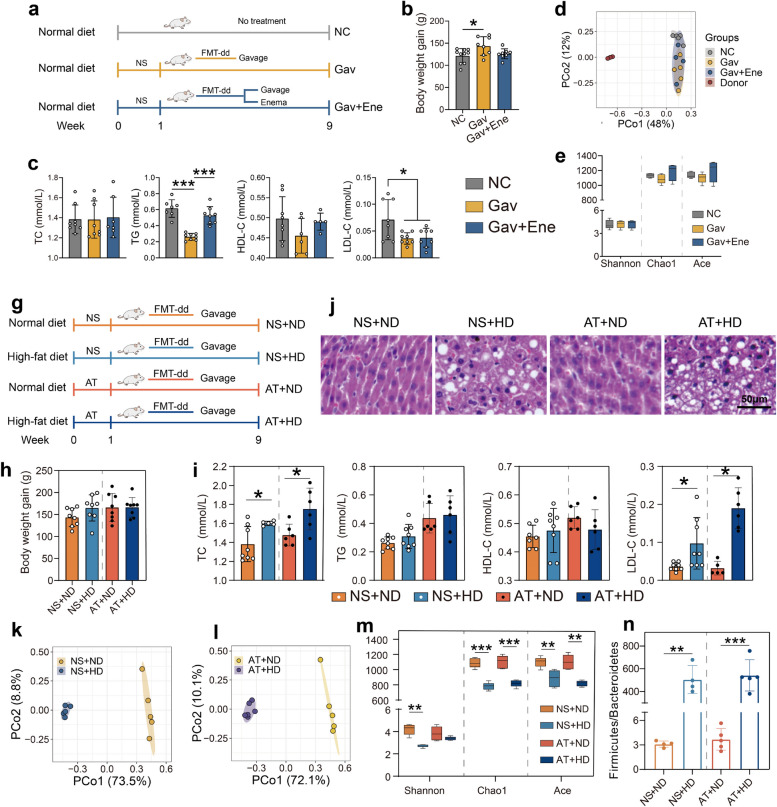
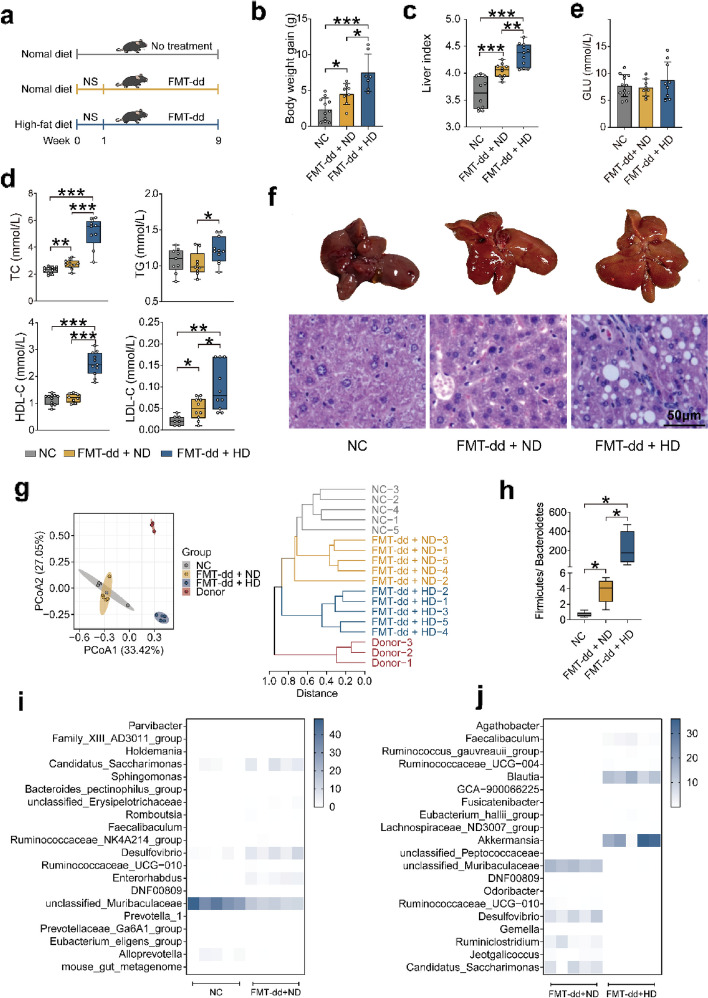
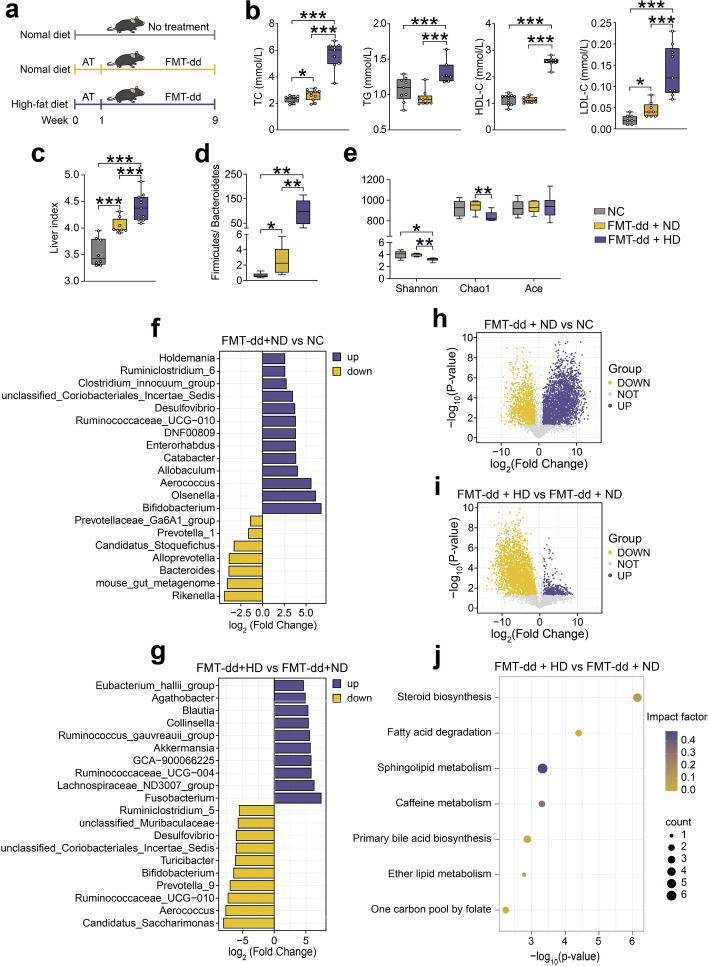
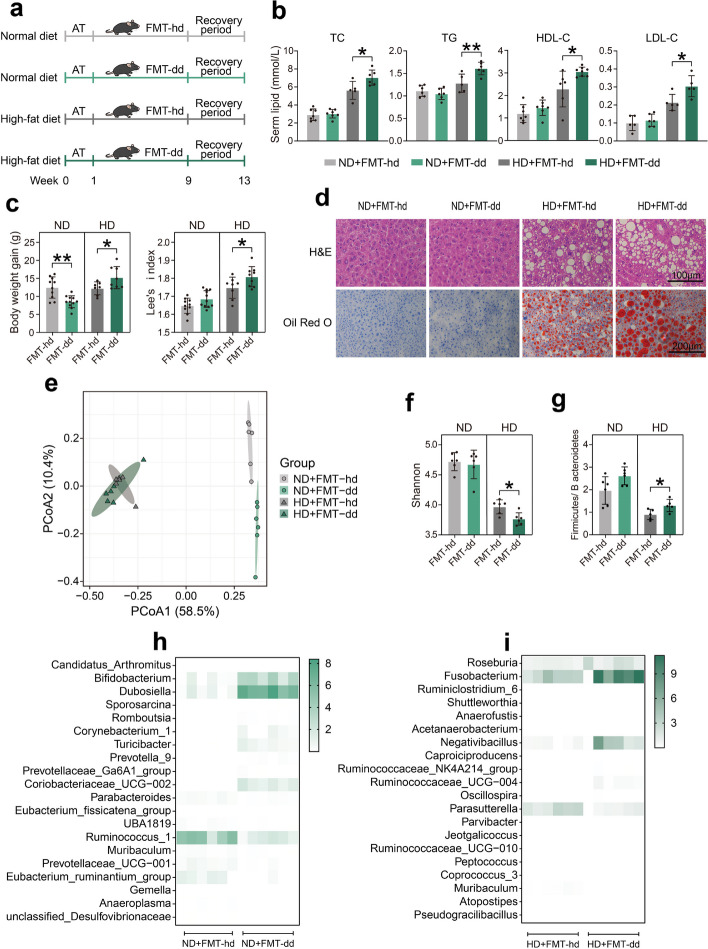
Background: Diet-induced dyslipidemia is linked to the gut microbiota, but the causality of microbiota-host interaction affecting lipid metabolism remains controversial. Here, the humanized dyslipidemia mice model was successfully built by using fecal microbiota transplantation from dyslipidemic donors (FMT-dd) to study the causal role of gut microbiota in diet-induced dyslipidemia.

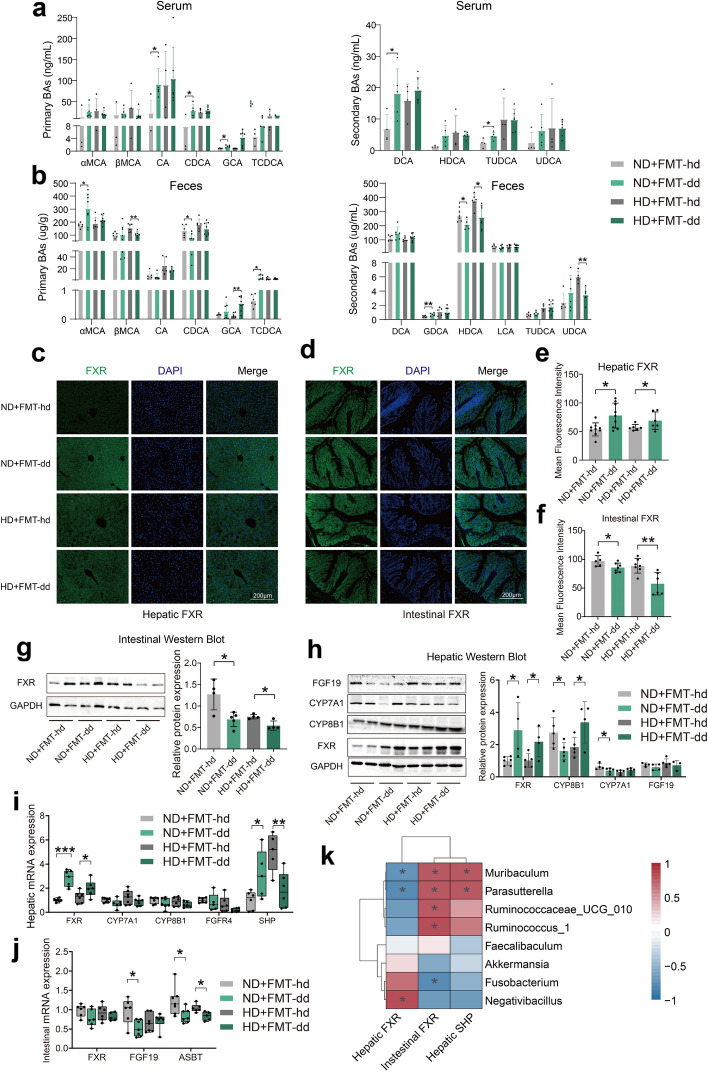
Results: We demonstrated that FMT-dd reshaped the gut microbiota of mice by increasing Faecalibaculum and Ruminococcaceae UCG-010, which then elevated serum cholicacid (CA), chenodeoxycholic acid (CDCA), and deoxycholic acid (DCA), reduced bile acid synthesis and increased cholesterol accumulation via the hepatic farnesoid X receptor-small heterodimer partner (FXR-SHP) axis. Nevertheless, high-fat diet led to decreased Muribaculum in the humanized dyslipidemia mice induced by FMT-dd, which resulted in reduced intestinal hyodeoxycholic acid (HDCA), raised bile acid synthesis and increased lipid absorption via the intestinal farnesoid X receptor-fibroblast growth factor 19 (FXR-FGF19) axis.

Conclusions: Our studies implicated that intestinal FXR is responsible for the regulation of lipid metabolism in diet-induced dyslipidemia mediated by gut microbiota-bile acid crosstalk. Video Abstract.

Keywords: Bile acid; Diet-induced humanized dyslipidemia; FXR; Gut microbiota; Lipid metabolism.


Conflict of interest statement

The authors declare no competing interests.

Figures

Fig. 1
Fig. 1
Study design and workflow. The schematic represents the research questions we attempted to answer at each step as well as the general results
Fig. 2
Fig. 2
FMT from dyslipidemic donors (FMT-dd) cannot induce dyslipidemia in rats. But FMT-dd combining with high-fat diet (HD) disrupted lipid homeostasis and altered gut microbiota in rats. a, g Experiment schematics. a After treatment of normal saline, rats were transplanted with fecal microbiota by gavage (Gav) or a combination of gavage and enema (Gav + Ene). g After pretreatment with normal saline (NS) or antibiotics (AT), rats were transplanted with fecal microbiota by gavage and fed with normal diet (ND) or high-fat diet (HD). b, h Body weight gain on the last week. c, i Serum total cholesterol (TC), triglycerides (TG), high-density lipoprotein-cholesterol (HDL-C), and low-density lipoprotein-cholesterol (LDL-C). d, k, l Principal coordinate analysis (PCoA) plot based on the Bray–Curtis of gut microbial composition. e, m The α-diversity of the gut microbiota. n The ratio of Firmicutes to Bacteroidetes. Data were expressed as mean ± SD. Differences of data were calculated by the one-way ANOVA in the GraphPad software. Source data are provided as a Source data file. *p < 0.05; ** p < 0.01; *** p < 0.001. Normal saline (NS); antibiotics (AT); normal control group (NC)
Fig. 3
Fig. 3
FMT-dd reshaped the gut microbiota then induced dyslipidemia in mice, and combination with HD promoted the phenotypes. a Experiment schematic. b Body weight gain. c Liver index level. d The serum TC, TG, HDL-C, and LDL-C levels. e The GLU level. f Liver pictures and H&E staining digital images. g PCoA plot and hierarchical clustering of OTUs based on the Bray–Curtis similarity. h Change in the ratio of Firmicutes to Bacteroidetes. i The relative abundance of differential genera between the NC and FMT-dd + ND groups. j The relative abundance of differential genera between the FMT-dd + ND and FMT-dd + HD groups. Differences of data were calculated by the unpaired T-test and one-way ANOVA in the GraphPad software. All box and whiskers plots showed the box (min to max), the median value (in the transverse line), and the whiskers (go down to the smallest value and up to the largest). Source data are provided as a Source data file. *p < 0.05, **p < 0.01, ***p < 0.001. Normal control group (NC); fecal microbiota transplantation (FMT); normal diet (ND); high-fat diet (HD); total cholesterol (TC); triglycerides (TG); high-density lipoprotein-cholesterol (HDL-C); low-density lipoprotein-cholesterol (LDL-C); serum glucose (GLU); principal coordinate analysis (PCoA); operational taxonomic units (OTU)
Fig. 4
Fig. 4
Antibiotic pretreatment aggravated the FMT-dd induced dyslipidemia in mice under HD. a Experiment workflow. b The serum TC, TG, HDL-C, and LDL-C levels. c Liver index level. d The ratio of Firmicutes to Bacteroidetes among the NC, FMT-dd + ND, and FMT-dd + HD groups. e, f The fold change of differential genera in NC and FMT-dd + ND groups as well as in FMT-dd + ND and FMT-dd + HD groups (FC > 2 or FC < 0.5, p < 0.05). g The α-diversity among the three groups. h, i Volcano plots of differential metabolites in NC and FMT-dd + ND groups as well as in FMT-dd + ND and FMT-dd + HD groups, yellow represents downregulated differential metabolites, purple for upregulated differential metabolites (FC > 2 or FC < 0.5, p < 0.05). j Significantly changed pathway between the FMT-dd + ND and FMT-dd + HD groups. Differences of data were calculated by the unpaired T-test and one-way ANOVA in the GraphPad software. All box and whiskers plots showed the box (min to max), the median value (in the transverse line), and the whiskers (go down to the smallest value and up to the largest). Source data are provided as a Source data file. *p < 0.05, **p < 0.01, ***p < 0.001. Normal control group (NC); antibiotics (AT); fecal microbiota transplantation (FMT); normal diet (ND); high-fat diet (HD); total cholesterol (TC); triglycerides (TG); high-density lipoprotein-cholesterol (HDL-C); low-density lipoprotein-cholesterol (LDL-C); fold change (FC)
Fig. 5
Fig. 5
FMT-dd caused more severe dyslipidemia under HD after a 4-week recovery period compared with FMT-hd. a Experiment schematic. b The serum TC, TG, HDL-C, and LDL-C levels. c Body weight gain in the last week and Lee’s index level. d H&E and Oil Red O staining digital images. e PCoA plot of OTUs based on the Bray–Curtis similarity among these four groups. f Change in the ratio of Firmicutes to Bacteroidetes. g Change in the Shannon index. h The relative abundance of significantly differential genera in the ND + FMT-hd and ND + FMT-dd groups. i The relative abundance of significantly differential genera in the HD + FMT-hd and HD + FMT-dd groups. All bar plots presented as mean ± standard deviation, evaluated by the unpaired T-test in the GraphPad software. Source data are provided as a Source data file. *p < 0.05, **p < 0.01, ***p < 0.001. Normal control group (NC), antibiotics (AT); fecal microbiota transplantation (FMT); normal diet (ND); high-fat diet (HD); total cholesterol (TC); triglycerides (TG); high-density lipoprotein-cholesterol (HDL-C); low-density lipoprotein-cholesterol (LDL-C); principal coordinate analysis (PCoA); operational taxonomic units (OTU)
Fig. 6
Fig. 6
FMT-dd regulates bile acid synthesis via the hepatic FXR-SHP axis under normal diet and via the intestine FXR-FGF19 axis under high-fat diet. a The composition of serum primary and secondary BAs in mice. b Fecal BA profile of mice. c, d Liver and intestinal FXR immunofluorescence images. e, f The mean fluorescence intensity of the liver and intestinal FXR. g The intestinal FXR protein expression level. h The protein expression level of FXR, CYP8B1, CYP7A1, and FGF19 in the liver. i The mRNA expression of CYP7A1, CYP8, FGFR4, FXR, and SHP in the liver. j Intestinal mRNA expression of ASBT, FGF19, and FXR. k Heatmap of correlation between the abundance of microbiota significantly regulated by FMT-dd and the expression of FXR, SHP. All bar plots are presented as mean ± standard deviation. All box and whiskers plots showed the box (min to max), the median value (in the transverse line), and the whiskers (go down to the smallest value and up to the largest). All data were evaluated by the unpaired T-test in the GraphPad software. Source data are provided as a Source data file. *p < 0.05, **p < 0.01, ***p < 0.001. Fecal microbiota transplantation from dyslipidemic donors (FMT-dd); Fecal microbiota transplantation from heathy donors (FMT-hd); normal diet (ND); high-fat diet (HD); bile acids (BAs); α-Muricholic Acid (α-MCA);β-Muricholic Acid (β-MCA);cholic acid (CA); chenodeoxycholic acid (CDCA); glycocholic acid (GCA); taurochenodeoxycholic acid (TCDCA); deoxycholic acid (DCA); glycochenodeoxycholic acid (GDCA); hyodeoxycholic acid (HDCA); lithocholic acid (LCA); taurochenodeoxycholic acid (TUDCA); ursodeoxycholic acid (UDCA); farnesoid X receptor (FXR); small heterodimer partner (SHP); cholesterol 7α-hydroxylase (CYP7A1); sterol 12α-hydroxylase (CYP8B1); fibroblast growth factor 19 (FGF19); apical sodium-bile acid transporter (ASBT); FGF receptor 4 (FGFR4); sodium-taurocholate co-transporting polypeptide(NTCP)

Similar articles

Cited by

References

    1. Rodrigues RR, Gurung M, Li Z, García-Jaramillo M, Greer R, Gaulke C, et al. Transkingdom interactions between Lactobacilli and hepatic mitochondria attenuate western diet-induced diabetes. Nat Commun. 2021;12(1):101. - PMC - PubMed
    1. Gilbert JA, Blaser MJ, Caporaso JG, Jansson JK, Lynch SV, Knight R. Current understanding of the human microbiome. Nat Med. 2018;24(4):392–400. doi: 10.1038/nm.4517. - DOI - PMC - PubMed
    1. Sonnenburg JL, Bäckhed F. Diet–microbiota interactions as moderators of human metabolism. Nature. 2016;535(7610):56–64. doi: 10.1038/nature18846. - DOI - PMC - PubMed
    1. Wahlstrom A, Sayin SI, Marschall HU, Backhed F. Intestinal Crosstalk between Bile Acids and Microbiota and Its Impact on Host Metabolism. Cell Metab. 2016;24(1):41–50. doi: 10.1016/j.cmet.2016.05.005. - DOI - PubMed
    1. Lavelle A, Sokol H. Gut microbiota-derived metabolites as key actors in inflammatory bowel disease. Nat Rev Gastroenterol Hepatol. 2020;17(4):223–237. doi: 10.1038/s41575-019-0258-z. - DOI - PubMed

Publication types

Substances

LinkOut - more resources