. 2023 Nov 9;15(22):5342.
doi: 10.3390/cancers15225342.

Antiproliferative Modulation and Pro-Apoptotic Effect of BR2 Tumor-Penetrating Peptide Formulation 2-Aminoethyl Dihydrogen Phosphate in Triple-Negative Breast Cancer

Affiliations

Antiproliferative Modulation and Pro-Apoptotic Effect of BR2 Tumor-Penetrating Peptide Formulation 2-Aminoethyl Dihydrogen Phosphate in Triple-Negative Breast Cancer

Laertty Garcia de Sousa Cabral et al. Cancers (Basel). .

Abstract

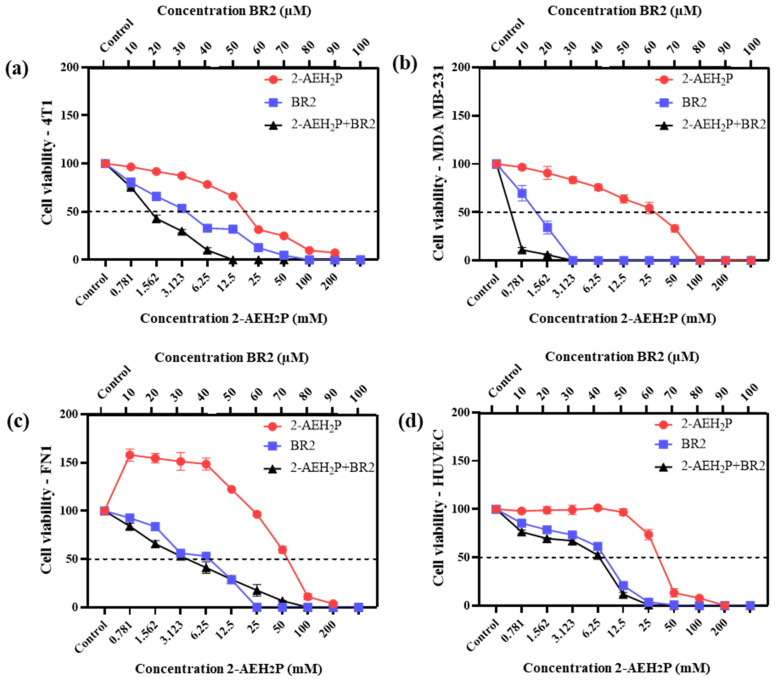
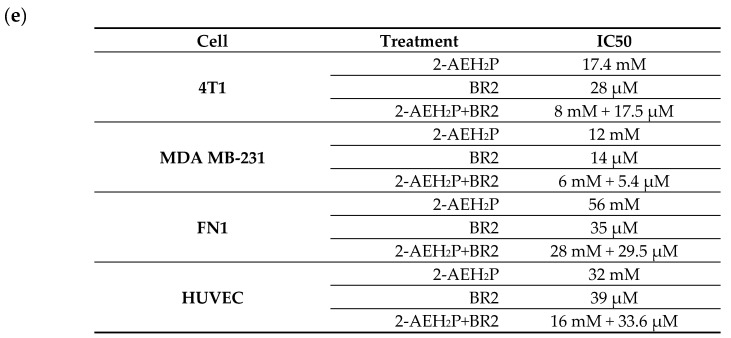
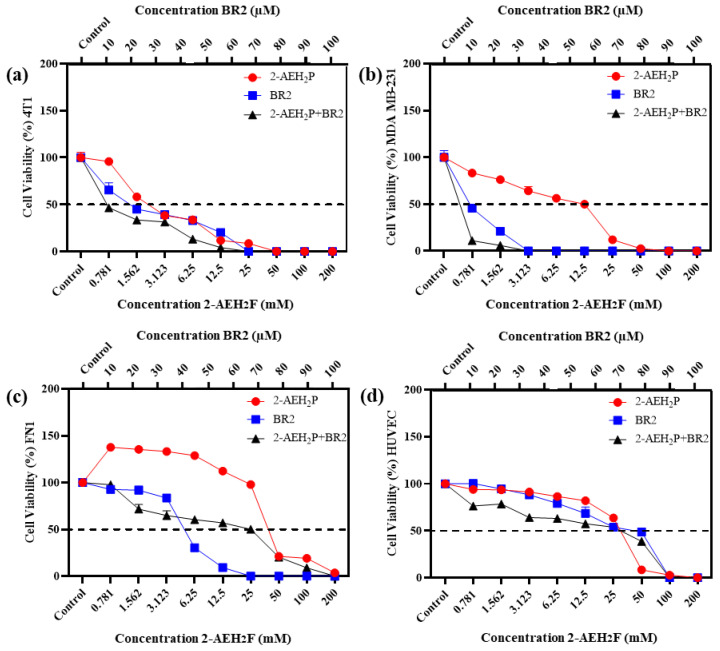
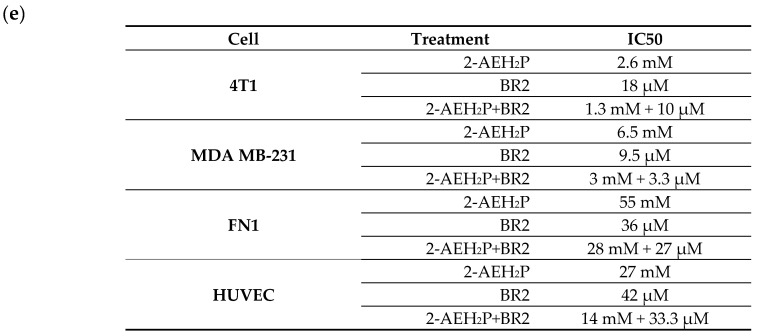
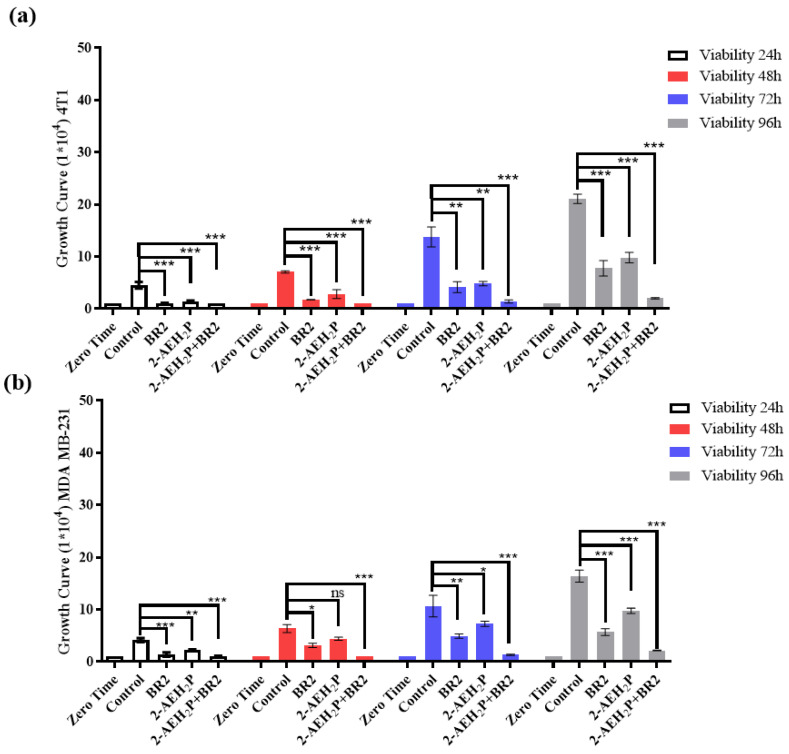
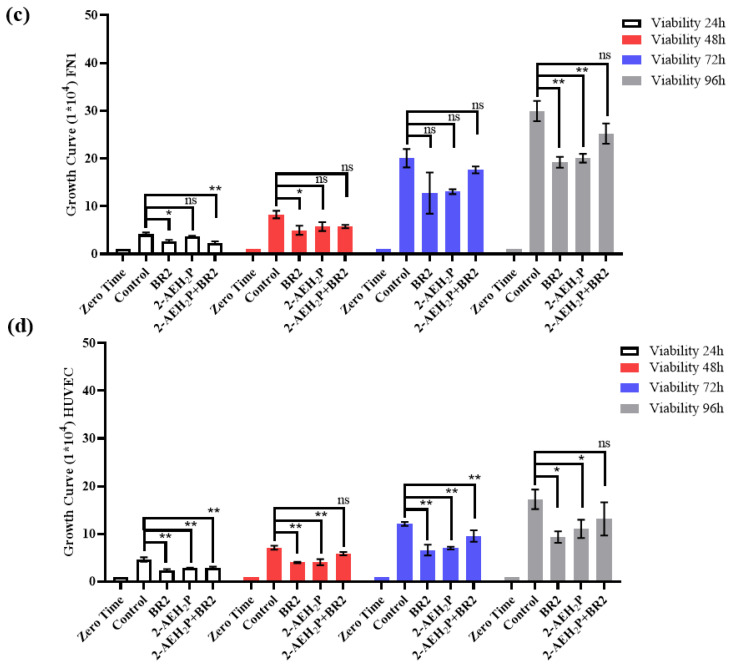
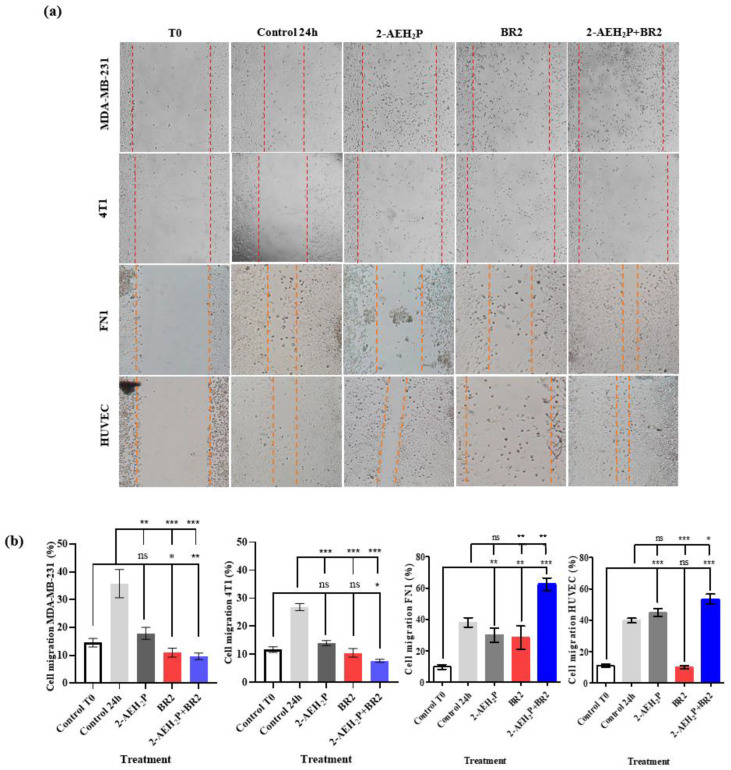
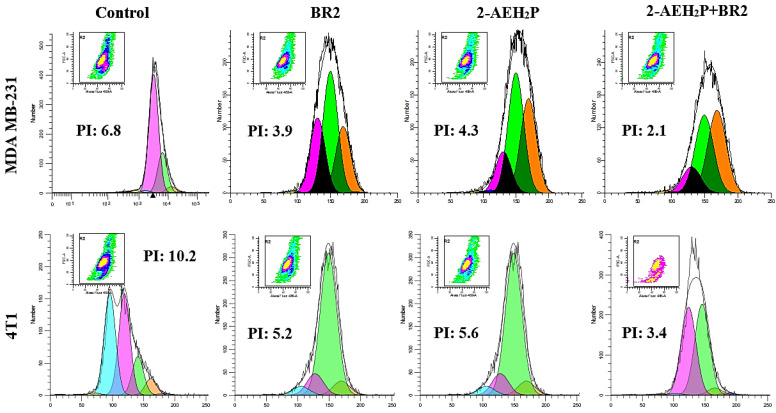
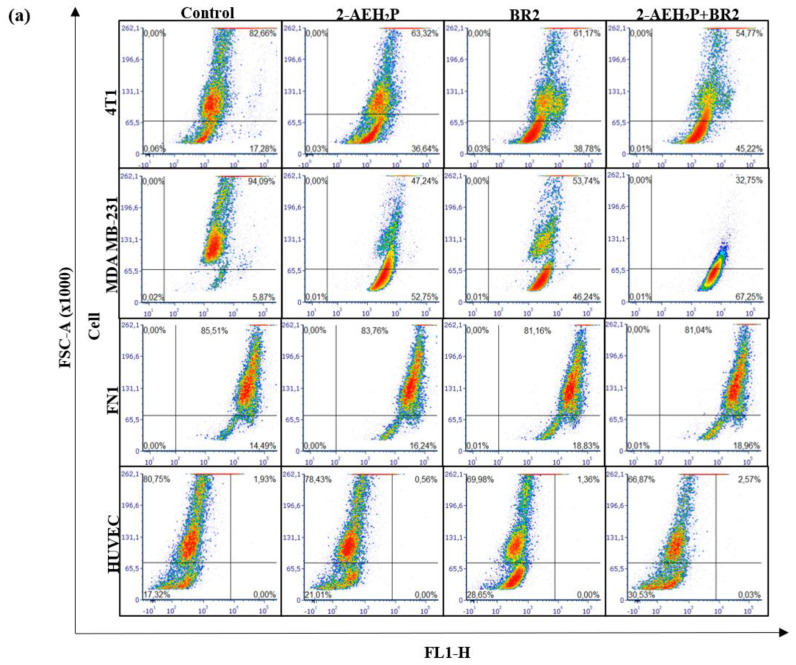
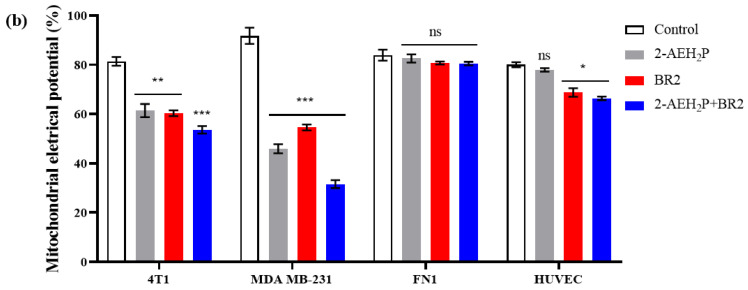
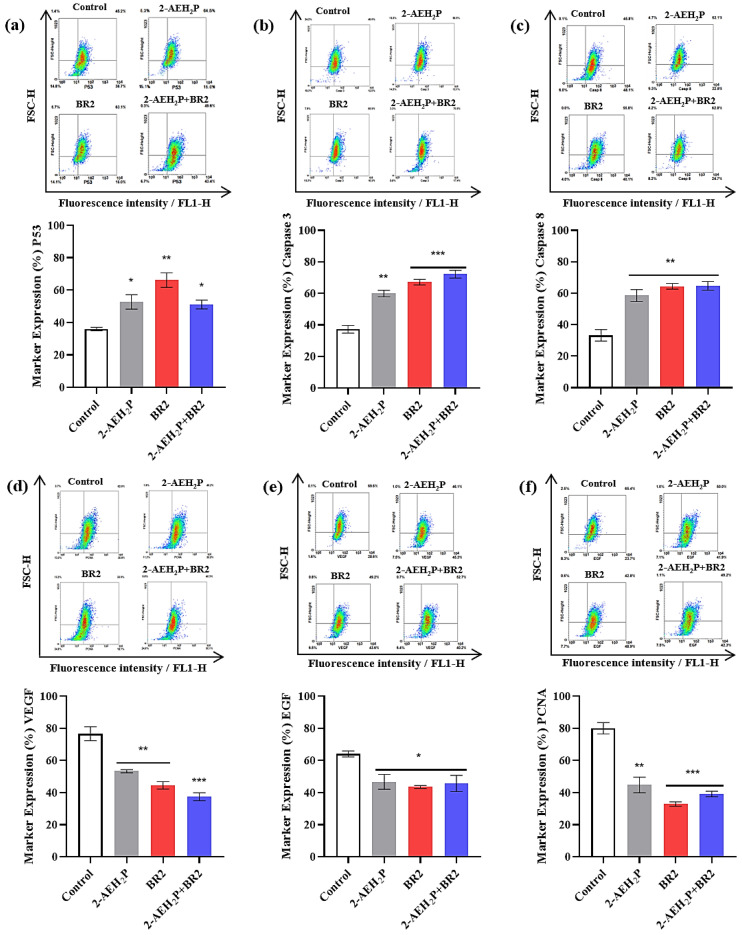
Breast cancer is the most common cancer in women, the so-called "Triple-Negative Breast Cancer" (TNBC) subtype remaining the most challenging to treat, with low tumor-free survival and poor clinical evolution. Therefore, there is a clear medical need for innovative and more efficient treatment options for TNBC. The aim of the present study was to evaluate the potential therapeutic interest of the association of the tumor-penetrating BR2 peptide with monophosphoester 2-aminoethyl dihydrogen phosphate (2-AEH2P), a monophosphoester involved in cell membrane turnover, in TNBC. For that purpose, viability, migration, proliferative capacity, and gene expression analysis of proteins involved in the control of proliferation and apoptosis were evaluated upon treatment of an array of TNBC cells with the BR2 peptide and 2-AEH2P, either separately or combined. Our data showed that, while possessing limited single-agent activity, the 2-AEH2P+BR2 association promoted significant cytotoxicity in TNBC cells but not in normal cells, with reduced proliferative potential and inhibition of cell migration. Mechanically, the 2-AEH2P+BR2 combination promoted an increase in cells expressing p53 caspase 3 and caspase 8, a reduction in cells expressing tumor progression and metastasis markers such as VEGF and PCNA, as well as a reduction in mitochondrial electrical potential. Our results indicate that the combination of the BR2 peptide with 2-AEH2P+BR2 may represent a promising therapeutic strategy in TNBC with potential use in clinical settings.

Keywords: monophosphoester; nano therapy; peptide; triple-negative breast cancer.


Conflict of interest statement

The authors declare no conflict of interest.

Figures

Figure 1
Figure 1
Cytotoxicity assessment of 2-AEH2P, BR2 peptide, or the 2-AEH2P-BR2 peptide treatments upon 24 h exposure. (a) Line graph showing the cytotoxic effect of treatments on 4T1 tumor cell; (b) Line graph showing the cytotoxic effect of treatments on MDA-MB-231 tumor cell; (c) Line graph showing the cytotoxic effect of treatments on FN1; (d) Line graph showing the cytotoxic effect of treatments on HUVEC. Line graphs showing the mean ± SD correlation of four independent experiments. (e) Summary table based on the IC50 values determined for the different treatments from the proliferation assays on tumor and normal cells.
Figure 1
Figure 1
Cytotoxicity assessment of 2-AEH2P, BR2 peptide, or the 2-AEH2P-BR2 peptide treatments upon 24 h exposure. (a) Line graph showing the cytotoxic effect of treatments on 4T1 tumor cell; (b) Line graph showing the cytotoxic effect of treatments on MDA-MB-231 tumor cell; (c) Line graph showing the cytotoxic effect of treatments on FN1; (d) Line graph showing the cytotoxic effect of treatments on HUVEC. Line graphs showing the mean ± SD correlation of four independent experiments. (e) Summary table based on the IC50 values determined for the different treatments from the proliferation assays on tumor and normal cells.
Figure 2
Figure 2
Cytotoxicity assessment of 2-AEH2P, BR2 peptide, or the 2-AEH2P-BR2 peptide treatments upon 48 h exposure. (a) Line graph showing the cytotoxic effect of treatments on 4T1 tumor cell; (b) Line graph showing the cytotoxic effect of treatments on MDA-MB-231 tumor cell; (c) Line graph showing the cytotoxic effect of treatments on FN1; (d) Line graph showing the cytotoxic effect of treatments on HUVEC. Line graphs showing the mean ± SD correlation of four independent experiments. (e) Summary table based on the IC50 values determined for the different treatments from the proliferation assays on tumor and normal cells.
Figure 2
Figure 2
Cytotoxicity assessment of 2-AEH2P, BR2 peptide, or the 2-AEH2P-BR2 peptide treatments upon 48 h exposure. (a) Line graph showing the cytotoxic effect of treatments on 4T1 tumor cell; (b) Line graph showing the cytotoxic effect of treatments on MDA-MB-231 tumor cell; (c) Line graph showing the cytotoxic effect of treatments on FN1; (d) Line graph showing the cytotoxic effect of treatments on HUVEC. Line graphs showing the mean ± SD correlation of four independent experiments. (e) Summary table based on the IC50 values determined for the different treatments from the proliferation assays on tumor and normal cells.
Figure 3
Figure 3
Growth curve of tumor and normal cells as assessed by trypan blue staining (a) Bar graphs show the proliferative capacity of 4T1 tumor cells; (b) Bar graphs show the proliferative capacity of MDA MB-231 tumor cells; (c) Bar graphs show the proliferative capacity of FN1 fibroblast normal cells; (d) Bar graphs show the proliferative capacity of HUVEC normal cells. Bar graphs showing the mean ± SD correlation of three independent experiments. Statistical differences were obtained by ANOVA and Tukey-Kramer multiple comparison test. * p < 0.05, ** p < 0.01 and *** p < 0.001. ns = not significant.
Figure 3
Figure 3
Growth curve of tumor and normal cells as assessed by trypan blue staining (a) Bar graphs show the proliferative capacity of 4T1 tumor cells; (b) Bar graphs show the proliferative capacity of MDA MB-231 tumor cells; (c) Bar graphs show the proliferative capacity of FN1 fibroblast normal cells; (d) Bar graphs show the proliferative capacity of HUVEC normal cells. Bar graphs showing the mean ± SD correlation of three independent experiments. Statistical differences were obtained by ANOVA and Tukey-Kramer multiple comparison test. * p < 0.05, ** p < 0.01 and *** p < 0.001. ns = not significant.
Figure 4
Figure 4
Evaluation of inhibition of migration potential of MDA-MB-231 and 4T1 breast adenocarcinoma cell lines by wound healing assay. (a) Photomicrographs of MDA-MB-231 and 4T1 TNBC cells and FN1 and HUVEC normal cells. Vertical lines indicate the wound formed and evolution for each treatment period (b) Bar graphs showing the average correlation ±SD of three independent experiments on the ability to inhibit migration of tumor cells exposed to the indicated treatments. Statistical differences were obtained by ANOVA and Tukey-Kramer multiple comparison test. * p < 0.05, ** p < 0.01 and *** p < 0.001. ns = not significant.
Figure 5
Figure 5
Evaluation of the proliferative index of human MDA MB-231 and murine 4T1 triple-negative breast cancer tumor cells by flow cytometry. The cells were treated with the indicated compounds for a period of 24 h. Representative histograms of the proliferative index were obtained using the WinMDI 5.0 Software. Results expressed as mean ± SD of three experiments independent of the proliferative index of tumor cells.
Figure 6
Figure 6
Analysis of mitochondrial electrical potential (ΔΨm) in MDA-MB-231 and 4T1 breast adenocarcinoma cell lines and FN1 normal human fibroblast and HUVEC endothelial cells. (a) Density Plots of tumor and normal cells with mitochondria stained with MitoRED and analyzed by flow cytometry; (b) Bar graph showing ΔΨm expressed as mean ± SD of three independent experiments. Statistical differences were obtained by ANOVA and Tukey-Kramer multiple comparison tests. * p < 0.05, ** p < 0.01 and *** p < 0.001. ns = not significant.
Figure 6
Figure 6
Analysis of mitochondrial electrical potential (ΔΨm) in MDA-MB-231 and 4T1 breast adenocarcinoma cell lines and FN1 normal human fibroblast and HUVEC endothelial cells. (a) Density Plots of tumor and normal cells with mitochondria stained with MitoRED and analyzed by flow cytometry; (b) Bar graph showing ΔΨm expressed as mean ± SD of three independent experiments. Statistical differences were obtained by ANOVA and Tukey-Kramer multiple comparison tests. * p < 0.05, ** p < 0.01 and *** p < 0.001. ns = not significant.
Figure 7
Figure 7
Analysis of the expression of markers involved in cell death, angiogenesis, and proliferation in breast adenocarcinoma cell lines MDA-MB-231 upon treatment with 2-AEH2P, BR2 peptide, or 2-AEH2P+BR2. (a) Analysis of P53 expression; (b) Analysis of caspase 3 expression; (c) Analysis of caspase 8 expression; (d) Analysis of VEGF receptor expression; (e) Analysis of EGF expression; (f) Analysis of PCNA expression. Bar graphs showing protein expression level as mean ± SD from three independent experiments. Representative density plots show the distribution of cell numbers with fluorescence intensity. Statistical differences were obtained by ANOVA and Tukey-Kramer multiple comparison tests. * p < 0.05, ** p < 0.01 and *** p < 0.001.

Similar articles

References

    1. Siegel R.L., Miller K.D., Fuchs H.E., Jemal A. Cancer statistics, 2022. CA Cancer J. Clin. 2022;72:7–33. doi: 10.3322/caac.21708. - DOI - PubMed
    1. Polyak K. Breast cancer: Origins and evolution. J. Clin. Investig. 2007;117:3155–3163. doi: 10.1172/JCI33295. - DOI - PMC - PubMed
    1. Ministerio da Saúde . Incidencia de Câncer no Brasil. Volume 1. Instituto Nacional do Câncer José de Alencar Gomes da Silva; Rio de Janeiro, Brazil: 2020. pp. 1–122.
    1. Lin N.U., Claus E., Sohl J., Razzak A.R., Arnaout A., Winer E.P. Sites of distant recurrence and clinical outcomes in patients with metastatic triple-negative breast cancer: High incidence of central nervous system metastases. Cancer. 2008;113:2638–2645. doi: 10.1002/cncr.23930. - DOI - PMC - PubMed
    1. Yin L., Duan J.J., Bian X.W., Yu S.C. Triple-negative breast cancer molecular subtyping and treatment progress. Breast Cancer Res. 2020;22:61. doi: 10.1186/s13058-020-01296-5. - DOI - PMC - PubMed