. 2023 Nov 14;15(22):5407.
doi: 10.3390/cancers15225407.

Oleic Acid Exhibits Anti-Proliferative and Anti-Invasive Activities via the PTEN/AKT/mTOR Pathway in Endometrial Cancer

Affiliations

Oleic Acid Exhibits Anti-Proliferative and Anti-Invasive Activities via the PTEN/AKT/mTOR Pathway in Endometrial Cancer

Boer Deng et al. Cancers (Basel). .

Abstract

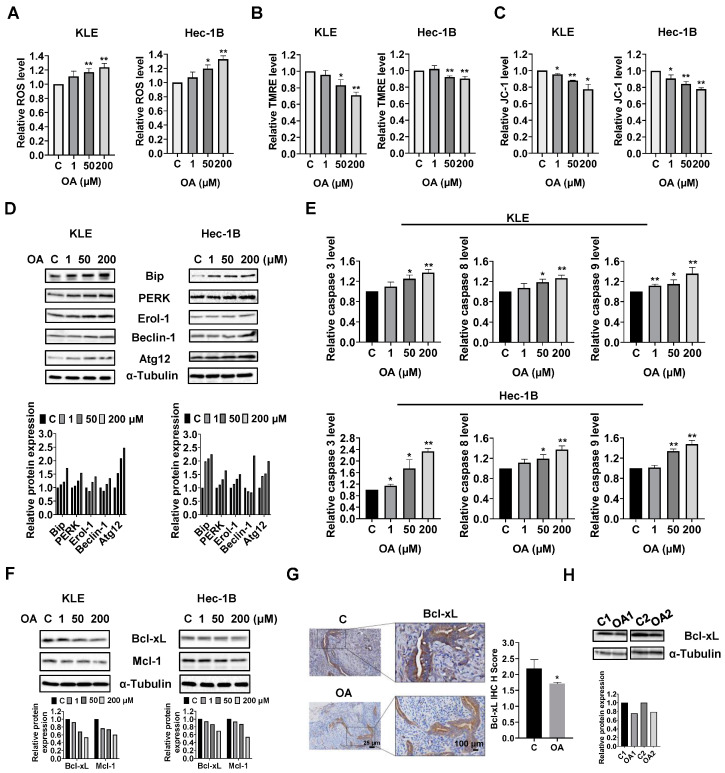
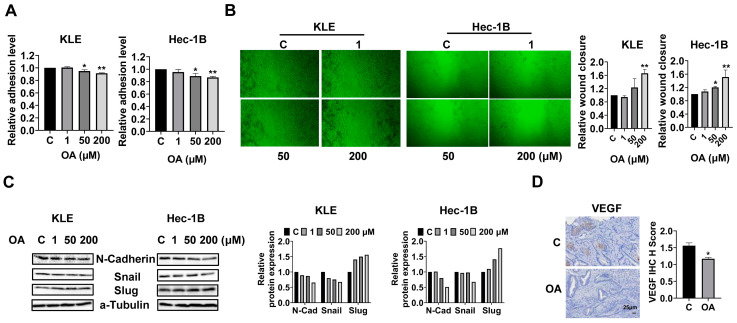
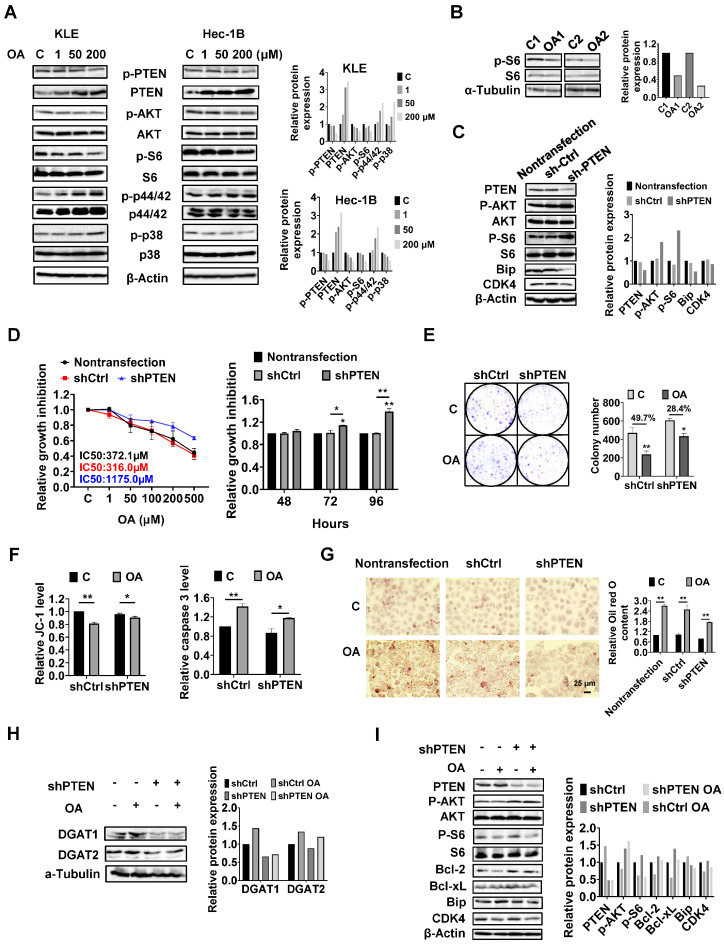
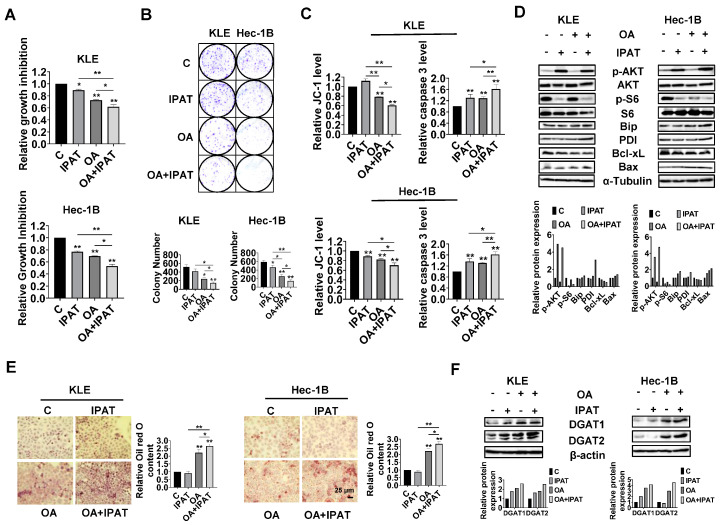
Reprogramming of fatty acid metabolism promotes cell growth and metastasis through a variety of processes that stimulate signaling molecules, energy storage, and membrane biosynthesis in endometrial cancer. Oleic acid is one of the most important monounsaturated fatty acids in the human body, which appears to have both pro- and anti-tumorigenic activities in various pre-clinical models. In this study, we evaluated the potential anti-tumor effects of oleic acid in endometrial cancer cells and the LKB1fl/flp53fl/fl mouse model of endometrial cancer. Oleic acid increased lipogenesis, inhibited cell proliferation, caused cell cycle G1 arrest, induced cellular stress and apoptosis, and suppressed invasion in endometrial cancer cells. Targeting of diacylglycerol acyltransferases 1 and 2 effectively increased the cytotoxicity of oleic acid. Moreover, oleic acid significantly increased the expression of wild-type PTEN, and knockdown of PTEN by shRNA partially reversed the anti-proliferative and anti-invasive effects of oleic acid. Inhibition of the AKT/mTOR pathway by ipatasertib effectively increased the anti-tumor activity of oleic acid in endometrial cancer cells. Oleic acid treatment (10 mg/kg, daily, oral) for four weeks significantly inhibited tumor growth by 52.1% in the LKB1fl/flp53fl/fl mice. Our findings demonstrated that oleic acid exhibited anti-tumorigenic activities, dependent on the PTEN/AKT/mTOR signaling pathway, in endometrial cancer.

Keywords: PTEN/AKT pathway; cell proliferation; endometrial cancer; invasion; lipid droplets; oleic acid.


Conflict of interest statement

The authors declare no conflict of interest.

Figures

Figure 1
Figure 1
OA inhibited cell proliferation in EC cell lines and tumor growth in LKB1fl/flp53fl/fl mice. The KLE, Hec-1B, ECC-1, Ishikawa, and AN3CA cells were treated with the indicated doses of OA for 72 h. Cell proliferation was detected using an MTT assay. OA inhibited cell growth in all four cell lines in a dose-dependent manner (A). OA inhibited cell growth in a time-dependent manner in KLE and Hec-1B cells (B). Treatment of OA at doses of 50 and 200 μM for 48 h significantly inhibited the formation of colony in KLE and Hec-1B cells (C). LKB1fl/flp53fl/fl mice were treated with OA (10 mg/kg, oral, daily) or vehicle for four weeks, and the results showed that OA effectively reduced tumor weight compared with control mice (D). IHC results showed that OA treatment reduced the expression of Ki-67 in endometrial tumor tissues of LKB1fl/flp53fl/fl mice (E). HE staining results showed that OA treatment increased the adipocyte size in adipose gonadal fat tissues and induced hepatocyte steatosis in LKB1fl/flp53fl/fl mice (F). * p < 0.05, ** p < 0.01.
Figure 2
Figure 2
Effects of OA on cellular stress, apoptosis, and autophagy in EC cells and LKB1fl/flp53fl/fl mice. KLE and Hec-1B cells were treated with 1, 50, and 200 μM OA for 6–14 h. OA significantly increased the ROS levels in both cell lines (A). The TMRE assay showed that 50 and 200 μM OA effectively decreased mitochondria membrane potential in KLE and Hec-1B cells (B). OA at a dose of 50 and 200 μM resulted in a significant decrease in JC-1 levels in KLE and Hec-1B cells (C). Western blotting results revealed that OA increased the expression of BiP, PERK, Erol-1, Beclin-1, and Atg12 proteins after treatment with OA for 24 h (D). Cleaved caspase 3, 8, and 9 activities were determined using ELISA. After treatment with 1, 50, and 200 μM OA for 14 h, the activities of cleaved caspase 3, 8, and 9 were increased in both KLE and Hec-1B cell lines (E). The expression of Bcl-xL and Mcl-1 was decreased in both cell lines after treatment with different doses of OA for 8 h (F). IHC staining showed a decrease in the expression of Bcl-xL in OA-treated LKB1fl/flp53fl/fl mice compared with that in control mice (G). Western blotting results also showed that OA inhibited the expression of Bcl-xL in EC tumor tissues of LKB1fl/flp53fl/fl mice compared with control mice (H). * p < 0.05, ** p < 0.01.
Figure 3
Figure 3
OA induced cell cycle G1 arrest. KLE and Hec-1B cells were treated with 1, 50, and 200 μM OA for 36 h, and cell cycle progression was analyzed using a Cellometer. OA induced cell cycle G1 arrest in both cell lines (A). Western blotting was performed to detect the expression of cell cycle-related proteins. OA reduced the expression of CDK4 and CDK6 in both cell lines after OA treatment (B). * p < 0.05, ** p < 0.01.
Figure 4
Figure 4
OA inhibited adhesion and invasion. Adhesive ability was detected by laminin-1 assay in the KLE and Hec-1B cells. OA inhibited cell adhesion in the KLE and Hec-1B cells (A). The wound healing assay showed that cell migration was inhibited by OA after 28 h of treatment in both cell lines (B). Western blotting showed that OA decreased the expression of N-cadherin and Snail and increased the expression of Slug in both cells after 24 h of treatment (C). IHC results indicated that treatment with OA for four weeks in LKB1fl/flp53fl/fl mice inhibited the expression of VEFG in EC tumor tissues compared with that in control mice (D). * p < 0.05, ** p < 0.01.
Figure 5
Figure 5
OA induced the accumulation of intracellular lipid droplets in EC cells. The formation of LDs in EC cells was determined by Oil red O staining assay. Treatment of OA at doses of 50 and 200 μM for 24 h significantly increased the content of LDs in both cells (A). Western blotting results showed that OA increased the expression of FAS and GLUT4 in both cells, especially at a dose of 50 μM. OA also increased the expression of DGAT1 and DGAT2 and decreased the expression of CPT1A and GLUT1 in both cells after 24 h of treatment in KLE cells. Treating cells with OA for 24 h decreased the expression of LDHA in the KLE cells and increased that in the Hec-1B cells. No significant change in the expression of ATGL in the KLE and Hec-1B cells was detected after treatment of OA for 24 h (B). IHC results indicated that treatment with OA for four weeks in LKB1fl/flp53fl/fl mice increased the expression of phosphorylated-ACC in EC tumor tissues but did not significantly affect the expression of ATGL compared with that in control mice (C). Western blotting showed that treatment of T-863 at a dose of 2.5 μM for 24 h effectively inhibited the expression of DGAT1 and that treatment of PF-06424439 at a dose of 5 μM for 24 h decreased the expression of DGAT2 in both EC cells (D). MTT assay showed that 2.5 μM T-863 or 5 μM PF-06424439, or the combination of T-863 and PF-06424439, significantly inhibited cell proliferation, and the combination of T-863 or PF-06424439 and 100 μM OA produced more potent inhibition of cell proliferation compared to single agent. The combination of T-863, PF-06424439, and OA exhibited the strongest inhibitory effect on cell proliferation in both cell lines after 72 h of treatment (E). Treatment of T-863 (2.5 μM) and PF-06424439 (5 μM) as a single agent showed no significant effects on LD formation in EC cells compared to control group. When treating cells with OA at a dose of 100 μM, either T-863 or PF-06424439 decreased the accumulation of LDs, and the combination of T-863 and PF-06424439 exhibited the strongest inhibitory effect on LD content in both cells (F). * p < 0.05, ** p < 0.01.
Figure 6
Figure 6
PTEN regulates cell proliferation, stress, apoptosis, and the formation of LDs in EC cells. The KLE and Hec-1B cells were treated with 1, 50, and 200 μM for 24 h. Western blotting results showed that OA significantly increased the expression of PTEN and decreased the expression of phosphorylated-PTEN, phosphorylated-AKT, and phosphorylated-S6 in both cell lines. Treatment of OA also induced the expression of phosphorylated-p42/44 in both cell lines, increased phosphorylation of p38 expression in the KLE cells, and decreased the expression of p38 phosphorylation in the Hec-1B cells (A). OA inhibited the expression of phosphorylated S6 in EC tumor tissues from LKB1fl/flp53fl/fl mice by Western blotting compared to control mice (B). Knockdown of PTEN using shRNA significantly decreased the level of PTEN and increased the expression of phosphorylated AKT and phosphorylated-S6 in the Hec-1B cells compared to non-transfected and shCtrl cells. The expressions of Bip and CDK4 were decreased in shPTEN cells compared to non-transfected and shCtrl cells (C). Knockdown of PTEN significantly increased the IC50 of OA in the EC cell lines, after 72 h of treatment (D). Downregulation of PTEN resulted in increased cell colony numbers compared to shCtrl cells and reduced the inhibitory effect of OA at a dose of 200 μM on cell colony formation compared to shCtrl cells (E). Similarly, JC-1 and caspase 3 assays showed that loss of PTEN partially restored mitochondrial membrane potential and cleaved caspase 3 activity in 200 μM OA-treated shPTEN cells (F). Treating the non-transfected cells, shCtrl cells, and shPTEN cells with or without OA at a dose of 200 μM for 24 h, the Oil red O results showed that there was no significant difference among the three cells without OA exposure. After treatment of OA (200 μM) for 24 h, relative Oil red O content increased 2.70-fold, 2.48-fold, and 2.21-fold in the non-transfected cells, shCtrl cells, and shPTEN cells, respectively, compared to untreated cells (G). Western blotting showed that the expression of DGAT1 and DGAT2 were suppressed after knocking down of PTEN compared to the shCtrl cells, and loss of PTEN also decreased OA-induced expression of DGAT1 and DGAT2 (H). The downregulation of PTEN partially reversed the inhibitory effects of OA on the expression of phosphorylated AKT, phosphorylated S6, Bip, Bcl-xL, Bcl-2, and CDK4 (I). * p < 0.05, ** p < 0.01.
Figure 7
Figure 7
Effect of targeting AKT on OA-induced cell growth and LD formation in EC cells. The KLE and the Hec-1B cells were treated with 20 µM IPAT, 200 μM OA, and the combination of IPAT and OA for 72 h. MTT results showed that the combination treatment produced a more potent inhibitory effect on cell proliferation compared with IPAT or OA alone in both cell lines (A). Similar results were obtained in the colony assay. Treatment of OA at a dose of 200 μM in the combination of IPAT at a dose of 20 μM for 48 h exhibited the strongest inhibitory effect on cell colony formation compared with OA or IPAT alone (B). The combination of IPAT and OA resulted in the strongest effects on reducing JC-1 levels and increasing cleaved caspase 3 activity in both cell lines compared to IPAT or OA alone (C). Western blotting results showed that the combination of IPAT and OA had a stronger inhibitory effect on phosphorylation of S6 compared with IPAT alone, OA alone, and control in both cell lines. Similarly, the combination of IPAT and OA had greater effects on increasing Bax, PDI, and Bip expression and decreasing expression of Bcl-xL than either agent alone (D). Results of Oil red O staining showed that treatment of IPAT at a dose of 20 μM for 24 h had no significant effect on the formation of LDs in both cells compared to untreated cells. The combination of OA (200 μM) and IPAT (20 μM) enhanced OA-induced LD formation in both cell lines after 24 h of treatment (E). Western blot showed that both OA at a dose of 200 μM and IPAT at a dose of 20 μM increased the expression of DGAT1 in both cells and IPAT showed no significant effect on the expression of DGAT2 in Hec-1B cells after 24 h of treatment. IPAT increased OA-induced expression of DGAT1 and DGAT2 in both cell lines after 24 h of treatment (F). * p < 0.05, ** p < 0.01.
Figure 8
Figure 8
PTEN/AKT/mTOR pathway involved in the effects of OA on adhesion and invasion in EC cells. Wound healing results showed that knockdown of PTEN significantly increased the migration of Hec-1B cells, and the inhibitory effect of OA on cell migration was attenuated after knockdown of PTEN after treatment for 28 h (A). Western immunoblotting results showed that knockdown of PTEN decreased the expression of Slug and increased the expression of Snail compared to the non-transfected and shCtrl cells (B). Exposure to 200 μM OA for 24 h lead to elevated Slug and decreased Slug in both shCtrl and shPTEN cells, and loss of PTEN attenuated the effects of OA on the expression of Snail and Slug compared to shCtrl cells (C). The results of wound healing assay showed that 20 μM IPAT alone did not affect the migratory ability of either cell line. However, the combination of IPAT and OA significantly increased the inhibitory effects of OA on cell migration in both cell lines compared to treatment with IPAT or OA alone after 28 h of treatment (D). Western immunoblotting results showed that treatment of KLE and Hec-1B cells with 200 μM OA reduced the expression of Vimentin compared to untreated cells. The combination of IPAT and OA showed a more potent inhibitory effect on Vimentin in both cells (E). * p < 0.05, ** p < 0.01.

Similar articles

Cited by

References

    1. Siegel R.L., Miller K.D., Wagle N.S., Jemal A. Cancer statistics, 2023. CA Cancer J. Clin. 2023;73:17–48. doi: 10.3322/caac.21763. - DOI - PubMed
    1. Makker V., MacKay H., Ray-Coquard I., Levine D.A., Westin S.N., Aoki D., Oaknin A. Endometrial cancer. Nat. Rev. Dis. Primers. 2021;7:88. doi: 10.1038/s41572-021-00324-8. - DOI - PMC - PubMed
    1. Colombo N., Creutzberg C., Amant F., Bosse T., Gonzalez-Martin A., Ledermann J., Marth C., Nout R., Querleu D., Mirza M.R., et al. ESMO-ESGO-ESTRO Consensus Conference on Endometrial Cancer: Diagnosis, treatment and follow-up. Ann. Oncol. 2016;27:16–41. doi: 10.1093/annonc/mdv484. - DOI - PMC - PubMed
    1. Onstad M.A., Schmandt R.E., Lu K.H. Addressing the Role of Obesity in Endometrial Cancer Risk, Prevention, and Treatment. J. Clin. Oncol. 2016;34:4225–4230. doi: 10.1200/JCO.2016.69.4638. - DOI - PMC - PubMed
    1. Renehan A.G., Tyson M., Egger M., Heller R.F., Zwahlen M. Body-mass index and incidence of cancer: A systematic review and meta-analysis of prospective observational studies. Lancet. 2008;371:569–578. doi: 10.1016/S0140-6736(08)60269-X. - DOI - PubMed