. 2023 Nov 15;15(22):5423.
doi: 10.3390/cancers15225423.

STAT2 Controls Colorectal Tumorigenesis and Resistance to Anti-Cancer Drugs

Affiliations

STAT2 Controls Colorectal Tumorigenesis and Resistance to Anti-Cancer Drugs

Mircea T Chiriac et al. Cancers (Basel). .

Abstract

Colorectal cancer (CRC) is a significant socioeconomic burden in modern society and is accountable for millions of premature deaths each year. The role of signal transducer and activator of transcription 2 (STAT2)-dependent signaling in this context is not yet fully understood, and no therapies targeting this pathway are currently being pursued. We investigated the role of STAT2 in CRC using experimental mouse models coupled with RNA-sequencing (RNA-Seq) data and functional assays with anti-cancer agents in three-dimensional tumoroids. Stat2-/- mice showed greater resistance to the development of CRC in both inflammation-driven and inflammation-independent experimental CRC models. In ex vivo studies, tumoroids derived from Stat2-/- mice with the multiple intestinal neoplasia (Min) mutant allele of the adenomatous polyposis coli (Apc) locus exhibited delayed growth, were overall smaller and more differentiated as compared with tumoroids from ApcMin/+ wildtype (WT) mice. Notably, tumoroids from ApcMin/+ Stat2-/- mice were more susceptible to anti-cancer agents inducing cell death by different mechanisms. Our findings clearly indicated that STAT2 promotes CRC and suggested that interventions targeting STAT2-dependent signals might become an attractive therapeutic option for patients with CRC.

Keywords: ApcMin/+; STAT2; anti-cancer therapy; colorectal cancer mouse model; tumoroid.


Conflict of interest statement

The authors declare no conflict of interest. The funders had no role in the design of the study; in the collection, analyses, or interpretation of data; in the writing of the manuscript; or in the decision to publish the results.

Figures

Figure 1
Figure 1
STAT2-dependent signaling controls inflammation during DSS-induced colitis and tumorigenesis in the AOM–DSS model of experimental CRC. (A) RNA-Seq data analysis was performed in colon tissue samples from WT and Stat2−/− mice (n = 4/group) from a DSS-induced colitis experiment. The original RNA-Seq data are deposited on ArrayExpress E-MTAB-12655. Heatmap focused on selected genes that have been previously associated with CRC (pathogenesis, metastasis, markers of poor prognostic); these transcripts were present among the topmost downregulated genes in the resistant Stat2−/− mice as compared with WT mice. The panel was created with the online matrix visualization and analysis software Morpheus (https://software.broadinstitute.org/morpheus, accessed on 6 October 2023). (B) Experimental model design of the AOM–DSS used in this study. (C) High-resolution mini-endoscopy pictures were taken at 4, 7, and 10 weeks after the initiation of the treatment. Individual tumors of various sizes are indicated by asterisks (left) and surrounded by dashed lines (right). Quantification of the results focusing on the tumor number, tumor score, and size distribution at 7 and 10 weeks. Scoring criteria are described in Materials and Methods. (D) The level of intestinal inflammation was scored based on five established criteria of the MEICS score as described in Materials and Methods. (E) The number and size of isolated tumors from one WT and one STAT2-deficient mouse can be appreciated macroscopically; quantification of perimeters of all tumors/mouse is displayed below. (F) Hematoxylin and eosin staining was used for the histologic assessment of colon sections; T indicates tumor. Magnifications focus on the areas within dashed lines. (G) Immunofluorescence staining of phosphorylated STAT3 in colon cross-sections. DAPI was used to stain nuclei. Abbreviations: AOM, azoxymethane; CRC, colorectal cancer; DSS, dextran sulfate sodium; ns, not significant; RNA-Seq, RNA-Sequencing; WT, wildtype. Scale bars: in (F), 1 mm for the overview and 250 µm for the inset; in (G), 250 µm. Statistics: Welch’s t-test for pairwise comparisons of WT vs. Stat2−/− in (CE); mean with SEM is presented. * p < 0.05; ** p < 0.01.
Figure 2
Figure 2
Tumor development in the ApcMin/+ model is dependent on STAT2. (A) ApcMin/+Stat2−/− mice were generated by crossing Stat2−/− to ApcMin/+ mice. High-resolution mini-endoscopy images of tumor development in the ApcMin/+ model. Asterisks indicate and dashed lines surround individual tumors. (B) Quantification of total tumor numbers, distribution according to size, and the overall tumor score. Scoring criteria are described in Materials and Methods. (C) Tumors visible by the macroscopic inspection of the intestine are indicated by dashed lines. (D) Hematoxylin and eosin staining served as the histologic visualization of tumors under the bright field microscope; T indicates tumor. (E) Western blot of protein extracts obtained from the tumor (T1-T4 and T7-T10) and non-tumor (NT5 and NT11) tissue of ApcMin/+ WT and ApcMin/+Stat2−/− mice, respectively. Protein extracts from WT (lane 6) and Stat2−/− (lane 12) mice that were not backcrossed to ApcMin/+ mice served as additional controls. Levels of phosphorylated STAT3, STAT3, and cyclin D1 were detected and levels of actin were used as protein loading control. (F) Quantification of the normalized levels (described in Materials and Methods) of signal intensities from panel E. (G) Correlations between expression levels of STAT2 and levels of STAT3 and CCND1 in CRC samples from a publicly available database (http://gepia.cancer-pku.cn/, accessed on 6 October 2023). Abbreviations: ApcMin/+ mice with the multiple intestinal neoplasia (Min) mutant allele of the adenomatous polyposis coli (Apc) locus; CCND1, cyclin D1; ns, not significant. Scale bars in (D), 200 µm. Statistics: Welch’s t-test, for pairwise comparisons of ApcMin/+ WT vs. ApcMin/+Stat2−/− in (B,F); mean with SEM is presented. Spearman Correlation Coefficient in (G). The uncropped bolts are shown in Supplementary Materials Figure S6. * p < 0.05; ** p < 0.01.
Figure 3
Figure 3
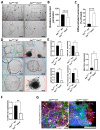
ApcMin/+ tumoroids lacking STAT2 grow slower and become more differentiated. (A) Representative light microscopy images were taken two days after three-dimensional tumoroids produced from ApcMin/+ WT and ApcMin/+ Stat2−/− mice had been passaged. Magnifications below focus on individual tumoroids as indicated by the dashed lines in the pictures above. (B) Perimeters of 50 tumoroids/group were measured and values from ApcMin/+ Stat2−/− were then divided by the values of the corresponding ApcMin/+ WT tumoroids to obtain the relative tumoroid perimeter. (C,D) Differentiation was followed in more than 25 tumoroids/group. Thickening of the tumoroid wall, darkening of the tumoroid, accumulation of dead cells in the middle, or cell shedding as well as tumoroid budding served as criteria for assessing the differentiation status in tumoroids. In (D), blue or green arrows indicate less differentiated tumoroids and red arrows indicate highly differentiated tumoroids. Magnifications presented in the two lowest rows focus on individual tumoroids as indicated by the dashed lines in the pictures above. (E) Expression levels of epithelial stem cell/cancer stem cell markers (Axin2, Cd44, Lgr5, Prom1/Cd133) and the differentiation marker Muc2 assessed by quantitative polymerase chain reaction relative to Actb. (F) Levels of Ccnd1, which controls the proliferation of intestinal epithelial cells, were measured by quantitative polymerase chain reaction relative to Actb. (G) Staining of pSTAT3 in tumoroids is indicated by arrows. EpCAM served as a specific marker for intestinal epithelial cells and Hoechst was used to stain nuclei. Abbreviations: Ccnd1, cyclin D1. Scale bars: in (A), 500 µm in the upper panels and 200 µm in the lower panels; in (D), 200 µm in the upper panels and 100 µm in the middle and lower panels; in (G), 50 µm. Statistics: Welch’s t-test in (B,C) and Mann–Whitney test in (E,F); mean with SEM is presented. * p < 0.05; ** p < 0.01; **** p < 0.0001.
Figure 4
Figure 4
Cisplatin is highly effective in killing ApcMin/+ tumoroids in a dose- and time-dependent manner, especially in cells lacking STAT2. (A,B) Light microscopy was used to follow the effect of 100 µM Cisplatin in ApcMin/+ WT and ApcMin/+ Stat2−/− mice at (A) 36 h and (B) 72 h. Red arrows in A and B indicate highly differentiated/dead tumoroids. (C) The level of cell death in tumoroids that have been stimulated with three different doses of Cisplatin was assessed by counting the number of dead tumoroids in multiple wells/condition under the light microscope. Only living tumoroids as of day zero were considered and their faith over the next 72 h is reflected by the graphs at 36 and 72 h in (C). Abbreviations: ns, not significant. The mean with SEM is presented. ** p < 0.01; **** p < 0.0001.
Figure 5
Figure 5
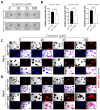
ApcMin/+ Stat2−/− are exquisitely sensitive to the effects of Cisplatin as revealed by the early cessation of mitochondrial activity and almost absolute cell death after 48 h of stimulation. (A,B) The MTT-formazan assay was used to investigate the effects of Cisplatin stimulation on the mitochondrial activity of tumoroids derived from ApcMin/+ Stat2−/− and ApcMin/+ WT mice. (A) The presence of formazan precipitates which is proportional to the mitochondrial activity of living cells can be readily observed macroscopically by appreciating the black spots in the treated wells. The concentrations of the anti-cancer drug used in the assay are indicated above the images. (B) Quantification of the results from the MTT-formazan assay after 48 h of stimulation with Cisplatin is presented relative to unstimulated control wells for which viability was set as a reference at 100%. (C,D) Induction of cell death by three different doses of Cisplatin was evaluated by fluorescence microscopy after co-staining of ApcMin/+ Stat2−/− and ApcMin/+ WT tumoroids with propidium iodide (red staining—dead cells) and Hoechst (blue staining—dead as well as living cells) at an early (two days) and a late (four days) time point. For each condition, a total of three pictures were taken (bright field, propidium iodide, and Hoechst), and merging these three individual channels produced the lower right image of each panel. The increased presence of magenta in these merged channels indicates higher rates of killed tumoroids (e.g., the lowest row at day 4, all ApcMin/+ Stat2−/− are dead, irrespective of the Cisplatin dose). Scale bars, 500 µm in (C,D). Statistics: Welch’s t-test in (B); mean with SEM is presented. * p < 0.05; ** p < 0.01.

Similar articles

Cited by

References

    1. Siegel R.L., Miller K.D., Goding Sauer A., Fedewa S.A., Butterly L.F., Anderson J.C., Cercek A., Smith R.A., Jemal A. Colorectal cancer statistics, 2020. CA Cancer J. Clin. 2020;70:145–164. doi: 10.3322/caac.21601. - DOI - PubMed
    1. Siegel R.L., Miller K.D., Wagle N.S., Jemal A. Cancer statistics, 2023. CA Cancer J Clin. 2023;73:17–48. doi: 10.3322/caac.21763. - DOI - PubMed
    1. Beaugerie L., Itzkowitz S.H. Cancers complicating inflammatory bowel disease. N. Engl. J. Med. 2015;372:1441–1452. doi: 10.1056/NEJMra1403718. - DOI - PubMed
    1. Kim E.R., Chang D.K. Colorectal cancer in inflammatory bowel disease: The risk, pathogenesis, prevention and diagnosis. World J. Gastroenterol. WJG. 2014;20:9872–9881. doi: 10.3748/wjg.v20.i29.9872. - DOI - PMC - PubMed
    1. Kaser A., Zeissig S., Blumberg R.S. Inflammatory bowel disease. Annu. Rev. Immunol. 2010;28:573–621. doi: 10.1146/annurev-immunol-030409-101225. - DOI - PMC - PubMed

LinkOut - more resources