

CBCT-to-CT Synthesis for Cervical Cancer Adaptive Radiotherapy via U-Net-Based Model Hierarchically Trained with Hybrid Dataset
- PMID: 38001738
- PMCID: PMC10670900
- DOI: 10.3390/cancers15225479
CBCT-to-CT Synthesis for Cervical Cancer Adaptive Radiotherapy via U-Net-Based Model Hierarchically Trained with Hybrid Dataset
Abstract
Purpose: To develop a deep learning framework based on a hybrid dataset to enhance the quality of CBCT images and obtain accurate HU values.
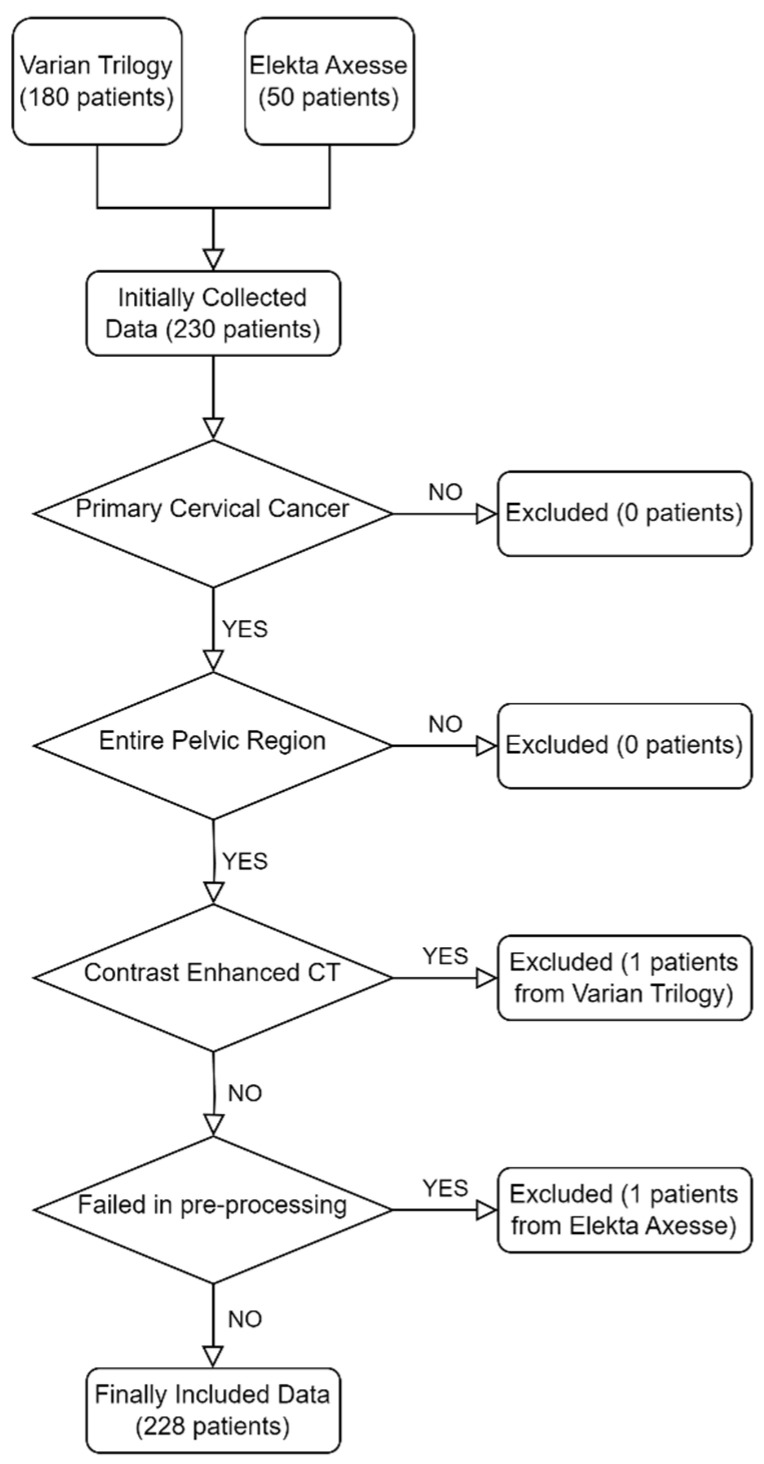
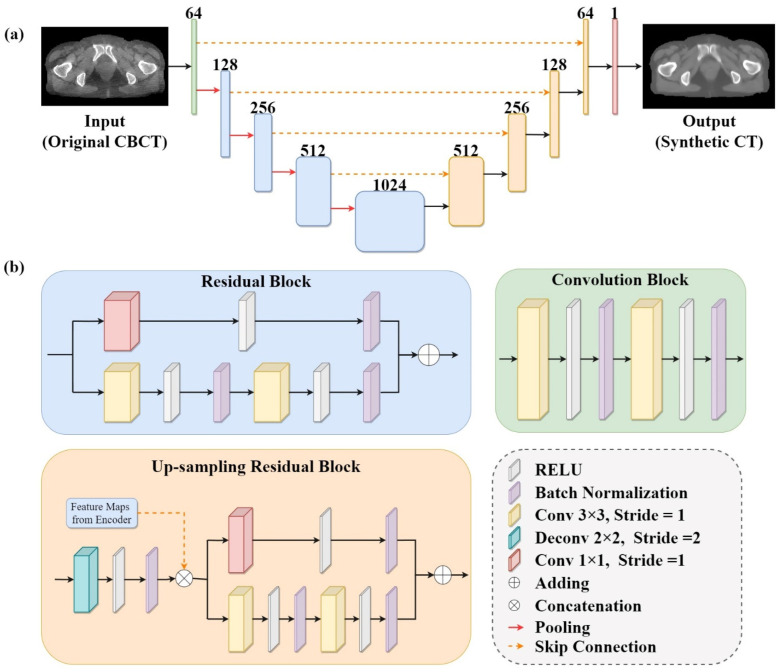
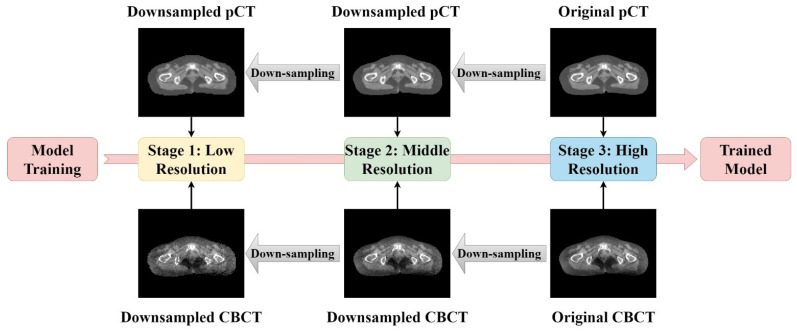
Materials and methods: A total of 228 cervical cancer patients treated in different LINACs were enrolled. We developed an encoder-decoder architecture with residual learning and skip connections. The model was hierarchically trained and validated on 5279 paired CBCT/planning CT images and tested on 1302 paired images. The mean absolute error (MAE), peak signal to noise ratio (PSNR), and structural similarity index (SSIM) were utilized to access the quality of the synthetic CT images generated by our model.
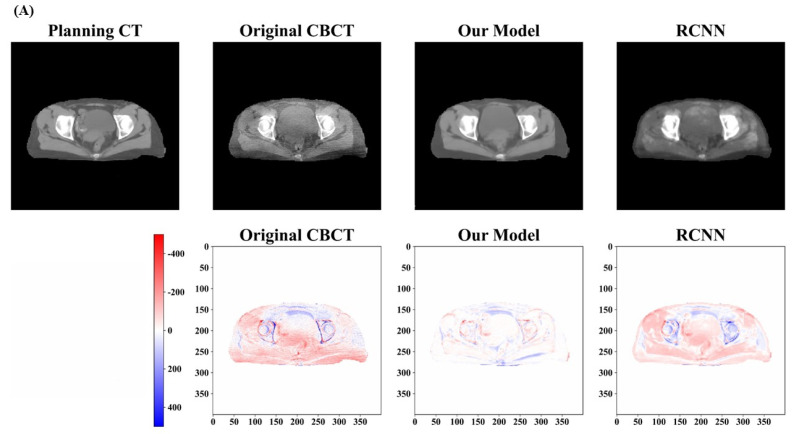
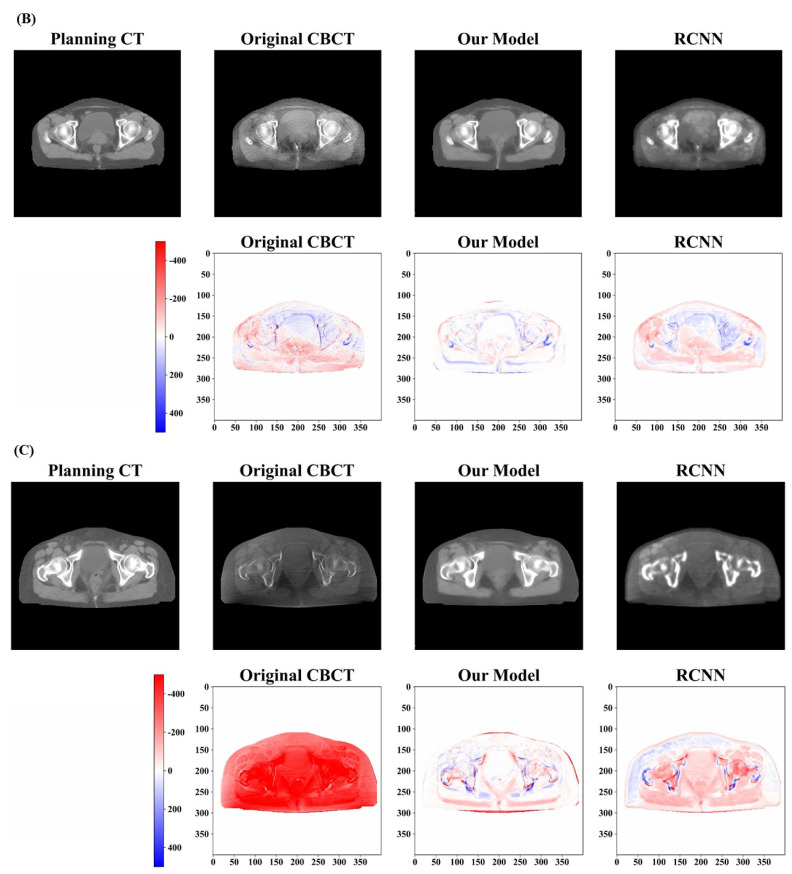
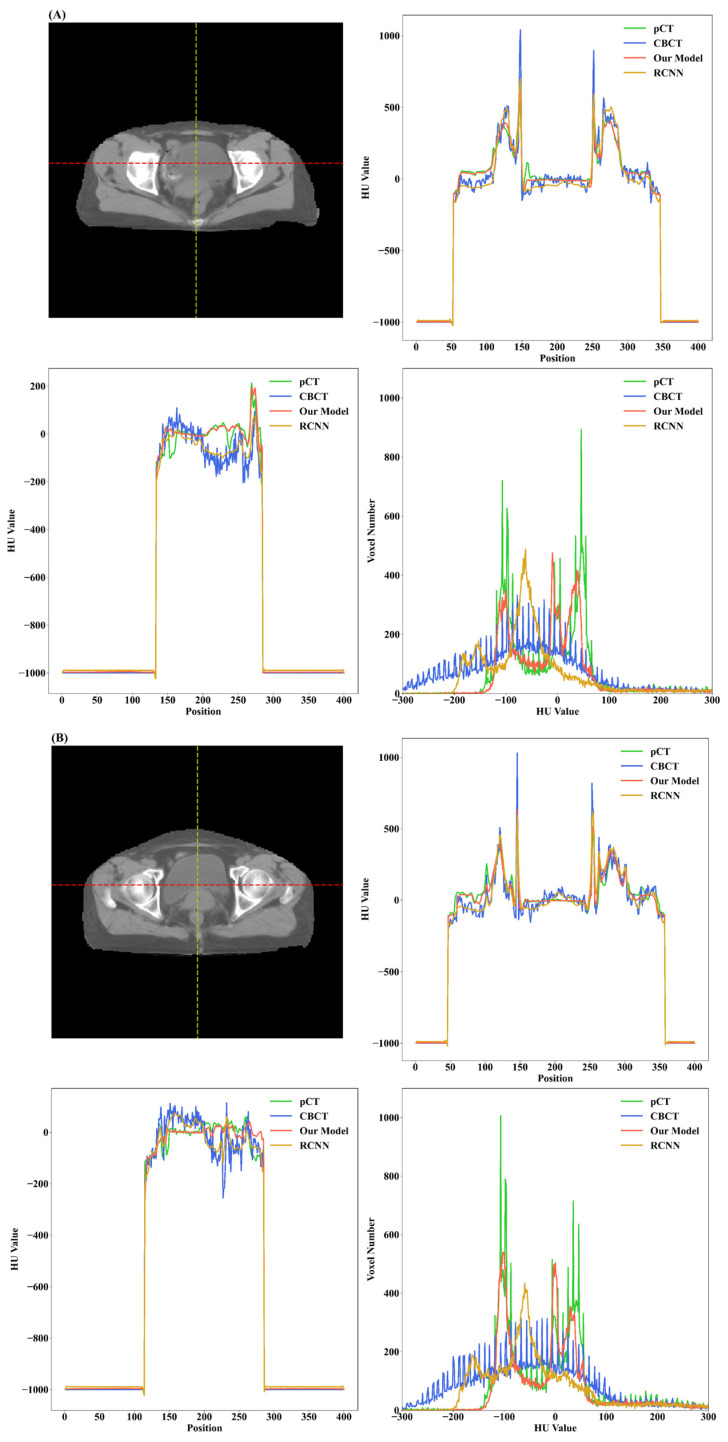
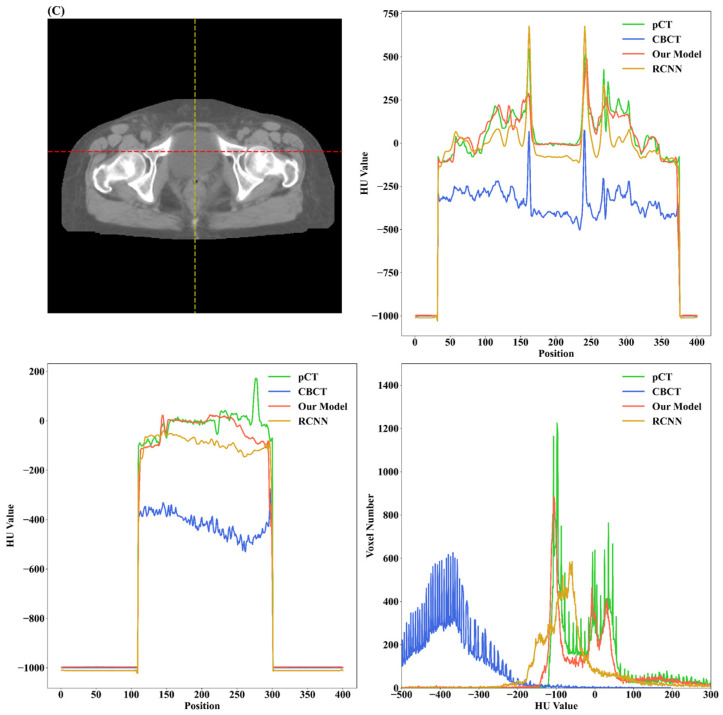
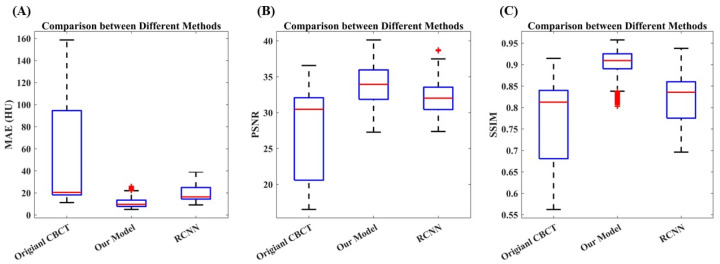
Results: The MAE between synthetic CT images generated by our model and planning CT was 10.93 HU, compared to 50.02 HU for the CBCT images. The PSNR increased from 27.79 dB to 33.91 dB, and the SSIM increased from 0.76 to 0.90. Compared with synthetic CT images generated by the convolution neural networks with residual blocks, our model had superior performance both in qualitative and quantitative aspects.
Conclusions: Our model could synthesize CT images with enhanced image quality and accurate HU values. The synthetic CT images preserved the edges of tissues well, which is important for downstream tasks in adaptive radiotherapy.
Keywords: adaptive radiotherapy; artifacts removal; cervical cancer; hierarchical training; image enhancement; synthetic CT.
Conflict of interest statement
The authors declare no conflict of interest.
Figures
Similar articles
-
Head and neck synthetic CT generated from ultra-low-dose cone-beam CT following Image Gently Protocol using deep neural network.Med Phys. 2022 May;49(5):3263-3277. doi: 10.1002/mp.15585. Epub 2022 Mar 14. Med Phys. 2022. PMID: 35229904
-
CBCT-based synthetic CT image generation using a diffusion model for CBCT-guided lung radiotherapy.Med Phys. 2024 Nov;51(11):8168-8178. doi: 10.1002/mp.17328. Epub 2024 Aug 1. Med Phys. 2024. PMID: 39088750
-
Streaking artifact reduction for CBCT-based synthetic CT generation in adaptive radiotherapy.Med Phys. 2023 Feb;50(2):879-893. doi: 10.1002/mp.16017. Epub 2022 Oct 18. Med Phys. 2023. PMID: 36183234
-
Generating synthetic images from cone beam computed tomography using self-attention residual UNet for head and neck radiotherapy.Phys Imaging Radiat Oncol. 2023 Nov 17;28:100512. doi: 10.1016/j.phro.2023.100512. eCollection 2023 Oct. Phys Imaging Radiat Oncol. 2023. PMID: 38111501 Free PMC article.
-
Generating synthetic CT from low-dose cone-beam CT by using generative adversarial networks for adaptive radiotherapy.Radiat Oncol. 2021 Oct 14;16(1):202. doi: 10.1186/s13014-021-01928-w. Radiat Oncol. 2021. PMID: 34649572 Free PMC article.
Cited by
-
Deep learning-based synthetic CT for dosimetric monitoring of combined conventional radiotherapy and lattice boost in large lung tumors.Radiat Oncol. 2025 Jan 22;20(1):12. doi: 10.1186/s13014-024-02568-6. Radiat Oncol. 2025. PMID: 39844209 Free PMC article.
-
Deep learning-based target tracking with X-ray images for radiotherapy: a narrative review.Quant Imaging Med Surg. 2024 Mar 15;14(3):2671-2692. doi: 10.21037/qims-23-1489. Epub 2024 Mar 7. Quant Imaging Med Surg. 2024. PMID: 38545053 Free PMC article. Review.
References
Grants and funding
- No. 2021YFE0202500/the National Key Research and Development Program
- MHP/005/20/Mainland-Hong Kong Joint Funding Scheme 474 (MHKJFS)
- HMRF 09200576/Health and Medical Research Fund, the Health Bureau, The Government of the Hong Kong Special Administrative Region
- Z221100003522028/Beijing Municipal Commission of Science and Technology Collaborative Innovation Project
- Z230003/Beijing Natural Science Foundation
LinkOut - more resources
Full Text Sources
Other Literature Sources
Miscellaneous
