

Chronic Intermittent Hypoxia-Induced Dysmetabolism Is Associated with Hepatic Oxidative Stress, Mitochondrial Dysfunction and Inflammation
- PMID: 38001763
- PMCID: PMC10669005
- DOI: 10.3390/antiox12111910
Chronic Intermittent Hypoxia-Induced Dysmetabolism Is Associated with Hepatic Oxidative Stress, Mitochondrial Dysfunction and Inflammation
Abstract
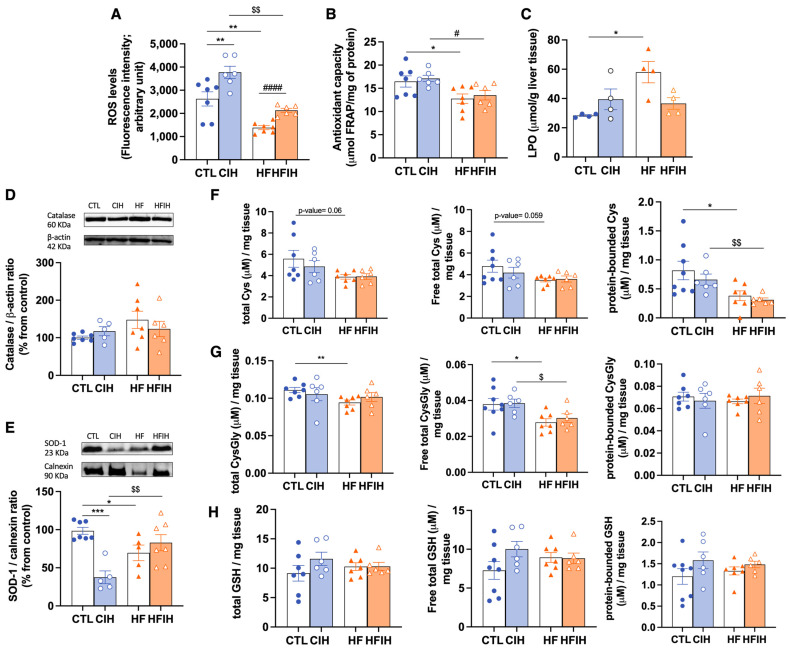
The association between obstructive sleep apnea (OSA) and metabolic disorders is well-established; however, the underlying mechanisms that elucidate this relationship remain incompletely understood. Since the liver is a major organ in the maintenance of metabolic homeostasis, we hypothesize that liver dysfunction plays a crucial role in the pathogenesis of metabolic dysfunction associated with obstructive sleep apnea (OSA). Herein, we explored the underlying mechanisms of this association within the liver. Experiments were performed in male Wistar rats fed with a control or high fat (HF) diet (60% lipid-rich) for 12 weeks. Half of the groups were exposed to chronic intermittent hypoxia (CIH) (30 hypoxic (5% O2) cycles, 8 h/day) that mimics OSA, in the last 15 days. Insulin sensitivity and glucose tolerance were assessed. Liver samples were collected for evaluation of lipid deposition, insulin signaling, glucose homeostasis, hypoxia, oxidative stress, antioxidant defenses, mitochondrial biogenesis and inflammation. Both the CIH and HF diet induced dysmetabolism, a state not aggravated in animals submitted to HF plus CIH. CIH aggravates hepatic lipid deposition in obese animals. Hypoxia-inducible factors levels were altered by these stimuli. CIH decreased the levels of oxidative phosphorylation complexes in both groups and the levels of SOD-1. The HF diet reduced mitochondrial density and hepatic antioxidant capacity. The CIH and HF diet produced alterations in cysteine-related thiols and pro-inflammatory markers. The results obtained suggest that hepatic mitochondrial dysfunction and oxidative stress, leading to inflammation, may be significant factors contributing to the development of dysmetabolism associated with OSA.
Keywords: chronic intermittent hypoxia; inflammation; insulin resistance; metabolic disorders; mitochondrial dysfunction; obstructive sleep apnea; oxidative stress.
Conflict of interest statement
The authors declare no conflict of interest.
Figures


Similar articles
-
Chronic Intermittent Hypoxia Induces Early-Stage Metabolic Dysfunction Independently of Adipose Tissue Deregulation.Antioxidants (Basel). 2021 Jul 30;10(8):1233. doi: 10.3390/antiox10081233. Antioxidants (Basel). 2021. PMID: 34439481 Free PMC article.
-
Sex-dependent effects of chronic intermittent hypoxia: implication for obstructive sleep apnea.Biol Sex Differ. 2024 Apr 25;15(1):38. doi: 10.1186/s13293-024-00613-3. Biol Sex Differ. 2024. PMID: 38664845 Free PMC article.
-
Down-regulation of vascular PPAR-γ contributes to endothelial dysfunction in high-fat diet-induced obese mice exposed to chronic intermittent hypoxia.Biochem Biophys Res Commun. 2017 Oct 14;492(2):243-248. doi: 10.1016/j.bbrc.2017.08.058. Epub 2017 Aug 16. Biochem Biophys Res Commun. 2017. PMID: 28822761
-
Role of Carotid Body in Intermittent Hypoxia-Related Hypertension.Curr Hypertens Rep. 2017 May;19(5):38. doi: 10.1007/s11906-017-0735-0. Curr Hypertens Rep. 2017. PMID: 28451849 Review.
-
Effect of chronic intermittent hypoxia on gene expression profiles of rat liver: a better understanding of OSA-related liver disease.Sleep Breath. 2020 Jun;24(2):761-770. doi: 10.1007/s11325-019-01987-0. Epub 2019 Dec 16. Sleep Breath. 2020. PMID: 31845084 Review.
Cited by
-
Characterization of circRNA expression profiles and functional roles in a mouse model of liver injury induced by OSA.Sci Rep. 2025 May 4;15(1):15615. doi: 10.1038/s41598-025-99612-6. Sci Rep. 2025. PMID: 40320447 Free PMC article.
-
Ocular Inflammation and Oxidative Stress as a Result of Chronic Intermittent Hypoxia: A Rat Model of Sleep Apnea.Antioxidants (Basel). 2024 Jul 22;13(7):878. doi: 10.3390/antiox13070878. Antioxidants (Basel). 2024. PMID: 39061946 Free PMC article.
-
The genetic overlap and causal relationship between attention deficit hyperactivity disorder and obstructive sleep apnea: a large-scale genomewide cross-trait analysis.BMC Psychiatry. 2025 May 6;25(1):454. doi: 10.1186/s12888-025-06899-w. BMC Psychiatry. 2025. PMID: 40329273 Free PMC article.
-
Effect of high-altitude hypoxia on function and cytoarchitecture of rats' liver.Sci Rep. 2025 Apr 14;15(1):12771. doi: 10.1038/s41598-025-97863-x. Sci Rep. 2025. PMID: 40229399 Free PMC article.
-
Association between the triglyceride glucose index and obstructive sleep apnea and its symptoms: results from the NHANES.Lipids Health Dis. 2024 May 6;23(1):133. doi: 10.1186/s12944-024-02125-w. Lipids Health Dis. 2024. PMID: 38705980 Free PMC article.
References
Grants and funding
- GIFT - Grupo de Investigação Fundamental e Translacional/Portuguese Society of Diabetes
- excellence program #CCVC8485/Junta Castilla y Léon, Spain
- CEECIND/04266/2017/Portuguese Foundation for Science and Technology
- CEEC IND/02428/2018/Portuguese Foundation for Science and Technology
- 2021.03439.CEECIND/Portuguese Foundation for Science and Technology
- FCT UMIB - UIDB/00215/2020/Portuguese Foundation for Science and Technology
- UIDP/00215/2020/Portuguese Foundation for Science and Technology
- ITR - Laboratory for Integrative and Translational Research in Population Health (LA/P/0064/2020/Portuguese Foundation for Science and Technology
- UI/BD/150750/2020/Portuguese Foundation for Science and Technology
LinkOut - more resources
Full Text Sources
Research Materials
Miscellaneous
