. 2023 Nov 3;12(11):1962.
doi: 10.3390/antiox12111962.

Melatonin Alleviates the Impairment of Muscle Bioenergetics and Protein Quality Control Systems in Leptin-Deficiency-Induced Obesity

Affiliations

Melatonin Alleviates the Impairment of Muscle Bioenergetics and Protein Quality Control Systems in Leptin-Deficiency-Induced Obesity

Yaiza Potes et al. Antioxidants (Basel). .

Abstract

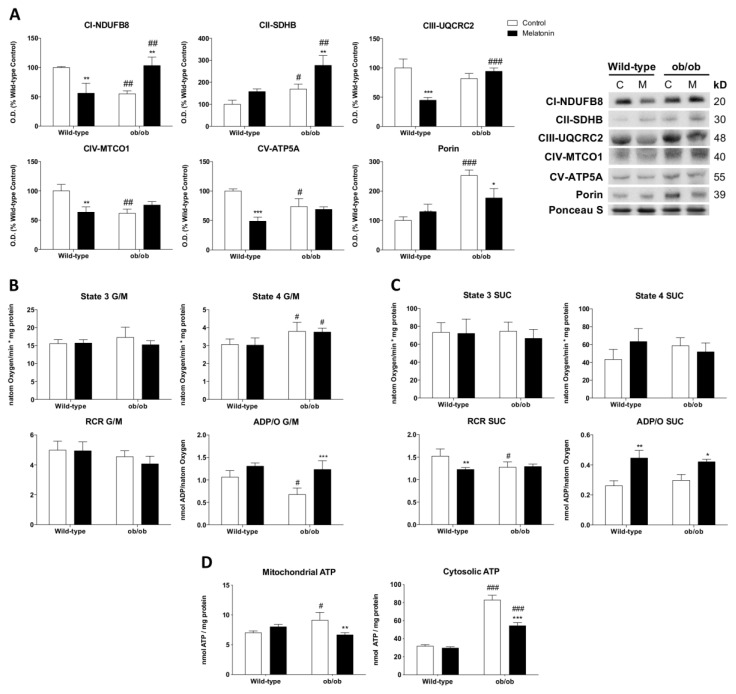
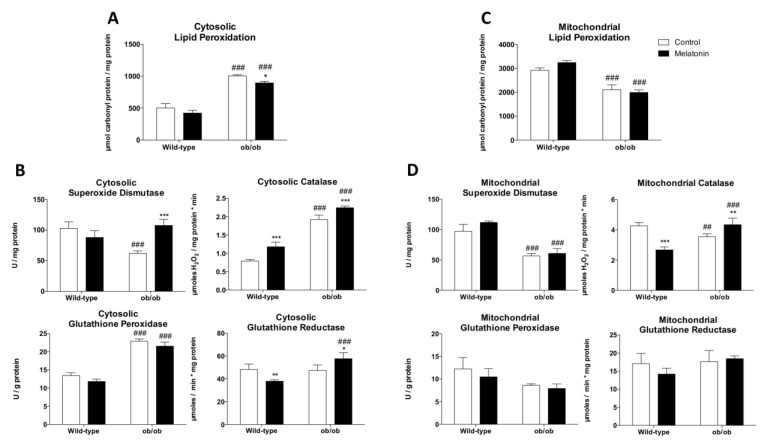
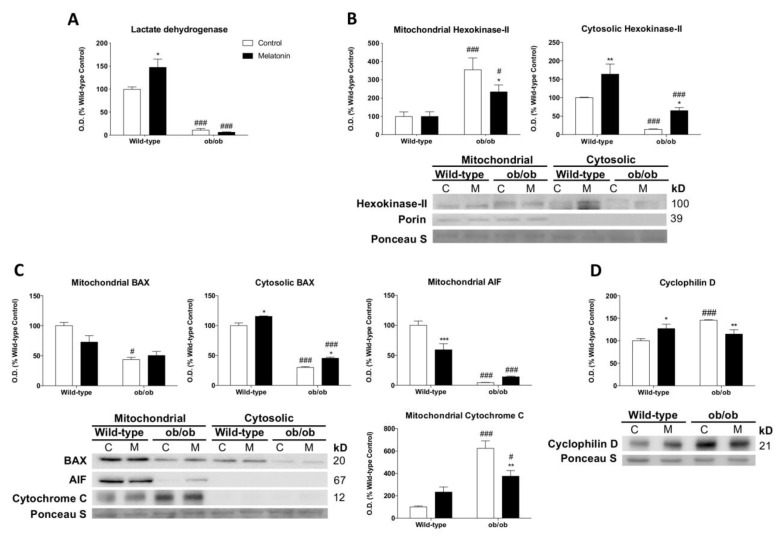
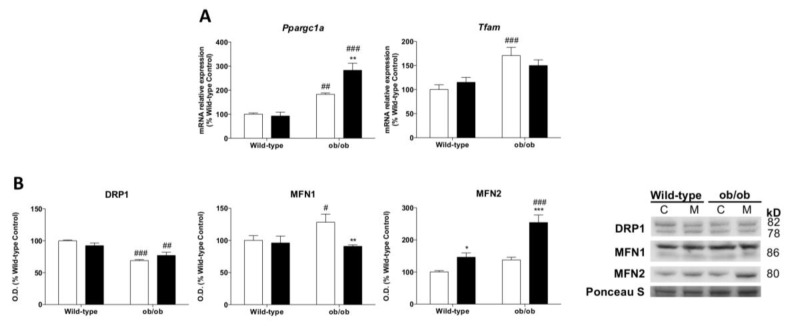
Leptin is critically compromised in the major common forms of obesity. Skeletal muscle is the main effector tissue for energy modification that occurs as a result of the effect of endocrine axes, such as leptin signaling. Our study was carried out using skeletal muscle from a leptin-deficient animal model, in order to ascertain the importance of this hormone and to identify the major skeletal muscle mechanisms affected. We also examined the therapeutic role of melatonin against leptin-induced muscle wasting. Here, we report that leptin deficiency stimulates fatty acid β-oxidation, which results in mitochondrial uncoupling and the suppression of mitochondrial oxidative damage; however, it increases cytosolic oxidative damage. Thus, different nutrient-sensing pathways are disrupted, impairing proteostasis and promoting lipid anabolism, which induces myofiber degeneration and drives oxidative type I fiber conversion. Melatonin treatment plays a significant role in reducing cellular oxidative damage and regulating energy homeostasis and fuel utilization. Melatonin is able to improve both glucose and mitochondrial metabolism and partially restore proteostasis. Taken together, our study demonstrates melatonin to be a decisive mitochondrial function-fate regulator in skeletal muscle, with implications for resembling physiological energy requirements and targeting glycolytic type II fiber recovery.

Keywords: leptin; melatonin; metabolism; mitochondria; obesity; skeletal muscle.


Conflict of interest statement

The authors declare no conflict of interest.

Figures

Figure 1
Figure 1
Melatonin remodels OXPHOS complexes and oxidative phosphorylation in skeletal muscle from ob/ob mice: (A) Protein expression analysis of OXPHOS subunits from each complex (NDUFB8, SDHB, UQCRC2, MTCO1, and ATP5A) and porin. Data are mean of optical density (O.D.) expressed as a percentage of wild-type control mice. Porin and ponceau staining were used as loading control. (B,C) ADP-stimulated O2 consumption (State 3), respiration in the absence of ADP-stimulation (State 4), respiratory control ratio (RCR), and ADP/O were analyzed using glutamate/malate (G/M) and succinate (SUC) as respiration substrates of complexes 1 and 2, respectively. Data are mean ± SD. (D) Basal mitochondrial and cytosolic ATP content. Data are mean ± SD. Histograms show Wild-type and ob/ob mice in white and melatonin-treated mice in black. Statistical comparisons: # wild-type vs. ob/ob; * control vs. melatonin. The main effects of leptin deficiency and melatonin treatment were detected via a two-way ANOVA (n = 6). The number of symbols marks the level of statistical significance: one for p < 0.05, two for p < 0.01, and three for p < 0.001.
Figure 2
Figure 2
Melatonin reduces oxidative stress-induced cytosolic damage and enhances antioxidant defense in skeletal muscle from ob/ob mice: (A) Determination of cytosolic lipid oxidative damage (lipid peroxidation). Data are mean ± SD. (B) Antioxidant system evaluation by determining the activity of antioxidant enzymes (superoxide dismutase, catalase, glutathione peroxidase, and glutathione reductase) in cytosolic fraction. Data are mean ± SD. (C) Determination of mitochondrial lipid oxidative damage (lipid peroxidation). Data are mean ± SD. (D) Antioxidant system evaluation by determining the activity of antioxidant enzymes (superoxide dismutase, catalase, glutathione peroxidase, and glutathione reductase) in the mitochondrial fraction. Data are mean ± SD. Histograms show Wild-type and ob/ob mice in white and melatonin-treated mice in black. Statistical comparisons: # wild-type vs. ob/ob; * control vs. melatonin. The main effects of leptin deficiency and melatonin treatment were detected using a two-way ANOVA (n = 6). The number of symbols marks the level of statistical significance: one for p < 0.05, two for p < 0.01, and three for p < 0.001.
Figure 3
Figure 3
Melatonin regulates mitochondria-bound hexokinase-II and apoptosis response in skeletal muscle from ob/ob mice: (A) Lactate dehydrogenase identification via laser desorption/ionization-time of flight (MALDI-TOF/TOF) mass spectrometry and protein level analysis. Data are mean of optical density (O.D.) ± SD expressed as a percentage of wild-type control mice. (B) Expression of hexokinase-II in mitochondrial and cytosolic fractions. Data are mean of optical density (O.D.) ± SD expressed as a percentage of wild-type control mice. Ponceau staining was used as the loading control. (C) Protein expression analysis of BAX, AIF, and cytochrome c to evaluate apoptosis showed significant changes in cytosolic and isolated mitochondria extracts. Ponceau staining was used as the loading control. (D) Cyclophilin D protein content showed significant changes in mPTP stabilization. Data are expressed in optical density (O.D.) as a percentage of wild-type control mice. Ponceau staining was used as the loading control. Histograms show Wild-type and ob/ob mice in white and melatonin-treated mice in black. Statistical comparisons: # wild-type vs. ob/ob; * control vs. melatonin. The main effects of leptin deficiency and melatonin treatment were detected using a two-way ANOVA (n = 6). The number of symbols marks the level of statistical significance: one for p < 0.05, two for p < 0.01, and three for p < 0.001.
Figure 4
Figure 4
Melatonin modulates mitochondrial biogenesis and mitochondrial dynamics in skeletal muscle from ob/ob mice: (A) Relative mRNA expression of mitochondrial biogenesis genes (Tfam and Ppargc1a). Data are mean of mRNA relative expression ± SD expressed as a percentage of wild-type control mice. (B) Protein expression analysis of mitochondrial remodeling markers (DRP1, MFN1, and MFN2). Data are mean of optical density (O.D.) ± SD expressed as a percentage of wild-type control mice. Ponceau staining was used as the loading control. Histograms show Wild-type and ob/ob mice in white and melatonin-treated mice in black. Statistical comparisons: # wild-type vs. ob/ob; * control vs. melatonin. The main effects of leptin deficiency and melatonin treatment were detected using a two-way ANOVA (n = 8). The number of symbols marks the level of statistical significance: one for p < 0.05, two for p < 0.01, and three for p < 0.001.
Figure 5
Figure 5
Melatonin regulates unfolded protein response (UPR) in skeletal muscle from ob/ob mice: (A) Protein and relative mRNA expression of markers involved in the UPR branch activated by IRE1α and the specific splicing of Xbp1 (IRE1α, Xbp1, and XBP1s). Data are mean of optical density (O.D.) or mRNA relative expression ± SD expressed as a percentage of wild-type control mice. Ponceau staining was used as the loading control. (B) The UPR signaling branch activated via a specific proteolytic cleavage of ATF6α was analyzed. Data are mean of optical density (O.D.) ± SD expressed as a percentage of wild-type control mice. Ponceau staining was used as the loading control. (C,D) UPR signaling markers from the branch activated by eIF2α phosphorylation (eIF2α, p-eIF2α, and CHOP) were analyzed. Data are mean of optical density (O.D.) ± SD expressed as a percentage of wild-type control mice. Ponceau staining was used as the loading control. Histograms show Wild-type and ob/ob mice in white and melatonin-treated mice in black. Statistical comparisons: # wild-type vs. ob/ob; * control vs. melatonin. The main effects of leptin deficiency and melatonin treatment were detected using a two-way ANOVA (n = 8). The number of symbols marks the level of statistical significance: one for p < 0.05, two for p < 0.01, and three for p < 0.001.
Figure 6
Figure 6
Melatonin partially restores proteostasis through autophagy regulation in skeletal muscle from ob/ob mice: (A) PI3K, p-AKT, and p-mTOR protein content show significant changes between genotype remodeling protein synthesis and autophagy responses. Data are mean of optical density (O.D.) ± SD expressed as a percentage of wild-type control mice. Ponceau staining was used as the loading control. (B) Protein expression analysis of markers downstream of protein biosynthesis pathway (p70S6K and p-p70S6K). Data are mean of optical density (O.D.) ± SD expressed as a percentage of wild-type control mice. Ponceau staining was used as the loading control. (C) Protein levels of autophagy mechanism (Beclin-1, LC3-I, LC3-II, and p62). Data are mean of optical density (O.D.) ± SD expressed as a percentage of wild-type control mice. Ponceau staining was used as the loading control. (D) Relative mRNA expression of Lamp2a implicated in chaperone-mediated autophagy analysis to evaluate protein removal upon mild oxidative stress. Data are mean ± SD expressed as a percentage of wild-type control mice. Histograms show Wild-type and ob/ob mice in white and melatonin-treated mice in black. Statistical comparisons: # wild-type vs. ob/ob; * control vs. melatonin. The main effects of leptin deficiency and melatonin treatment were detected via a two-way ANOVA (n = 8). The number of symbols marks the level of statistical significance: one for p < 0.05, two for p < 0.01, and three for p < 0.001.
Figure 7
Figure 7
Melatonin restores fiber-type proportion and improves muscle excitation–contraction coupling in skeletal muscle from ob/ob mice: (A) Light microscopy images of periodic acid–Schiff (PAS)-stained sections from skeletal muscle tissue and the determination of the proportion of darker-stained type II fibers. The boxes represent the area of the images shown at higher magnification. Scale bars: 100 μm. Protein expression of MURF1 is related to an increased proportion of type II fibers. Data from protein expression analysis are mean of optical density (O.D.) ± SD expressed as a percentage of wild-type control mice. Ponceau staining was used as the loading control. (B) Relative mRNA and protein expression of markers involved in the skeletal muscle excitation–contraction pathway (Ryr1, p-RYR1, Calstabin1, Atp2a1, CaMKII, and p-CaMKII). Data are mean of mRNA relative expression or optical density (O.D.) ± SD expressed as a percentage of wild-type control mice. Ponceau staining was used as the loading control. Histograms show Wild-type and ob/ob mice in white and melatonin-treated mice in black. Statistical comparisons: # wild-type vs. ob/ob; * control vs. melatonin. The main effects of leptin deficiency and melatonin treatment were detected using a two-way ANOVA (n = 8). The number of symbols marks the level of statistical significance: one for p < 0.05, two for p < 0.01, and three for p < 0.001.

Similar articles

Cited by

References

    1. Tataranni P.A., Ravussin E. Variability in metabolic rate: Biological sites of regulation. Int. J. Obes. Relat. Metab. Disord. 1995;19((Suppl. S4)):S102–S106. - PubMed
    1. Ceddia R.B. Direct metabolic regulation in skeletal muscle and fat tissue by leptin: Implications for glucose and fatty acids homeostasis. Int. J. Obes. 2005;29:1175–1183. doi: 10.1038/sj.ijo.0803025. - DOI - PubMed
    1. Shiuchi T., Toda C., Okamoto S., Coutinho E.A., Saito K., Miura S., Ezaki O., Minokoshi Y. Induction of glucose uptake in skeletal muscle by central leptin is mediated by muscle beta2-adrenergic receptor but not by AMPK. Sci. Rep. 2017;7:15141. doi: 10.1038/s41598-017-15548-6. - DOI - PMC - PubMed
    1. Sinha I., Sakthivel D., Varon D.E. Systemic Regulators of Skeletal Muscle Regeneration in Obesity. Front. Endocrinol. 2017;8:29. doi: 10.3389/fendo.2017.00029. - DOI - PMC - PubMed
    1. Woo M., Isganaitis E., Cerletti M., Fitzpatrick C., Wagers A.J., Jimenez-Chillaron J., Patti M.E. Early life nutrition modulates muscle stem cell number: Implications for muscle mass and repair. Stem Cells Dev. 2011;20:1763–1769. doi: 10.1089/scd.2010.0349. - DOI - PMC - PubMed

LinkOut - more resources