

Influence of Mild Chronic Stress and Social Isolation on Acute Ozone-Induced Alterations in Stress Biomarkers and Brain-Region-Specific Gene Expression in Male Wistar-Kyoto Rats
- PMID: 38001817
- PMCID: PMC10669107
- DOI: 10.3390/antiox12111964
Influence of Mild Chronic Stress and Social Isolation on Acute Ozone-Induced Alterations in Stress Biomarkers and Brain-Region-Specific Gene Expression in Male Wistar-Kyoto Rats
Abstract
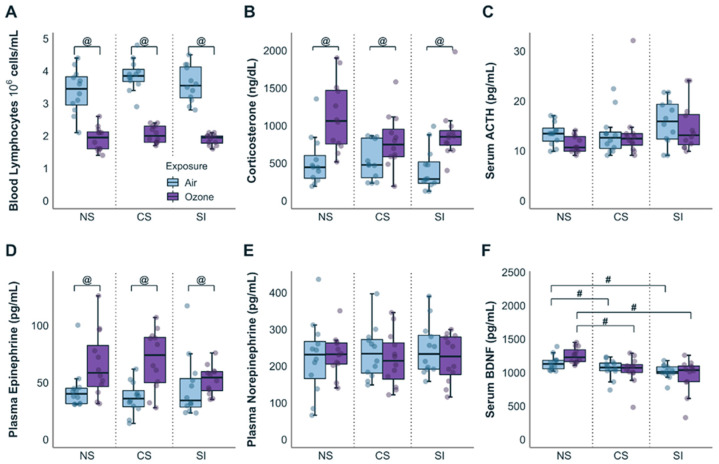
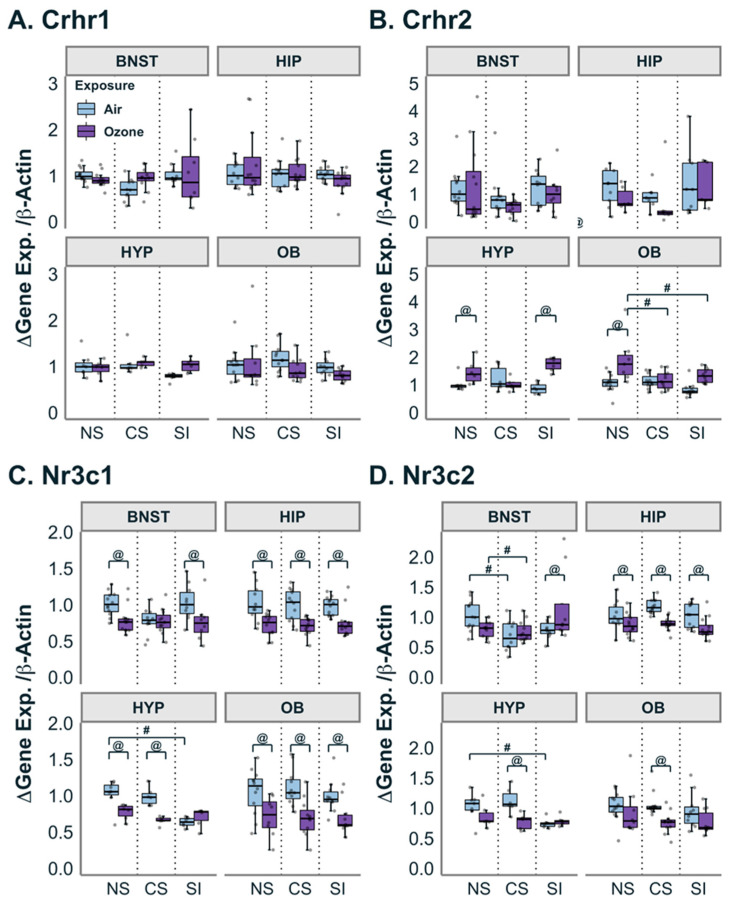
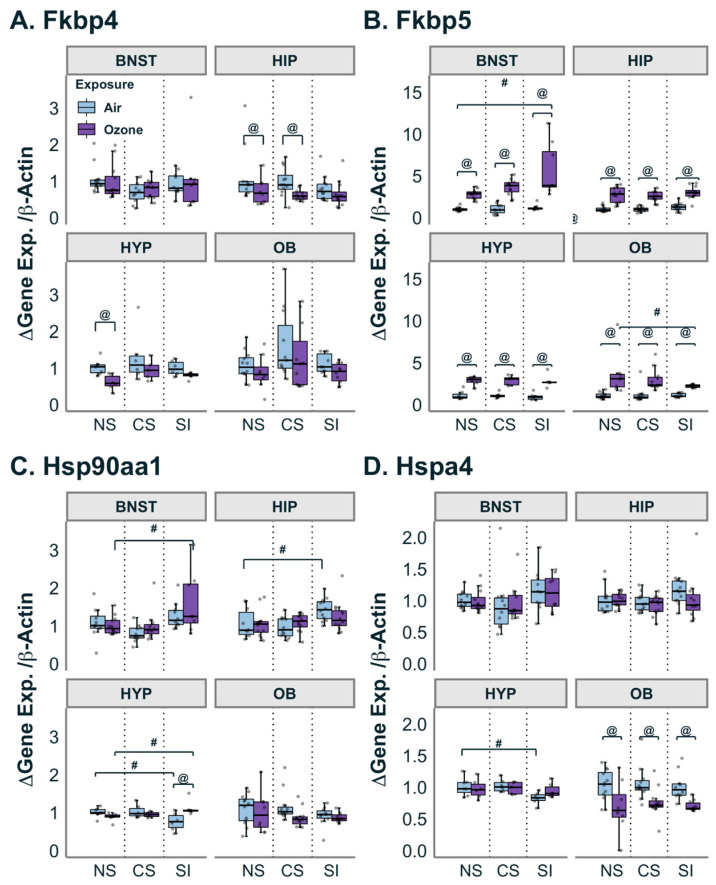
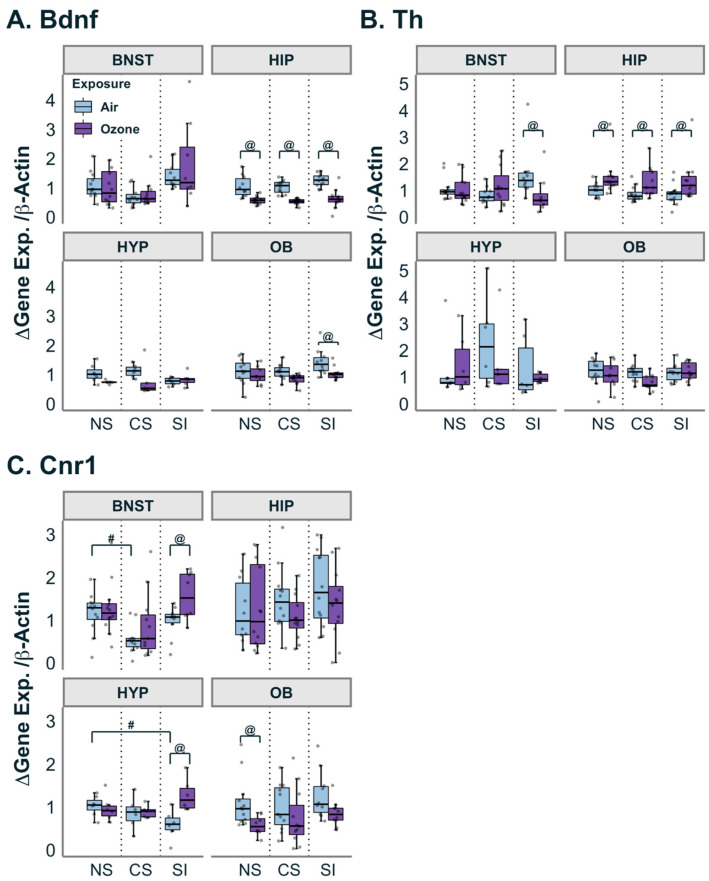
Individuals with psychosocial stress often experience an exaggerated response to air pollutants. Ozone (O3) exposure has been associated with the activation of the neuroendocrine stress-response system. We hypothesized that preexistent mild chronic stress plus social isolation (CS), or social isolation (SI) alone, would exacerbate the acute effects of O3 exposure on the circulating adrenal-derived stress hormones, and the expression of the genes regulating glucocorticoid stress signaling via an altered stress adaptation in a brain-region-specific manner. Male Wistar-Kyoto rats (5 weeks old) were socially isolated, plus were subjected to either CS (noise, confinement, fear, uncomfortable living, hectic activity, and single housing), SI (single housing only, restricted handling and no enrichment) or no stress (NS; double housing, frequent handling and enrichment provided) for 8 weeks. The rats were then exposed to either air or O3 (0.8 ppm for 4 h), and the samples were collected immediately after. The indicators of sympathetic and hypothalamic-pituitary axis (HPA) activation (i.e., epinephrine, corticosterone, and lymphopenia) increased with O3 exposure, but there were no effects from CS or SI, except for the depletion of serum BDNF. CS and SI revealed small changes in brain-region-specific glucocorticoid-signaling-associated markers of gene expression in the air-exposed rats (hypothalamic Nr3c1, Nr3c2 Hsp90aa1, Hspa4 and Cnr1 inhibition in SI; hippocampal HSP90aa1 increase in SI; and inhibition of the bed nucleus of the stria terminalis (BNST) Cnr1 in CS). Gene expression across all brain regions was altered by O3, reflective of glucocorticoid signaling effects, such as Fkbp5 in NS, CS and SI. The SI effects on Fkbp5 were greatest for SI in BNST. O3 increased Cnr2 expression in the hypothalamus and olfactory bulbs of the NS and SI groups. O3, in all stress conditions, generally inhibited the expression of Nr3c1 in all brain regions, Nr3c2 in the hippocampus and hypothalamus and Bdnf in the hippocampus. SI, in general, showed slightly greater O3-induced changes when compared to NS and CS. Serum metabolomics revealed increased sphingomyelins in the air-exposed SI and O3-exposed NS, with underlying SI dampening some of the O3-induced changes. These results suggest a potential link between preexistent SI and acute O3-induced increases in the circulating adrenal-derived stress hormones and brain-region-specific gene expression changes in glucocorticoid signaling, which may partly underlie the stress dynamic in those with long-term SI.
Keywords: Fkbp5; bed nucleus of the stria terminalis; chronic stress; gene expression; glucocorticoids; hippocampus; hypothalamus; metabolomics; neuroendocrine; olfactory bulbs; ozone; social isolation.
Conflict of interest statement
No conflict of interest, financial or otherwise, are declared by the authors.
Figures
Similar articles
-
Acute Ozone-Induced Transcriptional Changes in Markers of Oxidative Stress and Glucocorticoid Signaling in the Rat Hippocampus and Hypothalamus Are Sex-Specific.Int J Mol Sci. 2023 Mar 29;24(7):6404. doi: 10.3390/ijms24076404. Int J Mol Sci. 2023. PMID: 37047376 Free PMC article.
-
Social isolation exacerbates acute ozone inhalation induced pulmonary and systemic health outcomes.Toxicol Appl Pharmacol. 2022 Dec 15;457:116295. doi: 10.1016/j.taap.2022.116295. Epub 2022 Oct 29. Toxicol Appl Pharmacol. 2022. PMID: 36341779 Free PMC article.
-
Adrenal Stress Hormone Regulation of Hepatic Homeostatic Function After an Acute Ozone Exposure in Wistar-Kyoto Male Rats.Toxicol Sci. 2022 Aug 25;189(1):73-90. doi: 10.1093/toxsci/kfac065. Toxicol Sci. 2022. PMID: 35737395 Free PMC article.
-
Stress-induced norepinephrine release in the hypothalamic paraventricular nucleus and pituitary-adrenocortical and sympathoadrenal activity: in vivo microdialysis studies.Front Neuroendocrinol. 1995 Apr;16(2):89-150. doi: 10.1006/frne.1995.1004. Front Neuroendocrinol. 1995. PMID: 7621982 Review.
-
The stress system in the human brain in depression and neurodegeneration.Ageing Res Rev. 2005 May;4(2):141-94. doi: 10.1016/j.arr.2005.03.003. Ageing Res Rev. 2005. PMID: 15996533 Review.
Cited by
-
Mechanistic insights regarding neuropsychiatric and neuropathologic impacts of air pollution.Crit Rev Toxicol. 2024 Nov;54(10):953-980. doi: 10.1080/10408444.2024.2420972. Epub 2024 Dec 10. Crit Rev Toxicol. 2024. PMID: 39655487 Review.
-
Effects of social isolation on locus coeruleus opioid receptor expression and affective behavior.Neurobiol Stress. 2025 Mar 14;36:100717. doi: 10.1016/j.ynstr.2025.100717. eCollection 2025 May. Neurobiol Stress. 2025. PMID: 40206287 Free PMC article.
-
Inhibition of sympathetic tone via hypothalamic descending pathway propagates glucocorticoid-induced endothelial impairment and osteonecrosis of the femoral head.Bone Res. 2024 Nov 8;12(1):64. doi: 10.1038/s41413-024-00371-3. Bone Res. 2024. PMID: 39516484 Free PMC article.
References
-
- Younan D., Wang X., Casanova R., Barnard R., Gaussoin S.A., Saldana S., Petkus A.J., Beavers D.P., Resnick S.M., Manson J.E., et al. PM2.5 associated with gray matter atrophy reflecting increased Alzheimers risk in older women. Neurology. 2020;96:e1190–e1201. doi: 10.1212/WNL.0000000000011149. - DOI - PMC - PubMed
-
- Nunez Y., Boehme A.K., Li M., Goldsmith J., Weisskopf M.G., Re D.B., Navas-Acien A., van Donkelaar A., Martin R.V., Kioumourtzoglou M.A. Parkinson’s disease aggravation in association with fine particle components in New York State. Environ. Res. 2021;201:111554. doi: 10.1016/j.envres.2021.111554. - DOI - PMC - PubMed
-
- Shi L., Steenland K., Li H., Liu P., Zhang Y., Lyles R.H., Requia W.J., Ilango S.D., Chang H.H., Wingo T., et al. A national cohort study (2000–2018) of long-term air pollution exposure and incident dementia in older adults in the United States. Nat. Commun. 2021;12:6754. doi: 10.1038/s41467-021-27049-2. - DOI - PMC - PubMed
LinkOut - more resources
Full Text Sources
Miscellaneous
