. 2023 Nov 14;12(11):2001.
doi: 10.3390/antiox12112001.

Azadirachtin Attenuates Carcinogen Benzo(a) Pyrene-Induced DNA Damage, Cell Cycle Arrest, Apoptosis, Inflammatory, Metabolic, and Oxidative Stress in HepG2 Cells

Affiliations

Azadirachtin Attenuates Carcinogen Benzo(a) Pyrene-Induced DNA Damage, Cell Cycle Arrest, Apoptosis, Inflammatory, Metabolic, and Oxidative Stress in HepG2 Cells

Annie John et al. Antioxidants (Basel). .

Abstract

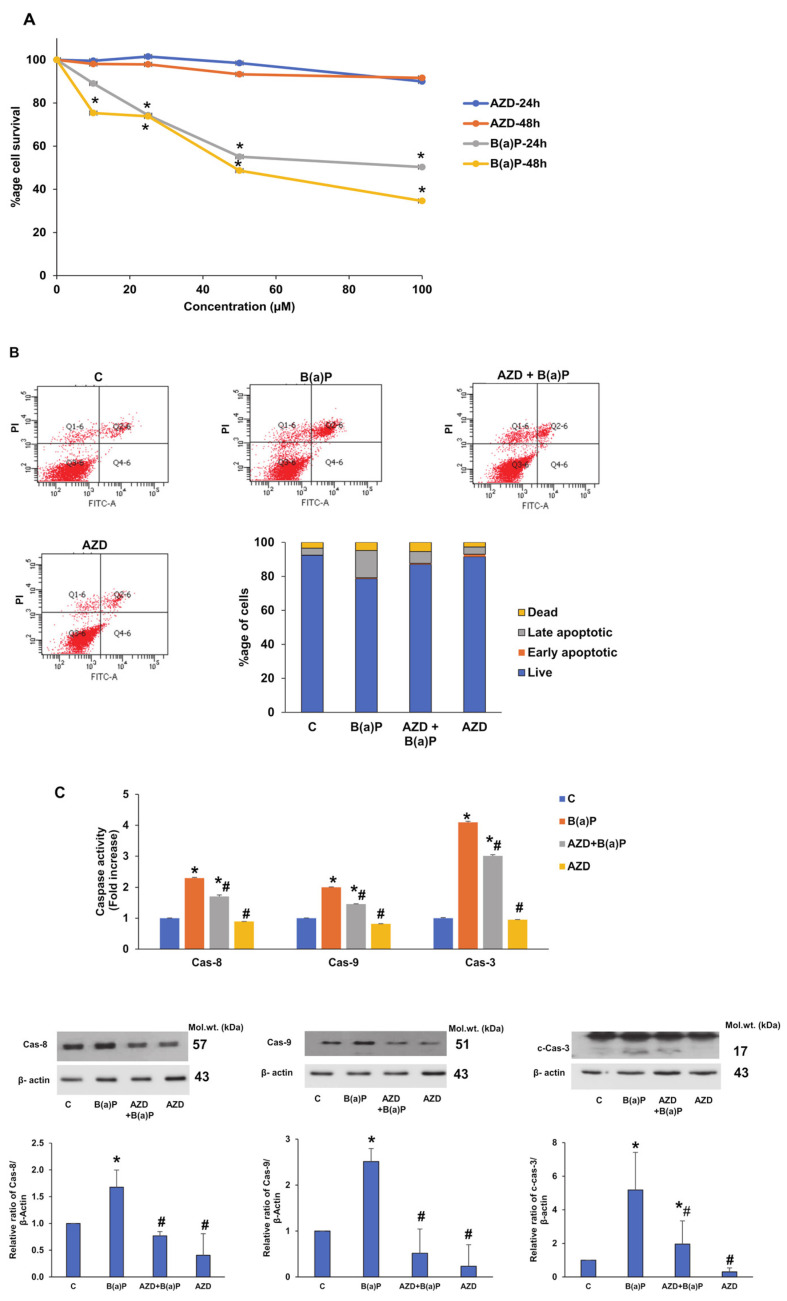
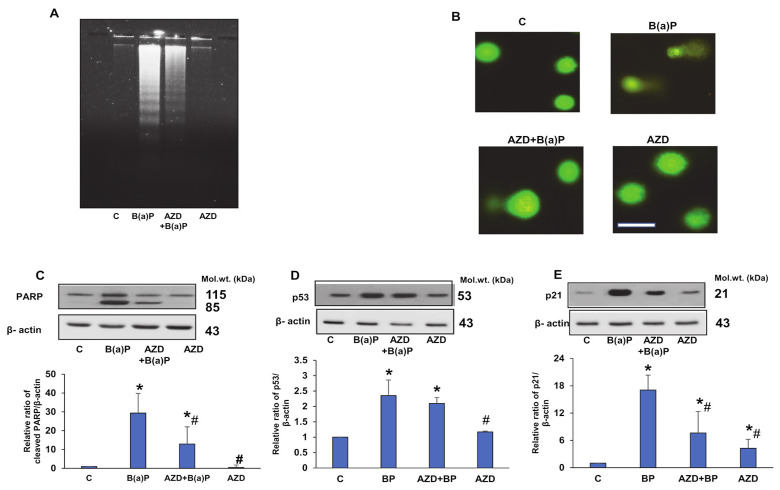
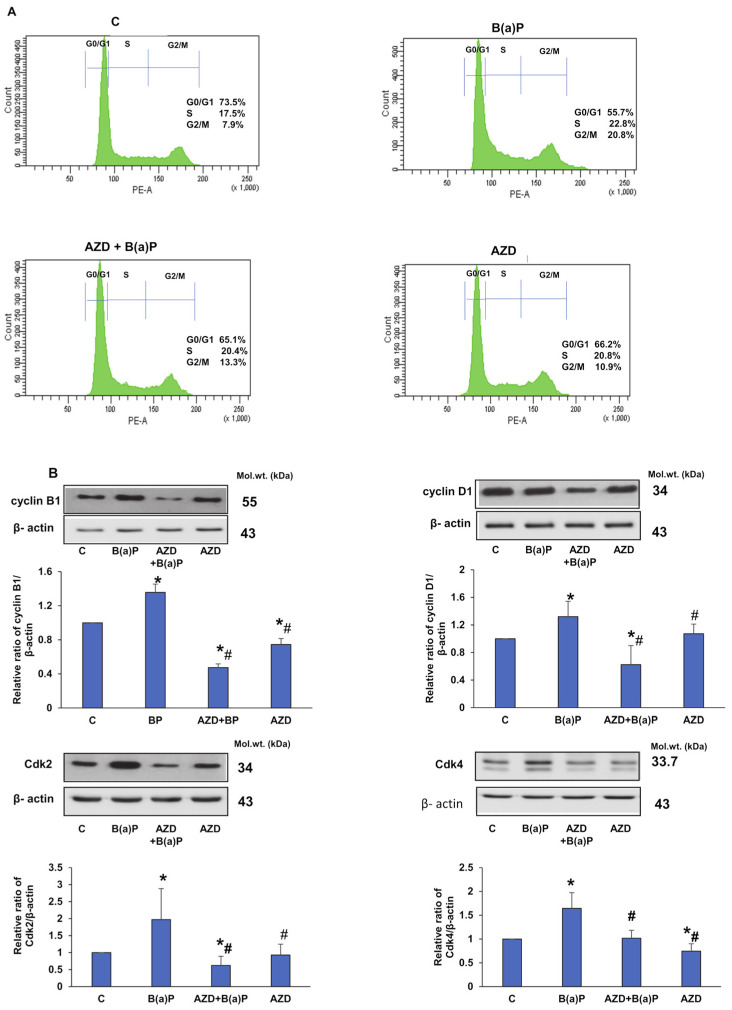
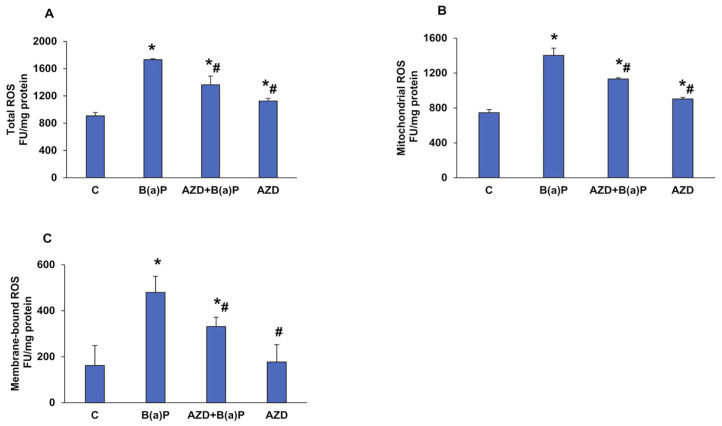
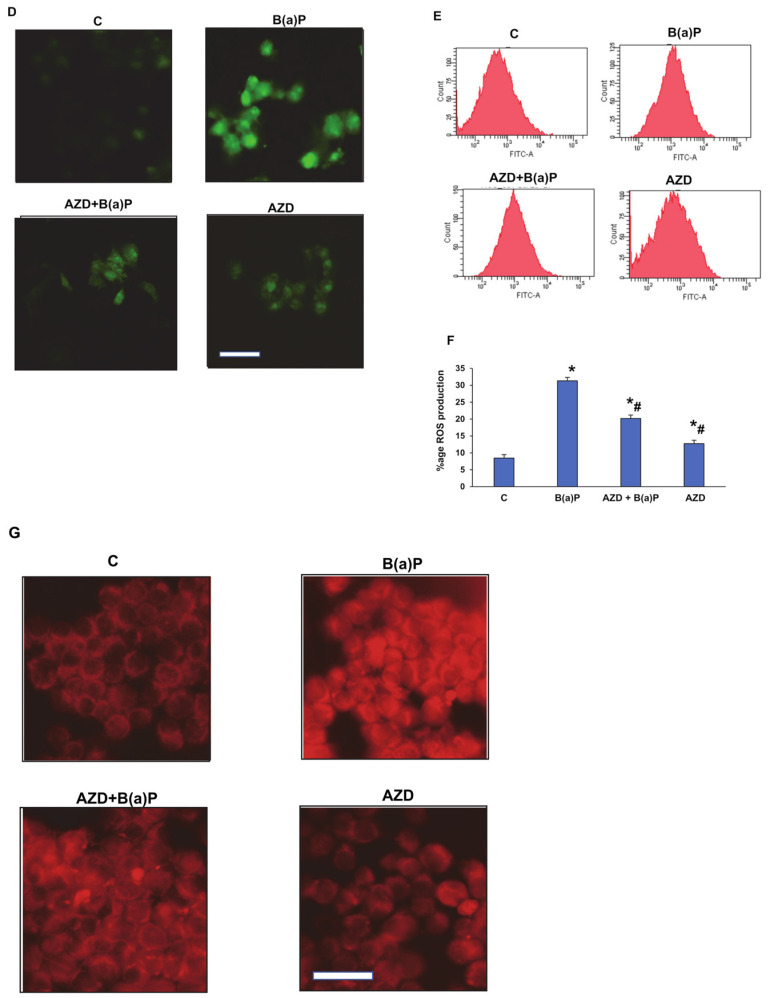
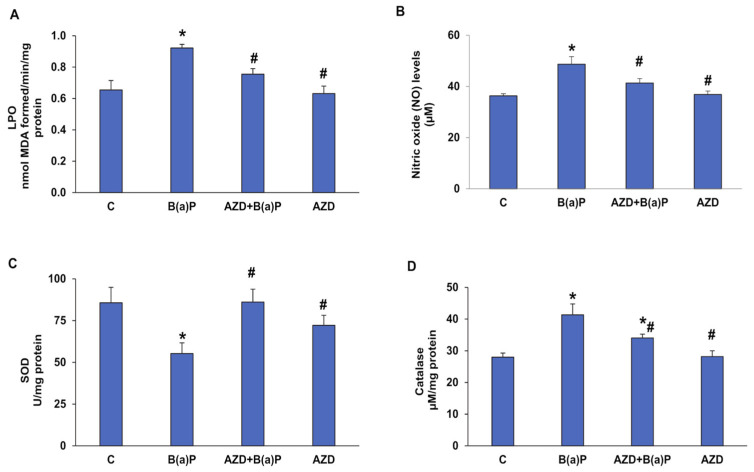
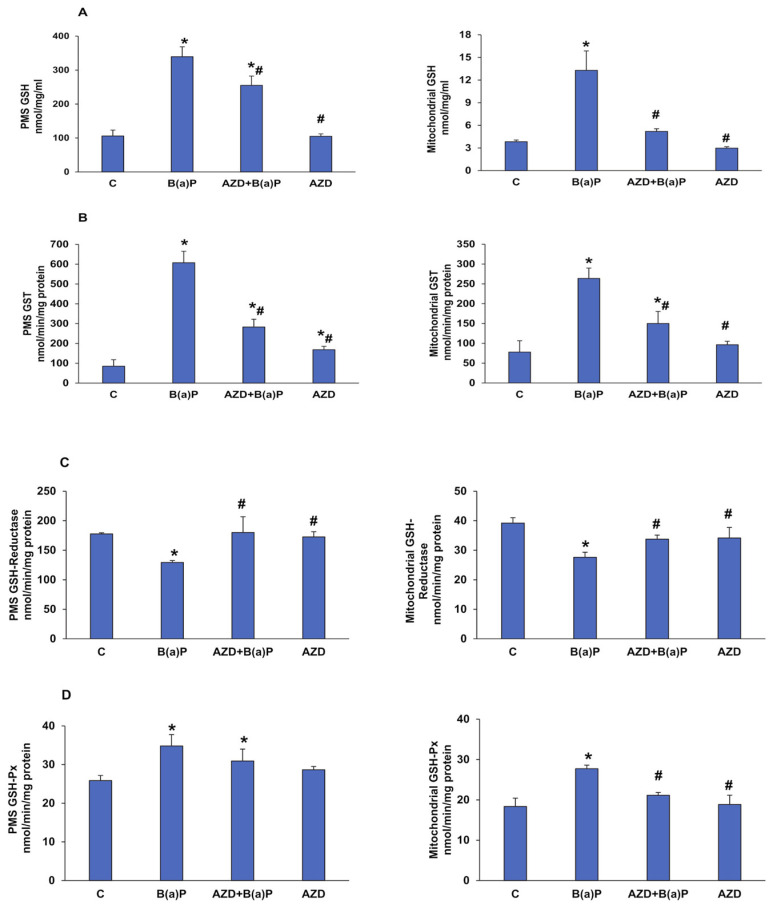
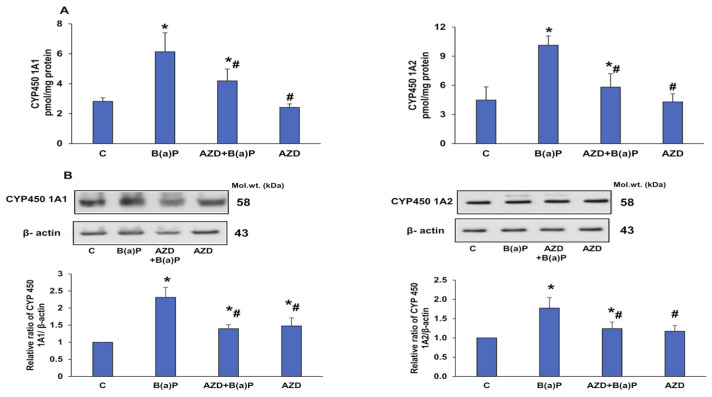
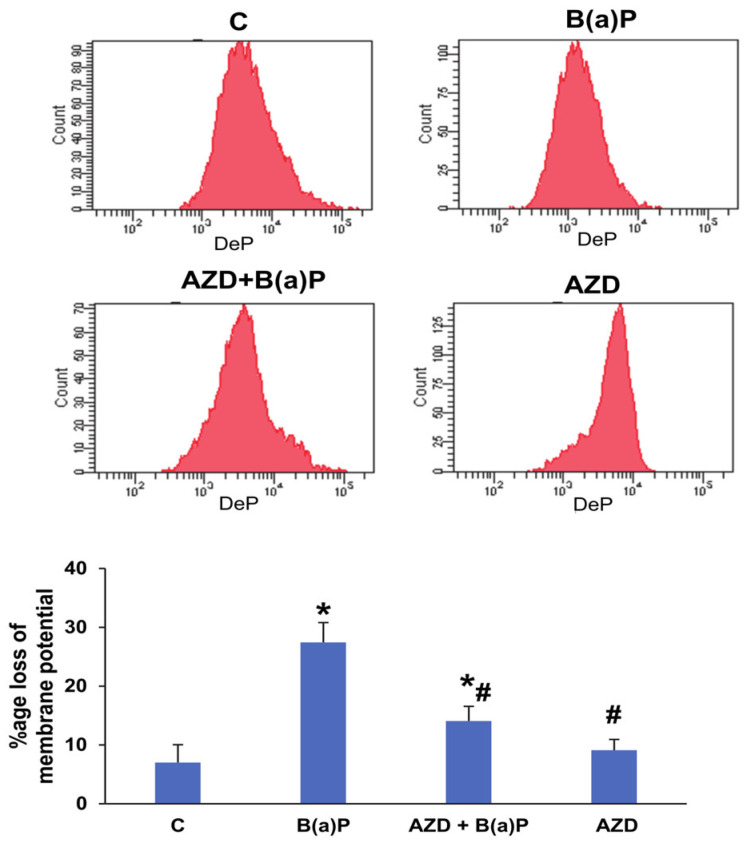
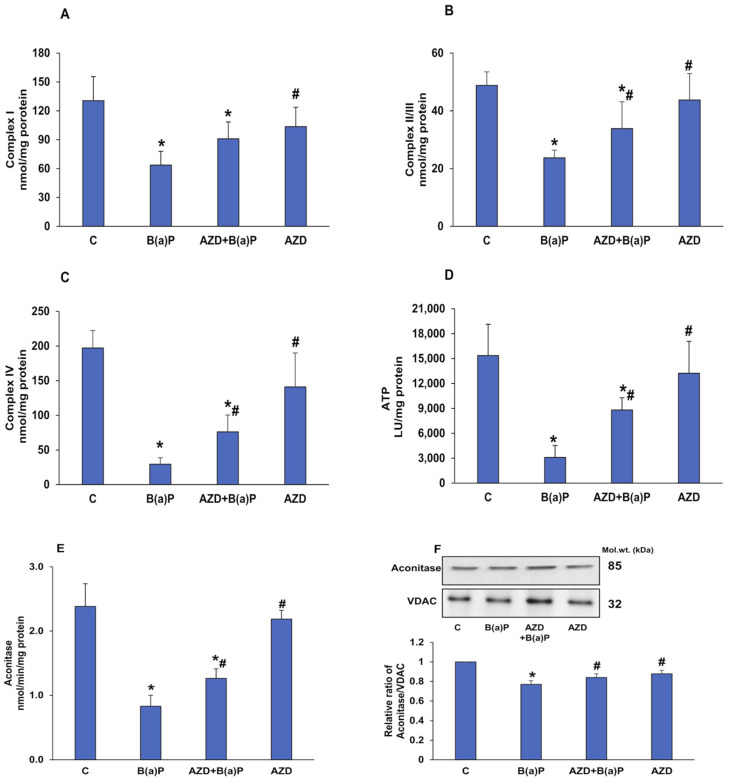
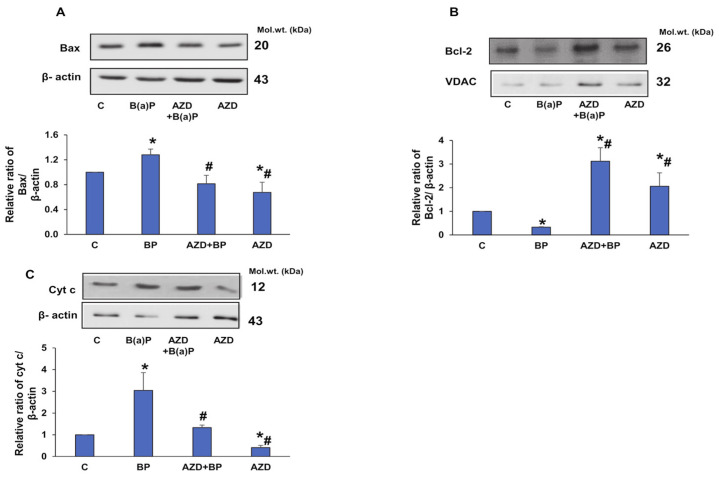
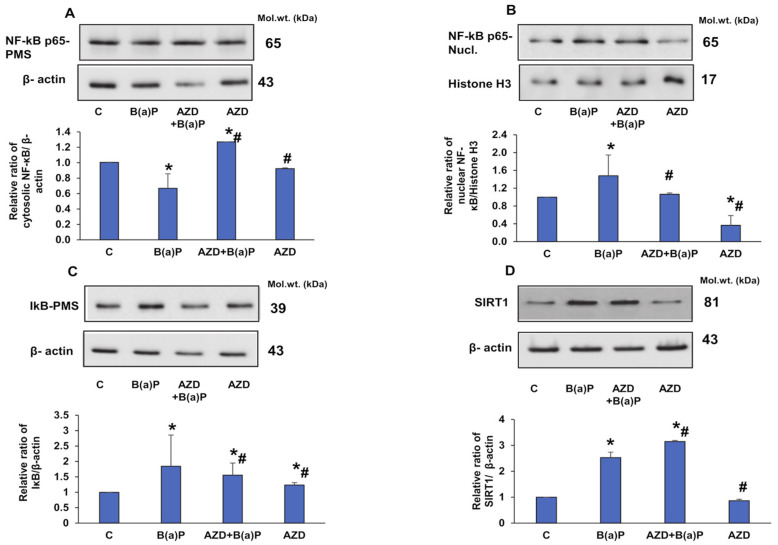
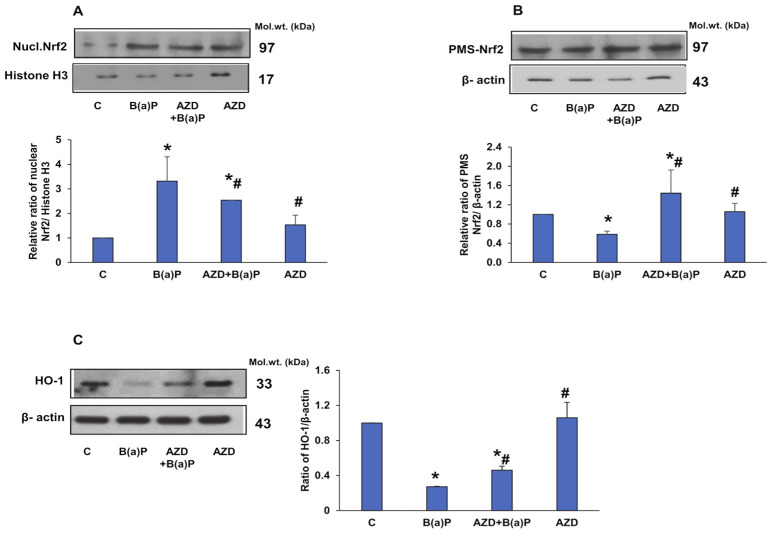
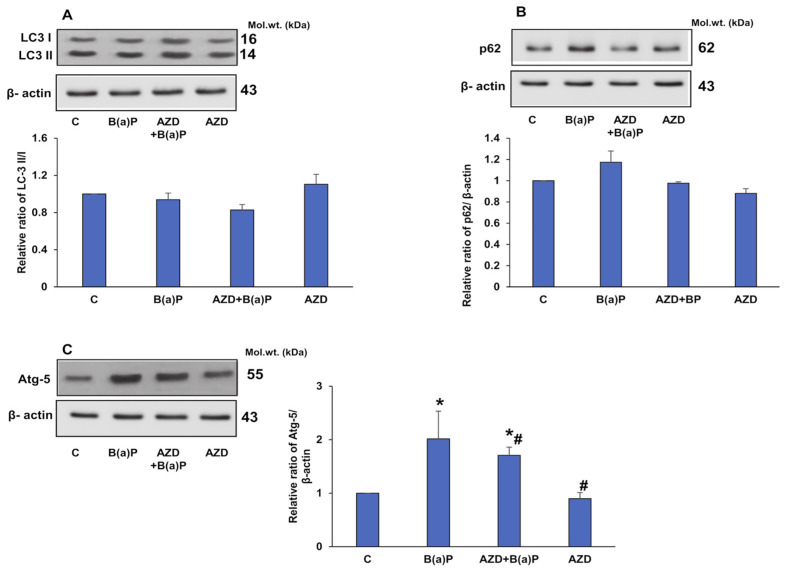
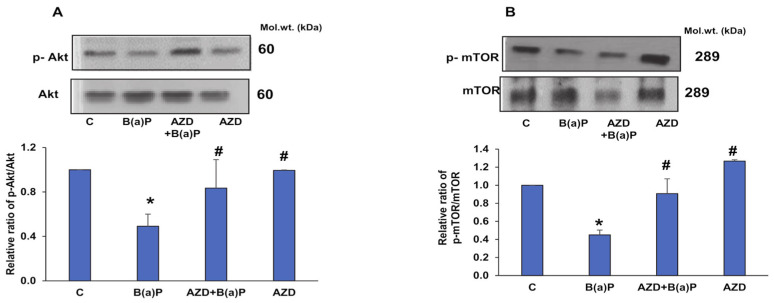
Azadirachtin (AZD), a limonoid from the versatile, tropical neem tree (Azadirachta indica), is well known for its many medicinal, and pharmacological effects. Its effects as an anti-oxidant, anti-inflammatory, and anti-cancer agent are well known. However, not many studies have explored the effects of AZD on toxicities induced by benzo(a)pyrene (B(a)P), a toxic component of cigarette smoke known to cause DNA damage and cell cycle arrest, leading to different kinds of cancer. In the present study, using HepG2 cells, we investigated the protective effects of Azadirachtin (AZD) against B(a)P-induced oxidative/nitrosative and metabolic stress and mitochondrial dysfunction. Treatment with 25 µM B(a)P for 24 h demonstrated an increased production of reactive oxygen species (ROS), followed by increased lipid peroxidation and DNA damage presumably, due to the increased metabolic activation of B(a)P by CYP 450 1A1/1A2 enzymes. We also observed intrinsic and extrinsic apoptosis, alterations in glutathione-dependent redox homeostasis, cell cycle arrest, and inflammation after B(a)P treatment. Cells treated with 25 µM AZD for 24 h showed decreased oxidative stress and apoptosis, partial protection from DNA damage, and an improvement in mitochondrial functions and bioenergetics. The improvement in antioxidant status, anti-inflammatory potential, and alterations in cell cycle regulatory markers qualify AZD as a potential therapeutic in combination with anti-cancer drugs.

Keywords: Azadirachtin; DNA damage; HepG2 cells; apoptosis; benzo(a)pyrene; mitochondrial dysfunction; oxidative stress.


Conflict of interest statement

The authors declare no conflict of interest. The funders had no role in the design of the study; in the collection, analyses, or interpretation of data; in the writing of the manuscript; or in the decision to publish the results.

Figures

Figure 1
Figure 1
B(a)P-induced effects on cell survival and apoptosis, and protection by AZD in HepG2 cells. After the treatment of HepG2 cells with different doses of B(a)P or AZD (10 µM to 100 µM) for 24 h and 48 h, cell survival was evaluated using the MTT assay (A). HepG2 cells treated with 25 µM B(a)P for 24 h and/or 25 µM AZD for 24 h, and apoptosis measured via flow cytometry (B). A typical flow cytometric dot plot showing the quantitation of cells in each of the quadrants from three replicated experiments, and the average percentage values plotted as a stacked histogram. The chromophore released by the activities of caspases, mainly caspases-3, -8, and -9, were measured colorimetrically in cells treated with 25 µM B(a)P and/or 25 µM AZD for 24 h, using their respective substrates at 405 nm (C). The expression of the caspase enzymes was confirmed via immunoblotting. Values indicate the mean ± SD of three replicate experiments. Asterisks represent significant differences and are fixed at p ≤ 0.05 (* represents significant differences with respect to control cells whereas # represents significant differences with respect to B(a)P-treated cells). Molecular weights are represented in kDa.
Figure 2
Figure 2
DNA breakdown and activation of DNA repair enzymes caused by B(a)P in HepG2 cells. To asses for DNA damage in HepG2 cells treated with 25 µM B(a)P and/or 25 µM AZD for 24 h, DNA samples were run on 2% agarose gels and stained with ethidium bromide (A). DNA injury was also visualized using the single-cell gel electrophoresis assay in accordance with the manufacturer’s recommendation (B). Scale bar indicates 50 µm. Comet tails indicate cells showing damaged DNA. Representative results from control and B(a)P alone and/or AZD from three replicate experiments are shown. Expression of the DNA repair enzymes PARP (C), p53 (D), and its downstream protein, p21 (E) were checked via immunoblotting. β-actin was used as the loading control. Values indicate the mean ± SD of three replicate experiments. Asterisks represent significant differences and are fixed at p ≤ 0.05 (* represents significant differences with respect to control cells whereas # represents significant differences with respect to B(a)P-treated cells). Molecular weights are represented in kDa.
Figure 3
Figure 3
B(a)P-induced perturbations in the cell cycle and its regulatory markers in HepG2 cells treated with B(a)P and/or AZD. To assess cell cycle distribution, cells were stained with propidium iodide and the fluorescence was quantitated using FACSCanto II Flow Cytometer at an excitation wavelength of 488 nm with detection at 620 nm. DNA distribution in each phase from three replicate experiments was quantitated. A typical histogram showing the % of DNA distribution in the individual phases is shown in (A). The expression of the cell cycle regulatory markers, cyclins B1 and D1, and Cdks 2 and 4 is shown in (B). β-actin was used as the loading control. Blots were densitometrically quantitated and are represented as the mean ± SD of three replicate experiments. Asterisks represent significant differences and are fixed at p ≤ 0.05 (* represents significant differences with respect to control cells whereas # represents significant differences with respect to B(a)P-treated cells). Molecular weights are represented in kDa.
Figure 4
Figure 4
B(a)-induced ROS production in HepG2 cells. Intracellular production of ROS in the different sub-cellular fractions was measured using DCFDA, a cell-permeable fluorescent probe, in Hep G2 cells treated with B(a)P and/or AZD for 24 h using the ELISA reader (TECAN Infinite M 200 PRO, Austria). Total ROS production (A), membrane-bound ROS (B), and mitochondrial ROS (C) as measured. Cells grown on coverslips treated and incubated with DCFDA as above and the fluorescence was measured microscopically (D). The fluorescence caused by ROS production measured via flow cytometry (E). The % of ROS production calculated and shown as a histogram (F). The production of mitochondrial ROS, confirmed using a mitochondrial ROS-specific dye, CM-H2XRos (reduced Mito Tracker® Red), and visualized using the Olympus fluorescence microscope (G). The scale bar in (D,G) represents 50 µm. Values are represented as the mean ± SD of three replicate experiments. Asterisks represent significant differences and are fixed at p ≤ 0.05 (* represents significant differences with respect to control cells whereas # represents significant differences with respect to B(a)P-treated cells).
Figure 4
Figure 4
B(a)-induced ROS production in HepG2 cells. Intracellular production of ROS in the different sub-cellular fractions was measured using DCFDA, a cell-permeable fluorescent probe, in Hep G2 cells treated with B(a)P and/or AZD for 24 h using the ELISA reader (TECAN Infinite M 200 PRO, Austria). Total ROS production (A), membrane-bound ROS (B), and mitochondrial ROS (C) as measured. Cells grown on coverslips treated and incubated with DCFDA as above and the fluorescence was measured microscopically (D). The fluorescence caused by ROS production measured via flow cytometry (E). The % of ROS production calculated and shown as a histogram (F). The production of mitochondrial ROS, confirmed using a mitochondrial ROS-specific dye, CM-H2XRos (reduced Mito Tracker® Red), and visualized using the Olympus fluorescence microscope (G). The scale bar in (D,G) represents 50 µm. Values are represented as the mean ± SD of three replicate experiments. Asterisks represent significant differences and are fixed at p ≤ 0.05 (* represents significant differences with respect to control cells whereas # represents significant differences with respect to B(a)P-treated cells).
Figure 5
Figure 5
B(a)-induced oxidative stress in HepG2 cells. NADPH-dependent lipid peroxidation in HepG2 cells treated with B(a)P and/or AZD, measured as total malonedialdehyde produced (A). The total nitrite in the culture supernatants was determined using Griess reagent as a measure of NO levels (B). SOD activity determined via the reduction of NBT (nitroblue tetrazolium) to NBT-formazan per the vendor’s instructions (C) and catalase activity as a measure of the formaldehyde formed (D). Values are represented as mean ± SD of three replicate experiments. Asterisks represent significant differences and are fixed at p ≤ 0.05 (* represent significant differences with respect to control cells whereas # represent significant differences with respect to B(a)P-treated cells).
Figure 6
Figure 6
Alterations in redox homeostasis in the sub-cellular fractions of B(a)P- and/or AZD- treated HepG2 cells. Total glutathione (GSH) levels measured in the mitochondrial and post-mitochondrial fractions of the control and B(a)P and/or AZD-treated cells as a measure of the conversion of oxidized glutathione into reduced glutathione using DTNB (5,5′-dithiobis (2-nitrobenzoic acid) as a substrate (A). CDNB, GSSG/NADPH, and cumene hydroperoxide used as substrates to measure the activities of glutathione S-transferase (GST) (B), glutathione reductase (GSH-reductase) (C). and glutathione peroxidase (GSH-Px) (D), respectively, in the mitochondrial and post-mitochondrial fractions of the control and B(a)P- and/or AZD-treated cells. Values are represented as the mean ± SD of three replicate experiments. Asterisks represent significant differences and are fixed at p ≤ 0.05 (* represents significant differences with respect to control cells whereas # represents significant differences with respect to B(a)P-treated cells).
Figure 7
Figure 7
Effects of B(a)P and/or AZD on CYP 450 activities in HepG2 cells. CYP 450 1A1 and 1A2 activities measured in the post-mitochondrial fractions from control and B(a)P and/or AZD-treated cells using 7-ethoxyresorufin and methoxy resorufin as substrates, respectively (A). The protein expression of CYP 450 1A1 and 1A2 (B). β-actin was used as the loading control. Activity measurement histograms and a quantitation of the blots are represented as the mean ± SD of three replicate experiments. Asterisks represent significant differences and are fixed at p ≤ 0.05 (* represents significant differences with respect to control cells whereas # represents significant differences with respect to B(a)P-treated cells). Molecular weights are expressed in kDa.
Figure 8
Figure 8
B(a)P-induced alterations in mitochondrial membrane potential (MMP) in HepG2 cells. MMP was measured in HepG2 cells after treatment with B(a)P and/or AZD via flow cytometry using DePsipher TM (R & D Systems, Minneapolis, MN, USA), a fluorescent cationic dye. The bar diagram shows the loss of membrane potential (%age) and the data are expressed as the mean ± SD of three replicate experiments. Asterisks represent significant differences and are fixed at p ≤ 0.05 (* represents significant differences with respect to control cells whereas # represents significant differences with respect to B(a)P-treated cells).
Figure 9
Figure 9
B(a)P-induced alterations in the activities of the respiratory enzyme complexes and bioenergetics. Mitochondrial respiratory complex activities, Complex I (A), Complex II/III (B), and Complex IV (C) measured in HepG2 cells treated with B(a)P and/or AZD, using their respective substrates. ATP production (D) measured using the Bioluminescent assay kit per the vendor’s instructions. The activity of Aconitase (E), a ROS-sensitive Krebs’s cycle enzyme, measured using the Aconitase assay kit and the expression of the enzyme (F) checked via immunoblotting and densitometric analysis. Activity measurement histograms and a quantitation of the blots are represented as the mean ± SD of three replicate experiments. Asterisks represent significant differences and are fixed at p ≤ 0.05 (* represents significant differences with respect to control cells whereas # represents significant differences with respect to B(a)P-treated cells). Molecular weights are expressed in kDa.
Figure 10
Figure 10
Expression of mitochondrial oxidative stress markers induced by B(a)P. Sub-cellular fractions (mitochondria and post-mitochondria) from HepG2 cells treated with B(a)P and/or AZD resolved using 12% SDS-PAGE, transferred via Western blotting, and immunoblotted using the protein-specific antibodies against Bax (A), Bcl-2 (B), and cytochrome c (C). Immunoreactive proteins were visualized via enhanced chemiluminescence using Sapphire Biomolecular Imager (Azure biosystems, Dublin, OH, USA) or by developing them on X-ray films. Beta-actin and VDAC were used as loading controls for total/post-mitochondrial and mitochondrial fractions, respectively. Image Studio Lite Ver.5.2 (LI-COR Biosciences, Lincoln, NE, USA) software was used for the densitometric analysis of the protein bands and these were plotted as ratios relative to their appropriate loading proteins and are represented as histograms. A typical representation of at least three replicate experiments is shown. Asterisks represent significant differences and are fixed at p ≤ 0.05 (* represents significant differences with respect to control cells whereas # represents significant differences with respect to B(a)P-treated cells). Molecular weights are expressed in kDa.
Figure 11
Figure 11
Expression of inflammatory stress markers induced by B(a)P. Sub-cellular fractions (nuclear and post-mitochondria) from HepG2 cells treated with B(a)P and/or AZD resolved using 12% SDS-PAGE, transferred via Western blotting, and immunoblotted with antibodies against NF-κB p65 cytosolic (A), NF-κB p65 nuclear (B), IκB (C), and SIRT 1 (D). Immunoreactive proteins were visualized via enhanced chemiluminescence using Sapphire Biomolecular Imager (Azure biosystems, Dublin, CA, USA) or by developing them on X-ray films. Beta-actin and Histone H3 were used as loading controls for total/post-mitochondrial and nuclear fractions, respectively. Image Studio Lite Ver.5.2 (LI-COR Biosciences, Lincoln, NE, USA) was used for densitometric analysis and the band intensities are represented as ratios of the specific proteins relative to their appropriate loading proteins and as histograms. A typical representation of three replicate experiments is shown. Asterisks represent significant differences and are fixed at p ≤ 0.05 (* represents significant differences with respect to control cells whereas # represents significant differences with respect to B(a)P-treated cells). Molecular weights are expressed in kDa.
Figure 12
Figure 12
Expression of regulatory markers of cellular defense induced by B(a)P. Sub-cellular fractions (nuclear and post-mitochondria) from HepG2 cells treated with B(a)P and/or AZD resolved using 12% SDS-PAGE, transferred via Western blotting, and immunoblotted using the protein-specific antibodies against nuclear Nrf2 (A), cytosolic Nrf2 (B), and HO-1 (C). Immunoreactive proteins were visualized via enhanced chemiluminescence using Sapphire Biomolecular Imager (Azure biosystems, Dublin, CA, USA) or by developing them on X-ray films. Beta-actin and Histone H3 were used as loading controls for total/post-mitochondrial and nuclear fractions, respectively. Image Studio Lite Ver.5.2 (LI-COR Biosciences, Lincoln, NE, USA) was used for the densitometric analysis of the protein bands and these are represented as ratios relative to their appropriate loading controls and as histograms. A typical representation of three replicate experiments is shown. Asterisks represent significant differences and are fixed at p ≤ 0.05 (* represents significant differences with respect to control cells whereas # represents significant differences with respect to B(a)P-treated cells). Molecular weights are expressed in kDa.
Figure 13
Figure 13
Expression of autophagy markers induced by B(a)P. Total cell extracts from HepG2 cells treated with B(a)P and/or AZD resolved using 12% SDS-PAGE, transferred via Western blotting, and immunoblotted with antibodies against LC3 (A), p62 (B), and Atg-5 (C). Immunoreactive proteins visualized via enhanced chemiluminescence using Sapphire Biomolecular Imager (Azure biosystems, Dublin, CA, USA) or by developing them on X-ray films. The loading control was beta-actin. Image Studio Lite Ver.5.2 (LI-COR Biosciences, Lincoln, NE, USA) was used for densitometric analysis and the results are expressed as ratios relative to their appropriate loading proteins and represented as histograms. A typical representation of three replicate experiments is shown. Asterisks represent significant differences and are fixed at p ≤ 0.05 (* represents significant differences with respect to control cells whereas # represents significant differences with respect to B(a)P-treated cells). Molecular weights are expressed in kDa.
Figure 14
Figure 14
B(a)P-induced attenuation in cell signaling protein expression. Cell homogenates from B(a)P- and/or AZD- treated HepG2 cells resolved using 12% SDS-PAGE, transferred via Western blotting, and immunoblotted using the protein-specific antibodies against Akt/p-Akt (A) and mTOR/p-mTOR (B). Immunoreactive proteins were visualized via enhanced chemiluminescence using Sapphire Biomolecular Imager (Azure biosystems, Dublin, CA, USA) or by developing them on X-ray films. Bar diagrams represent the ratios of the phosphorylated proteins relative to the respective total proteins. A typical representation of three replicate experiments is shown. Asterisks represent significant differences and are fixed at p ≤ 0.05 (* represents significant differences with respect to control cells whereas # represents significant differences with respect to B(a)P-treated cells). Molecular weights are expressed in kDa.

Similar articles

Cited by

References

    1. Chhikara B.S., Parang K. Global Cancer Statistics 2022: The Trends Projection Analysis. Chem. Biol. Lett. 2023;10:451
    1. U.S. EPA . IRIS Toxicological Review of Benzo[A]Pyrene (Final Report) U.S. Environmental Protection Agency; Washington, DC, USA: 2017. EPA/635/R-17/003F.
    1. Liu B.-Y., Chiou J.-Z., Huang K.-M., Chen T.-Y., Hwang D.-F. Effects of Taurine against Benzo[α]Pyrene-Induced Cell Cycle Arrest and Reactive Oxygen Species-Mediated Nuclear Factor-Kappa B Apoptosis via Reduction of Mitochondrial Stress in A549 Cells. Chin. J. Physiol. 2022;65:199. doi: 10.4103/0304-4920.354803. - DOI - PubMed
    1. Nemmar A., Raza H., Subramaniyan D., Yasin J., John A., Ali B.H., Kazzam E.E. Short-Term Systemic Effects of Nose-Only Cigarette Smoke Exposure in Mice: Role of Oxidative Stress. Cell. Physiol. Biochem. 2013;31:15–24. doi: 10.1159/000343345. - DOI - PubMed
    1. Raza H., John A., Nemmar A. Short-Term Effects of Nose-Only Cigarette Smoke Exposure on Glutathione Redox Homeostasis, Cytochrome P450 1A1/2 and Respiratory Enzyme Activities in Mice Tissues. Cell. Physiol. Biochem. 2013;31:683–692. doi: 10.1159/000350087. - DOI - PubMed

LinkOut - more resources