. 2023 Nov 16;12(11):2007.
doi: 10.3390/antiox12112007.

c-Abl Phosphorylates MFN2 to Regulate Mitochondrial Morphology in Cells under Endoplasmic Reticulum and Oxidative Stress, Impacting Cell Survival and Neurodegeneration

Affiliations

c-Abl Phosphorylates MFN2 to Regulate Mitochondrial Morphology in Cells under Endoplasmic Reticulum and Oxidative Stress, Impacting Cell Survival and Neurodegeneration

Alexis Martinez et al. Antioxidants (Basel). .

Abstract

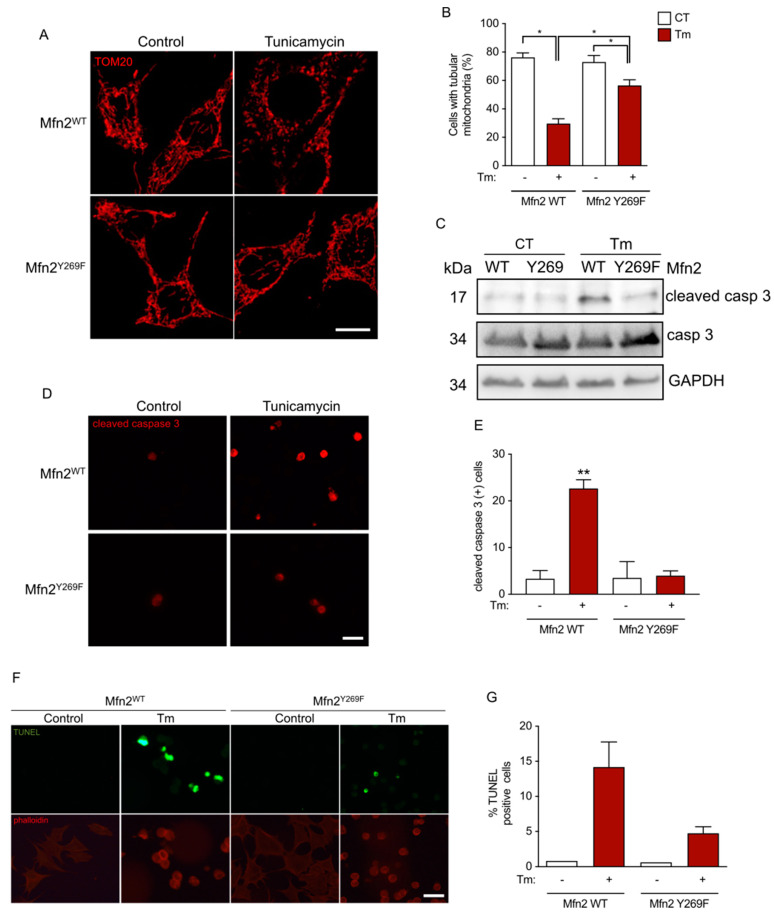
The endoplasmic reticulum is a subcellular organelle key in the control of synthesis, folding, and sorting of proteins. Under endoplasmic reticulum stress, an adaptative unfolded protein response is activated; however, if this activation is prolonged, cells can undergo cell death, in part due to oxidative stress and mitochondrial fragmentation. Here, we report that endoplasmic reticulum stress activates c-Abl tyrosine kinase, inducing its translocation to mitochondria. We found that endoplasmic reticulum stress-activated c-Abl interacts with and phosphorylates the mitochondrial fusion protein MFN2, resulting in mitochondrial fragmentation and apoptosis. Moreover, the pharmacological or genetic inhibition of c-Abl prevents MFN2 phosphorylation, mitochondrial fragmentation, and apoptosis in cells under endoplasmic reticulum stress. Finally, in the amyotrophic lateral sclerosis mouse model, where endoplasmic reticulum and oxidative stress has been linked to neuronal cell death, we demonstrated that the administration of c-Abl inhibitor neurotinib delays the onset of symptoms. Our results uncovered a function of c-Abl in the crosstalk between endoplasmic reticulum stress and mitochondrial dynamics via MFN2 phosphorylation.

Keywords: amyotrophic lateral sclerosis; apoptosis; c-Abl; endoplasmic reticulum stress; mitochondrial fusion; mitofusin 2.


Conflict of interest statement

The authors declare that this research was conducted in the absence of any commercial or financial relationships that could be construed as a potential conflict of interest. The funders had no role in the design of the study; in the collection, analyses, or interpretation of data; in the writing of the manuscript; or in the decision to publish the results. Neurotinib is under the patent WO2019/173761 A1. D.R.G. consults and/or has equity in Ventus Pharmaceuticals and Sonata Therapeutics, and receives support from Horizon Pharmaceuticals.

Figures

Figure 1
Figure 1
c-Abl is activated and localized in mitochondria in response to ER stress and collaborates in mitochondrial fragmentation. (A) Hippocampal primary neurons of 7 days in vitro were exposed to tunicamycin (Tm) or thapsigargin (Th) for 2 h and the immunodetection against phospho-c-Abl (red) was analyzed regarding mitochondrial localization with cytochrome c (green). Scale bar: 5 μm. (B) p-c-Abl and ER stress markers are increased after Tm treatment in hippocampal primary neurons. (C) Mitochondrial morphology of primary hippocampal neurons detecting TOM20 (red) and βIII tubulin (green) in treatments with Tm or Imatinib (Ima) for 10 h. Scale bar: 5 μm. (D) Quantification of mitochondrial length from neuronal processes in experiments performed in (C). (E) Mitochondrial morphology of MEFs detecting Mitotracker (magenta) in treatments with Tm or Ima for 10 h. Scale bar: 10 μm; inset: 5 μm. (F) Mitochondrial sphericity from experiments performed in (E). (G) MTT assay in MEFs in treatments with Tm or Ima for 10 h. (H) Sytox assay in MEFs in treatments with Tm or Ima for the indicated times. One-way ANOVA with Bonferroni post-test. Results are presented as mean ± SEM. p * < 0.05, p *** < 0.001.
Figure 2
Figure 2
c-Abl regulates mitochondrial morphology in hippocampal primary neurons in response to ER stress. (A) c-Abl expression in primary neurons from WT and c-Abl-deficient (ABL1-cKO) mice. (B) Representative images of WT and ABL1-cKO primary hippocampal neurons treated with Tm for 8 h and immunostained for anti βIII tubulin (green) as the neuronal marker and TOM20 (red) as the mitochondrial marker. Scale bar: 5 μm. (C) Quantification of mitochondrial length from neuronal processes from experiments performed in (B). One-way ANOVA with Bonferroni post-test. Results are presented as mean ± SEM. ns: not significant, p *** < 0.001.
Figure 3
Figure 3
c-Abl activity induces mitochondrial fragmentation. (A) Generation of a tamoxifen-inducible system for constitutively active c-Abl (c-Abl WT ERT2) or kinase-dead (c-Abl KD ERT2) variants. (B) Activity of c-Abl variants in MEFs after ER stress was checked by immunoblot of c-Abl and a well-known substrate of c-Abl, p-Crk II. (C) Confocal microscopy of MEF cells overexpressing mitochondrial Cerulean-OMM (cyan) and the mCherry (red) empty vector (EV), c-Abl WT ERT2, or c-Abl KD ERT2 system, revealing the mitochondrial morphology under stimulation with tamoxifen. Scale bar: 20 μm. (D) Quantification of mitochondrial sphericity expressed as the percentage of sphericity relative to FCCP treatment in MEFs expressing the EV. One-way ANOVA with Bonferroni post-test. Results are presented as mean ± SEM. p * < 0.05.
Figure 4
Figure 4
Activated c-Abl phosphorylates MFN2 in Y269. (A) Co-immunoprecipitation assay against endogenous levels for MFN2 and c-Abl in Tm or Ima treatments in MEF cells. (B) Co-immunoprecipitation assay for MEF cells over-expressing FLAG-MFN2 using agarose-anti-FLAG beads and detecting c-Abl in Tm or Ima treatments in MEF cells. (C) Phospho-tyrosine immunodetection against immunoprecipitated FLAG-MFN2 after Tm or Ima treatments in MEF cells. (D) In vitro phosphorylation with P32 orthophosphoric acid in living MEF cells and immunoprecipitation of FLAG-Mfn2 after tamoxifen (tamox)-stimulated c-Abl WT ERT2. (E) Phospho-tyrosine detection for MEF cells over-expressing either FLAG-MFN2 WT or FLAG-MFN2 Y269F variants in response to Tm. (F) In vitro phosphorylation of immunoprecipitated MFN2-FLAG, P32 gamma ATP (2.5 μCi), and recombinant c-Abl. (G) Scintillation counting of radiolabeled MFN2-FLAG after indicated times. (H) Modelling of Y269 residue in the MFN2 GTPase domain. (I) FLAG-MFN2 was immunoprecipitated and then incubated with GTP-agarose beads for 60 min at 30 °C. The bound proteins were analyzed via immunoblotting using FLAG antibody. One-way ANOVA with Bonferroni post-test. Results are presented as mean ± SEM. p * < 0.05.
Figure 5
Figure 5
Activated c-Abl colocalizes with mitochondria dependent on MFN2 interaction. (A) Super-resolution microscopy revealing the c-Abl (green) localization in TOM20 (red)-stained FLAG-MFN2 WT or FLAG-MFN2 Y269F MEFs. Scale bar: 1 μm. (B) Quantification of c-Abl molecules as observed in (A). (C) Super-resolution microscopy of c-Abl (green) colocalization with FLAG-MFN2 (blue) and TOM20 (red) in FLAG-MFN2 WT or FLAG-MFN2 Y269F MEFs. Scale bar: 1 μm. (D) Quantification of c-Abl colocalizing with FLAG-MFN2. One-way ANOVA with Bonferroni post-test. Results are presented as mean ± SEM. ns: not significant, p * < 0.05, p ** < 0.01.
Figure 6
Figure 6
Mfn2 collaborates in the mitochondrial fragmentation and the apoptotic response in a Y269 residue-dependent manner. (A) Mfn2WT- and Mfn2Y269F-expressing cells were stained for TOM20 (red) and treated with vehicle (control) or exposed to Tm for 10 h. Scale bar: 20 μm. (B) The percentage of cells exhibiting tubular mitochondria in (A) was quantified. (C) Western blot against cleaved caspase 3 from Mfn2WT- and Mfn2Y269F-expressing cells exposed to Tm for 18 h. (D) Mfn2WT- and Mfn2Y269F-expressing cells were stained for cleaved caspase 3 (red) and treated with vehicle (control) or exposed to Tm for 18 h. Scale bar: 40 μm. (E) The number of cells per field exhibiting tubular mitochondria in (D) was quantified. (F) Mfn2WT- and Mfn2Y269F-expressing cells were developed for TUNEL staining (green) and phalloidin (red), and treated with vehicle (control) or exposed to Tm for 18 h. Scale bar: 40 μm. (G) The percentage of cells positive for TUNEL in (F) was quantified. One-way ANOVA with Bonferroni post-test. Results are presented as mean ± SEM. p * < 0.05, p ** < 0.01.
Figure 7
Figure 7
c-Abl regulates mitochondrial status in ALS models. (A) Confocal microscopy of primary hippocampal neurons overexpressing SOD1 WT fused to GFP (SOD1-GFP) or SOD1 G85R fused to GFP (mSOD1-GFP) in green, and stained for p-c-Abl (red) and βIII tubulin (blue), treated with vehicle or imatinib. Scale bar: 5 μm. (B) Confocal microscopy of primary hippocampal neurons overexpressing SOD1-GFP or mSOD1-GFP in green, and stained for TOM20 (red) both in soma (left side of the panel) and processes (right side of the panel) stained for and βIII tubulin (blue). Scale bar: 5 μm. (C) Mitochondrial length in neuronal processes as in (B). (D) Representative TEM images of mitochondria in the sciatic nerve from WT control-fed (n = 4) and nilotinib-fed (n = 4) mice and SOD1 G93A control-fed (n = 5) and nilotinib-fed (n = 5) mice. Scale bar = 500 nm. (E) Percentage of swollen mitochondria characterized by a disrupted external mitochondrial membrane with fragmented or swollen cristae/matrix in the sciatic nerve from (D). (F) Representative fluorescence images of NeuN in the ventral horn of the lumbar spinal cord in WT control-fed (n = 6) and nilotinib-fed (n = 5) mice, and SOD1 G93A control-fed (n = 5) and nilotinib-fed (n = 5) mice. Scale bar: 150 μm. (G) Graph shows the number of NeuN positive cells in 300,000 μm2 from (F). Two-way ANOVA with Tukey’s multiple comparisons test. Results are presented as mean ± SEM. p * < 0.05, p *** < 0.001, p **** < 0.0001.

Similar articles

Cited by

References

    1. Hetz C., Chevet E., Oakes S.A. Proteostasis Control by the Unfolded Protein Response. Nat. Cell Biol. 2015;17:829–838. doi: 10.1038/ncb3184. - DOI - PMC - PubMed
    1. Carreras-Sureda A., Pihán P., Hetz C. The Unfolded Protein Response: At the Intersection between Endoplasmic Reticulum Function and Mitochondrial Bioenergetics. Front. Oncol. 2017;7:55. doi: 10.3389/fonc.2017.00055. - DOI - PMC - PubMed
    1. Ito Y., Pandey P., Mishra N., Kumar S., Narula N., Kharbanda S., Saxena S., Kufe D. Targeting of the C-Abl Tyrosine Kinase to Mitochondria in Endoplasmic Reticulum Stress-Induced Apoptosis. Mol. Cell Biol. 2001;21:6233–6242. doi: 10.1128/MCB.21.18.6233-6242.2001. - DOI - PMC - PubMed
    1. Welch P., Wang J. A C-Terminal Protein-Binding Domain in the Retinoblastoma Protein Regulates Nuclear c-Abl Tyrosine Kinase in the Cell Cycle. Cell. 1993;75:779–790. doi: 10.1016/0092-8674(93)90497-E. - DOI - PubMed
    1. Sawyers C.L., McLaughlin J., Goga A., Havlik M., Witte O. The Nuclear Tyrosine Kinase C-Abl Negatively Regulates Cell Growth. Cell. 1994;77:121–131. doi: 10.1016/0092-8674(94)90240-2. - DOI - PubMed

LinkOut - more resources