. 2023 Oct 27;11(11):2914.
doi: 10.3390/biomedicines11112914.

Herbal Compounds Dauricine and Isoliensinine Impede SARS-CoV-2 Viral Entry

Affiliations

Herbal Compounds Dauricine and Isoliensinine Impede SARS-CoV-2 Viral Entry

Shaneek Natoya Dabrell et al. Biomedicines. .

Abstract

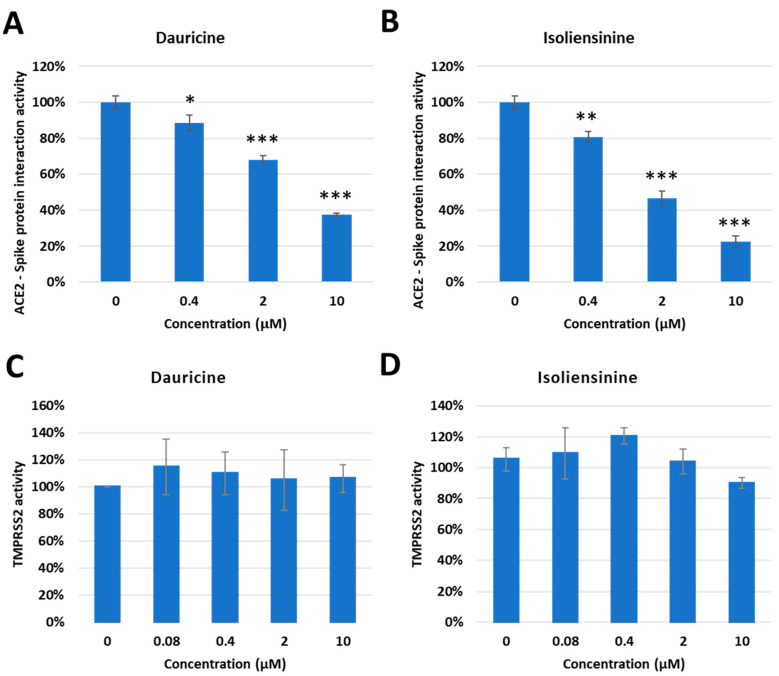
Targeting viral entry has been the focal point for the last 3 years due to the continued threat posed by SARS-CoV-2. SARS-CoV-2's entry is highly dependent on the interaction between the virus's Spike protein and host receptors. The virus's Spike protein is a key modulator of viral entry, allowing sequential cleavage of ACE2 at the S1/S2 and S2 sites, resulting in the amalgamation of membranes and subsequent entry of the virus. A Polybasic insertion (PRRAR) conveniently located at the S1/S2 site can also be cleaved by furin or by serine protease, TMPRSS2, at the cell surface. Since ACE2 and TMPRSS2 are conveniently located on the surface of host cells, targeting one or both receptors may inhibit receptor-ligand interaction. Here, we show that Dauricine and Isoliensinine, two commonly used herbal compounds, were capable of inhibiting SARS-CoV-2 viral entry by reducing Spike-ACE2 interaction but not suppressing TMPRSS2 protease activity. Further, our biological assays using pseudoviruses engineered to express Spike proteins of different variants revealed a reduction in infection rates following treatment with these compounds. The molecular modeling revealed an interconnection between R403 of Spike protein and both two compounds. Spike mutations at residue R403 are critical, and often utilized by ACE2 to gain cell access. Overall, our findings strongly suggest that Dauricine and Isoliensinine are effective in blocking Spike-ACE2 interaction and may serve as effective therapeutic agents for targeting SARS-CoV-2's viral entry.

Keywords: COVID-19; SARS-CoV-2; pandemic; vaccines.


Conflict of interest statement

The authors declare no conflict of interest.

Figures

Figure 1
Figure 1
34 compounds screened from the Chinese Herbal Medicine Library. Chemical structure for Polyphyllin I was obtained from Medchemexpress, while all other chemical structures were obtained from PubChem.
Figure 2
Figure 2
Screening of Chinese Herbal Medicine compounds reveals a reduction in SARS-CoV-2 wild-type (WT) Viral pseudoparticle (VPP) infection in the 293T-ACE2 cell line. (A) Cell viability was assessed following 24 h treatment with 10 µM of indicated compound or vehicle control (DMSO) in 293T-ACE2 cells by MTT assay. Values are normalized to vehicle control (100%) and shown as mean ± SD (n = 3). All data are shown as mean ± SD (n = 3). (B) 293T-ACE2 cells were pretreated with 10 μM of indicated compound or vehicle control (DMSO) for one hour and infected with SARS-CoV-2 WT-VPP. After 24 h of infection, the infection efficiency rate was measured according to luciferase activities. Values are normalized to vehicle control (100%) and shown as mean ± SD (n = 3). * p ≤ 0.05; ** p ≤ 0.01 compared to vehicle control.
Figure 3
Figure 3
Cytotoxic activity of Dauricine and Isoliensinine in 293T-ACE2 and VeroE6 cells. (A,B) 293T-ACE2 cells were treated with different concentrations (3.125, 6.25 12.5, 25, and 50 µM) of Dauricine (A) or Isoliensinine (B), and cell viability was detected using MTT assay. Values are normalized to vehicle control (100%) and shown as mean ± SD (n = 3). (C,D) VeroE6 cells were treated with different concentrations (3.125, 6.25, 12.5, 25, and 50 µM) of Dauricine (C) or Isoliensinine (D), and cell viability was detected using MTT assay. Values are normalized to vehicle control (100%) and shown as mean ± SD (n = 3).
Figure 4
Figure 4
Trend in infection rates post-treatment with Dauricine and Isoliensinine. (A,B) 293T-ACE2 cells were pretreated with varying concentrations (0.08, 0.4, 2, and 50 µM) of Dauricine (A) or Isoliensinine (B) for one hour and infected with SARS-CoV-2 WT-VPP. After 24 h of infection, the infection efficiency rate was measured according to luciferase activities. Values are normalized to vehicle control (100%) and shown as mean ± SD (n = 3). (C,D) VeroE6 cells were pretreated with varying concentrations (0.08, 0.4, 2, and 50 µM) of Dauricine (C) or Isoliensinine (D) for one hour and infected with SARS-CoV-2 WT-VPP. After 24 h of infection, the infection efficiency rate was measured according to luciferase activities. Values are normalized to vehicle control (100%) and shown as mean ± SD (n = 3).
Figure 5
Figure 5
Trend in infection rates among mutant forms of SARS-CoV-2. (A,B) 293T-ACE2 cells were pretreated with 2 µM Dauricine (A) or 0.2 µM Isoliensinine (B) for one hour and infected with SARS-CoV-2 VPP of different variants. After 24 h of infection, the infection efficiency rate was measured according to luciferase activities. Values are normalized to vehicle control (100%) and shown as mean ± SD (n = 3). * p ≤ 0.05; ** p ≤ 0.01 compared to vehicle control. (C,D) VeroE6 cells were pretreated with 1.5 µM Dauricine (C) or 0.5 µM Isoliensinine (D) for one hour and infected with SARS-CoV-2 VPP of different variants. After 24 h of infection, the infection efficiency rate was measured according to luciferase activities. Values are normalized to vehicle control (100%) and shown as mean ± SD (n = 3). ** p ≤ 0.01; *** p ≤ 0.001 compared to vehicle control.
Figure 6
Figure 6
Inhibitory Effect of Dauricine and Isoliensinine on ACE2-Spike protein interaction and TMPRSS2 activity. (A,B) The percentage of Spike-ACE2 interaction from the FRET-base assay was shown with the indicated concentration of Dauricine (A) or Isoliensinine (B). Values are normalized to vehicle control (100%) and shown as mean ± SD (n = 3). * p ≤ 0.05; ** p ≤ 0.01; *** p ≤ 0.001 compared to vehicle control. (C,D) The TMPRSS2 enzymatic activity in vivo was measured by using a FRET-base assay with an increasing amount of Dauricine (C) or Isoliensinine (D). Values are normalized to vehicle control (100%) and shown as mean ± SD (n = 3).
Figure 7
Figure 7
Impaired attenuation of infection rates in TMPRSS2 overexpressed cells. (A,B) 293T-ACE2 cells with and without TMPRSS2 expression were pretreated with the indicated concentrations (0.08, 0.4, 2, and 10 µM) of Dauricine (A) or Isoliensinine (B) and then infected with SARS-CoV-2 WT-VPP. After 24 h of infection, the infection efficiency rate was measured according to luciferase activities. Blue line (cont): empty vector control group; Orange line (TMPRSS2): TMPRSS2 overexpressing group. Values are normalized to vehicle control (100%) and shown as mean ± SD (n = 3). (C,D) VeroE6 cells with and without TMPRSS2 expression were pretreated with the indicated concentrations (0.08, 0.4, 2, and 10 µM) of Dauricine (C) or Isoliensinine (D), and then infected with SARS-CoV-2 WT-VPP. After 24 h of infection, the infection efficiency rate was measured according to luciferase activities. Blue line (cont): empty vector control group; Orange line (TMPRSS2): TMPRSS2 overexpressing group. Values are normalized to vehicle control (100%) and shown as mean ± SD (n = 3).
Figure 8
Figure 8
Molecular docking interaction of Dauricine and Isoliensinine in the binding pocket of SARS-CoV-2_RDB-hACE2 complex. The blue colors represent different variants of SARS-CoV-2_RDB residues, whereas green colors represent human ACE2. The orange colors represent Dauricine, whereas the gray colors represent Isoliensinine. (A) The binding mode between Dauricine and B.1.1.529 variant of SARS-CoV-2_RDB-hACE2 complex. (B) The binding mode between Isoliensinine and B.1.1.529 variant of SARS-CoV-2_RDB-hACE2 complex. (C) The binding mode between Isoliensinine and B.1.617 variant of SARS-CoV-2_RDB-hACE2 complex. (D) The surface electrostatic potential map with the best docking pose. Dauricine and Isoliensinine are colored orange and gray, respectively. Electrostatic surface potentials are colored red and blue for negative and positive charges, respectively.

Similar articles

Cited by

References

    1. Machhi J., Herskovitz J., Senan A.M., Dutta D., Nath B., Oleynikov M.D., Blomberg W.R., Meigs D.D., Hasan M., Patel M., et al. The Natural History, Pathobiology, and Clinical Manifestations of SARS-CoV-2 Infections. J. Neuroimmune Pharmacol. 2020;15:359–386. doi: 10.1007/s11481-020-09944-5. - DOI - PMC - PubMed
    1. McCarthy K.R., Rennick L.J., Nambulli S., Robinson-McCarthy L.R., Bain W.G., Haidar G., Duprex W.P. Recurrent deletions in the SARS-CoV-2 spike glycoprotein drive antibody escape. Science. 2021;371:1139–1142. doi: 10.1126/science.abf6950. - DOI - PMC - PubMed
    1. Belouzard S., Chu V.C., Whittaker G.R. Activation of the SARS coronavirus spike protein via sequential proteolytic cleavage at two distinct sites. Proc. Natl. Acad. Sci. USA. 2009;106:5871–5876. doi: 10.1073/pnas.0809524106. - DOI - PMC - PubMed
    1. Shang J., Wan Y., Luo C., Ye G., Geng Q., Auerbach A., Li F. Cell entry mechanisms of SARS-CoV-2. Proc. Natl. Acad. Sci. USA. 2020;117:11727–11734. doi: 10.1073/pnas.2003138117. - DOI - PMC - PubMed
    1. Johnson B.A., Xie X., Bailey A.L., Kalveram B., Lokugamage K.G., Muruato A., Zou J., Zhang X., Juelich T., Smith J.K., et al. Loss of furin cleavage site attenuates SARS-CoV-2 pathogenesis. Nature. 2021;591:293–299. doi: 10.1038/s41586-021-03237-4. - DOI - PMC - PubMed

LinkOut - more resources