

Inflammatory Bowel Disease Increases the Severity of Myocardial Infarction after Acute Ischemia-Reperfusion Injury in Mice
- PMID: 38001946
- PMCID: PMC10669621
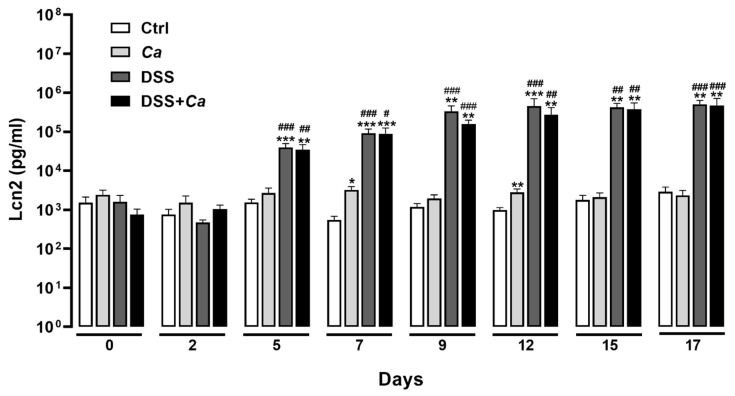
- DOI: 10.3390/biomedicines11112945
Inflammatory Bowel Disease Increases the Severity of Myocardial Infarction after Acute Ischemia-Reperfusion Injury in Mice
Abstract
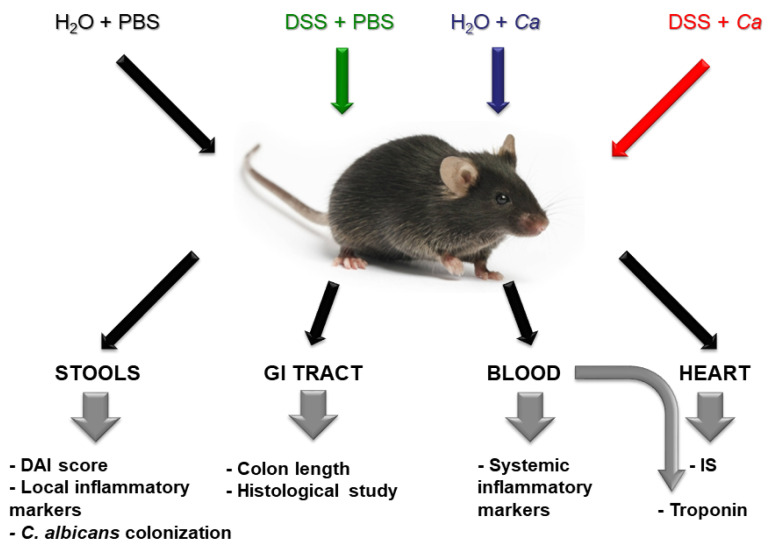
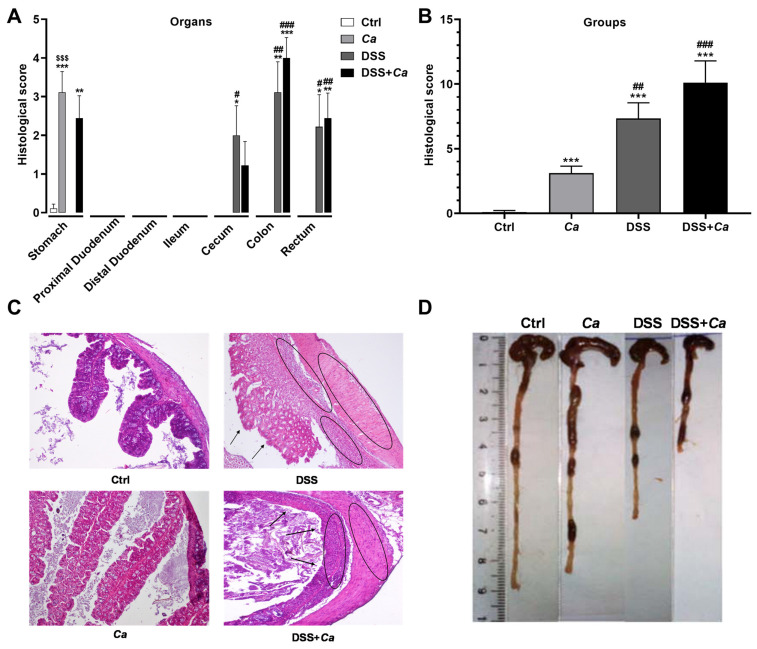
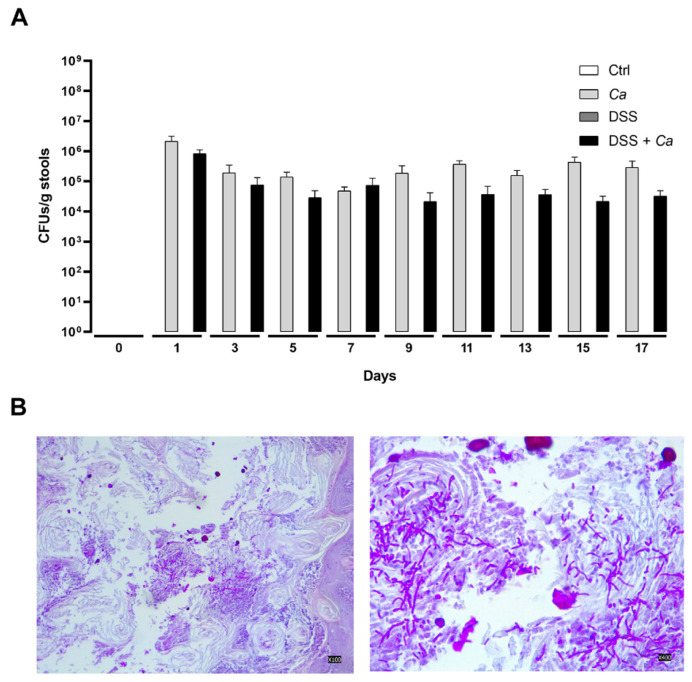
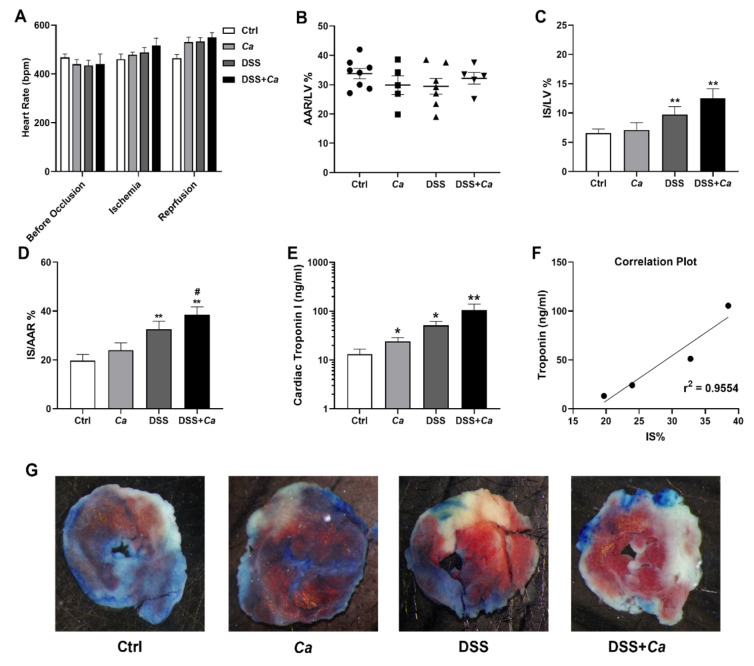
(1) Background: Increased risk of myocardial infarction (MI) has been linked to several inflammatory conditions, including inflammatory bowel disease (IBD). However, the relationship between IBD and MI remains unclear. Here, we implemented an original mouse model combining IBD and MI to determine IBD's impact on MI severity and the link between the two diseases. (2) Methods: An IBD model was established by dextran sulfate sodium (DSS) administration in drinking water, alone or with oral C. albicans (Ca) gavage. IBD severity was assessed by clinical/histological scores and intestinal/systemic inflammatory biomarker measurement. Mice were subjected to myocardial ischemia-reperfusion (IR), and MI severity was assessed by quantifying infarct size (IS) and serum cardiac troponin I (cTnI) levels. (3) Results: IBD mice exhibited elevated fecal lipocalin 2 (Lcn2) and IL-6 levels. DSS mice exhibited almost two-fold increase in IS compared to controls, with serum cTnI levels strongly correlated with IS. Ca inoculation tended to worsen DSS-induced systemic inflammation and IR injury, an observation which is not statistically significant. (4) Conclusions: This is the first proof-of-concept study demonstrating the impact of IBD on MI severity and suggesting mechanistic aspects involved in the IBD-MI connection. Our findings could pave the way for MI therapeutic approaches based on identified IBD-induced inflammatory mediators.
Keywords: animal model; cytokines; inflammatory bowel disease; ischemia–reperfusion injury; myocardial infarction; translational medicine.
Conflict of interest statement
The authors declare no conflict of interest.
Figures


Similar articles
-
Additional Candida albicans administration enhances the severity of dextran sulfate solution induced colitis mouse model through leaky gut-enhanced systemic inflammation and gut-dysbiosis but attenuated by Lactobacillus rhamnosus L34.Gut Microbes. 2020 May 3;11(3):465-480. doi: 10.1080/19490976.2019.1662712. Epub 2019 Sep 18. Gut Microbes. 2020. PMID: 31530137 Free PMC article.
-
Investigating intestinal inflammation in DSS-induced model of IBD.J Vis Exp. 2012 Feb 1;(60):3678. doi: 10.3791/3678. J Vis Exp. 2012. PMID: 22331082 Free PMC article.
-
Acute myocardial infarction and myocardial ischemia-reperfusion injury: a comparison.Int J Clin Exp Pathol. 2015 Aug 1;8(8):8786-96. eCollection 2015. Int J Clin Exp Pathol. 2015. PMID: 26464621 Free PMC article.
-
Cathelicidin aggravates myocardial ischemia/reperfusion injury via activating TLR4 signaling and P2X7R/NLRP3 inflammasome.J Mol Cell Cardiol. 2020 Feb;139:75-86. doi: 10.1016/j.yjmcc.2019.12.011. Epub 2020 Jan 23. J Mol Cell Cardiol. 2020. PMID: 31982429
-
Fermented barley and soybean (BS) mixture enhances intestinal barrier function in dextran sulfate sodium (DSS)-induced colitis mouse model.BMC Complement Altern Med. 2016 Dec 3;16(1):498. doi: 10.1186/s12906-016-1479-0. BMC Complement Altern Med. 2016. PMID: 27912750 Free PMC article.
References
-
- WHO . The Top 10 Causes of Death. WHO; Geneva, Switzerland: 2020.
LinkOut - more resources
Full Text Sources
Research Materials
Miscellaneous
