. 2023 Nov 1;11(11):2953.
doi: 10.3390/biomedicines11112953.

Matrix Metalloproteinase 9/microRNA-145 Ratio: Bridging Genomic and Immunological Variabilities in Thyroid Cancer

Affiliations

Matrix Metalloproteinase 9/microRNA-145 Ratio: Bridging Genomic and Immunological Variabilities in Thyroid Cancer

Eman A Toraih et al. Biomedicines. .

Abstract

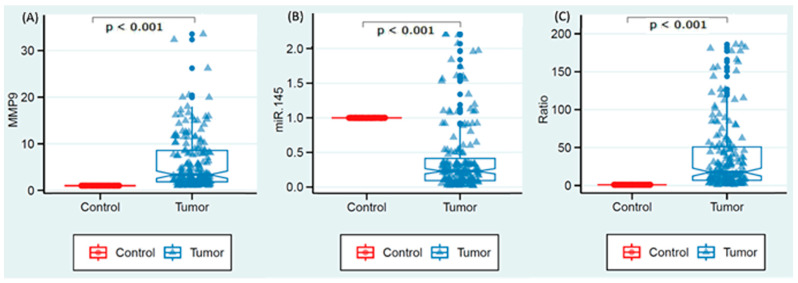
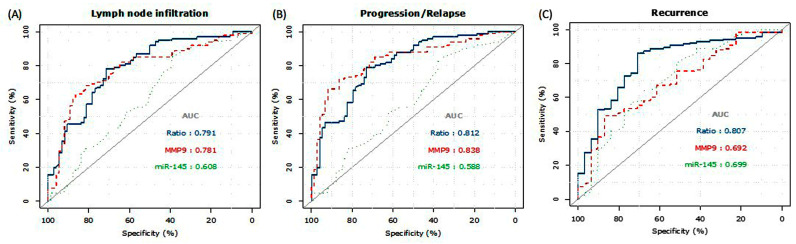
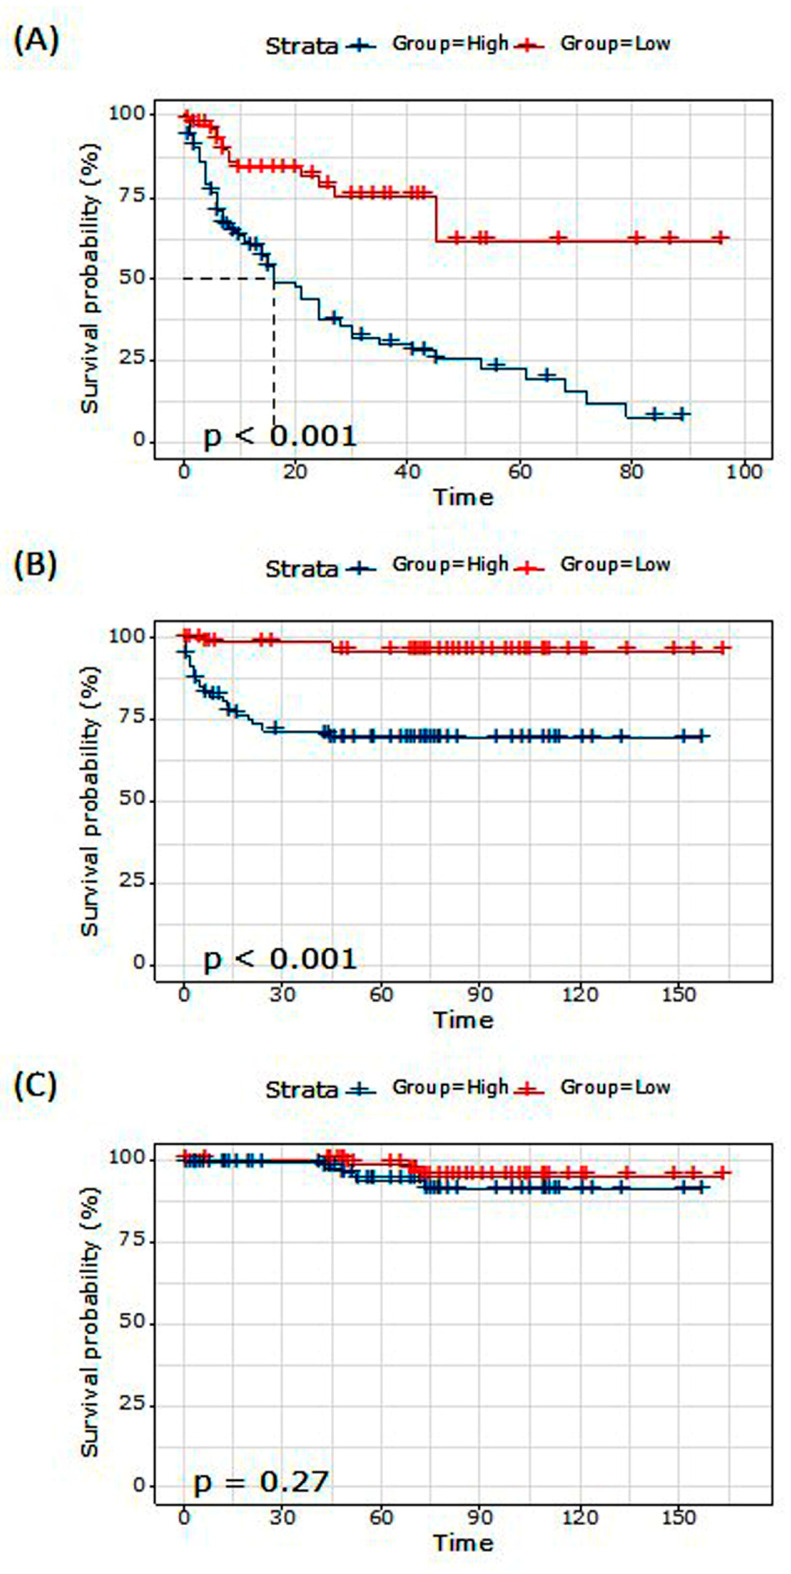
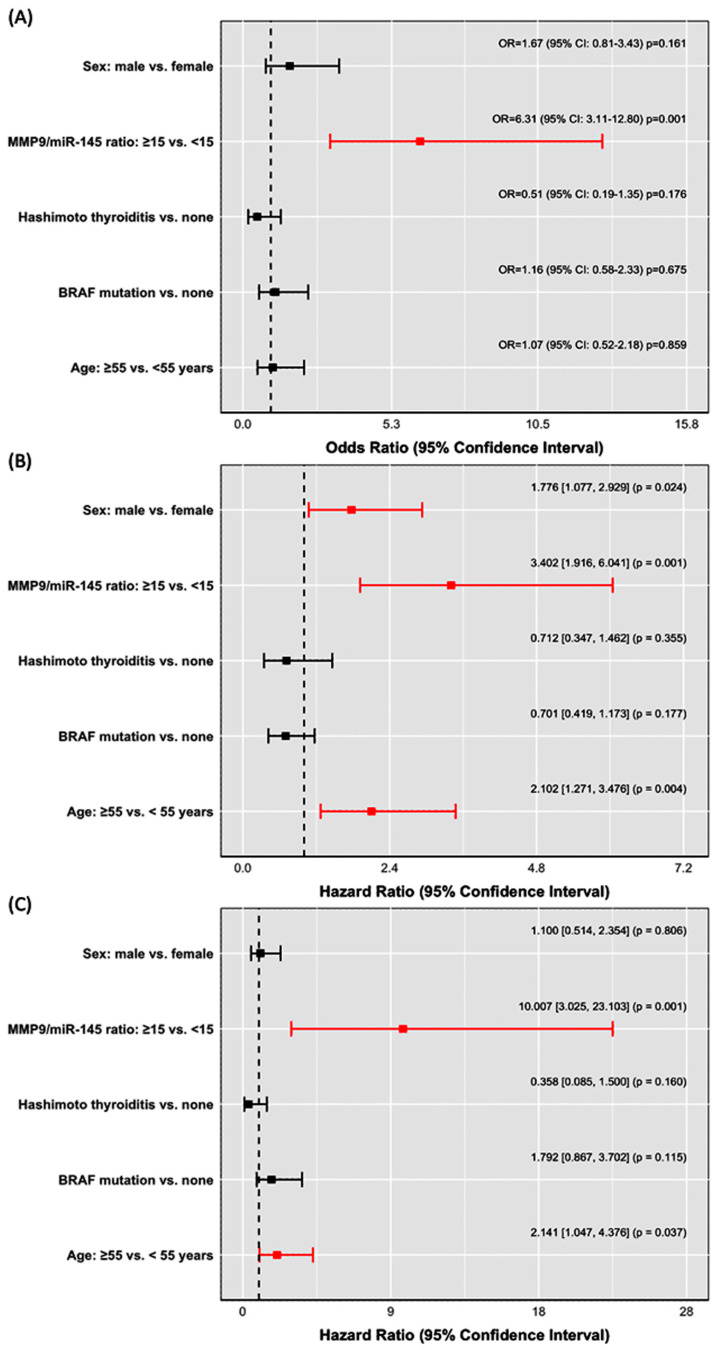
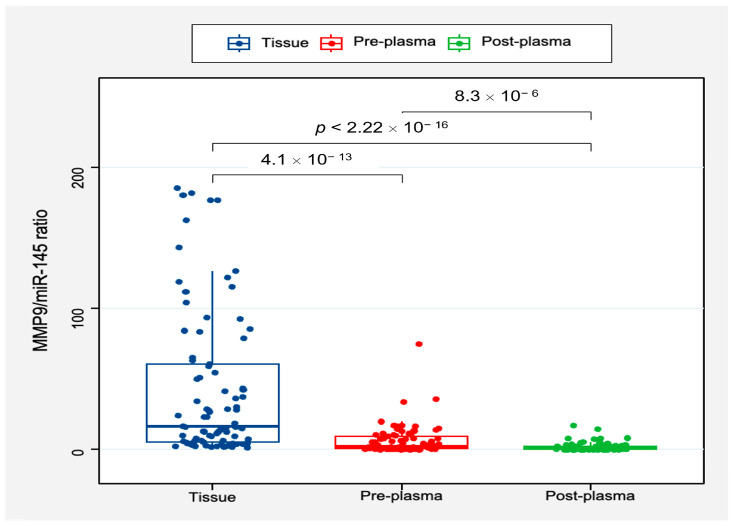
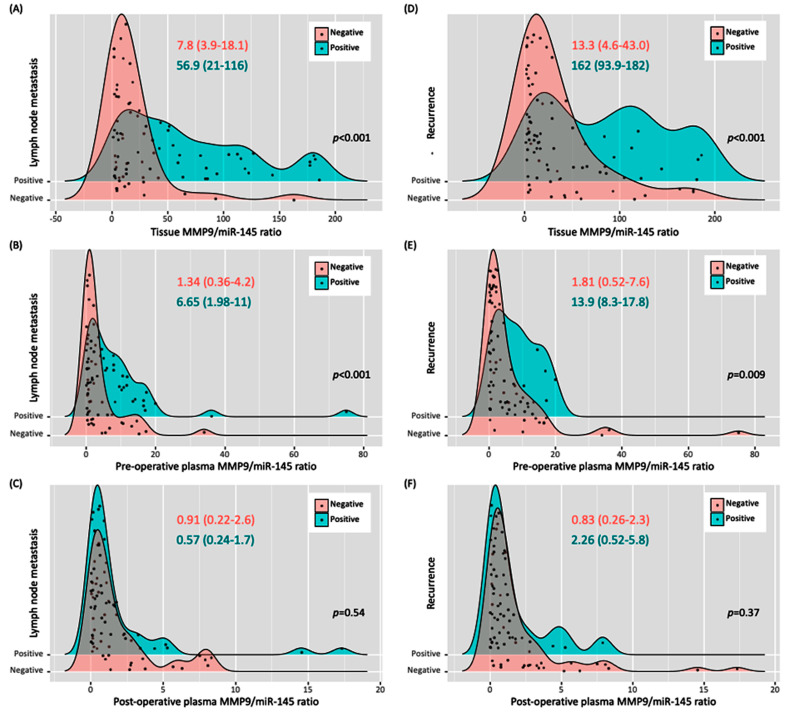
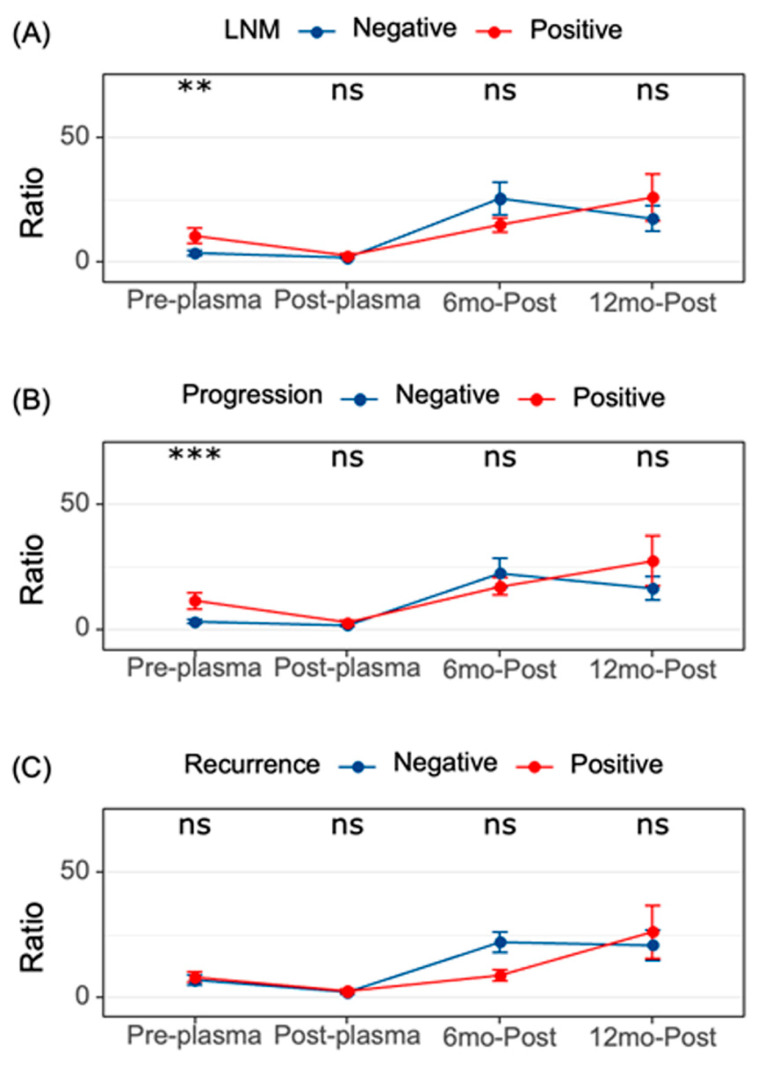
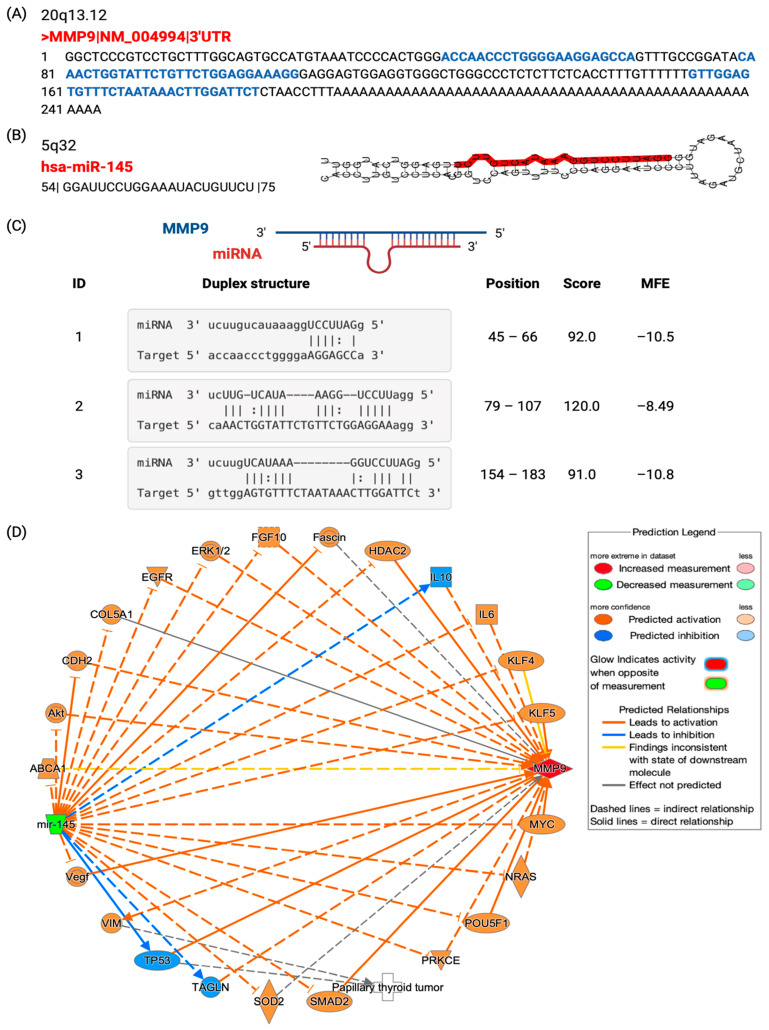
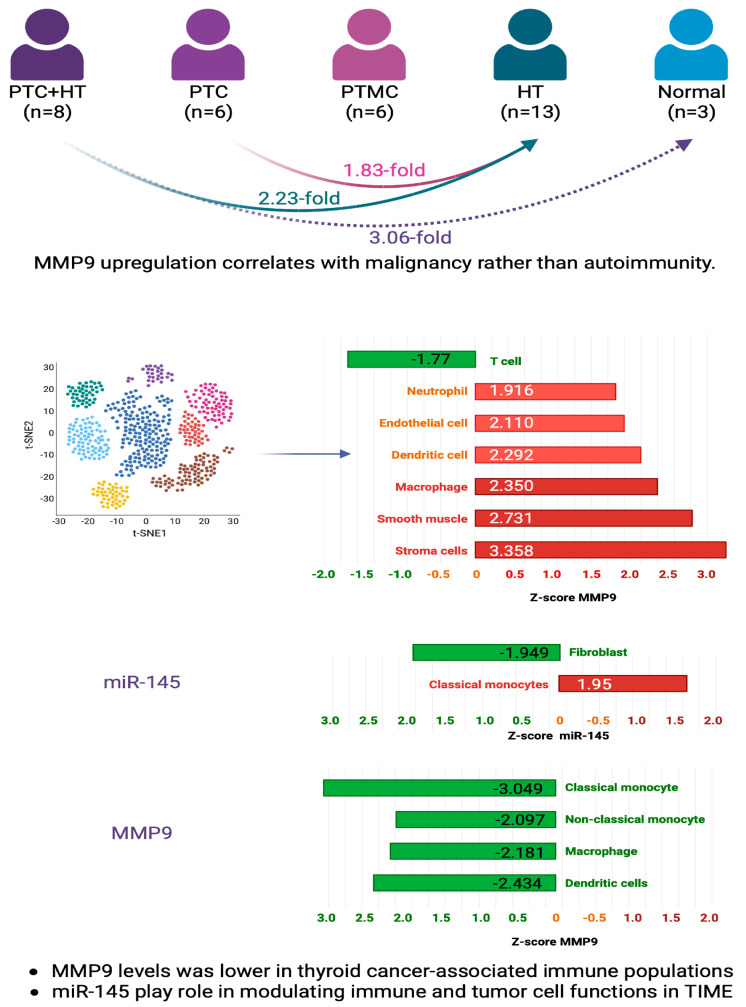
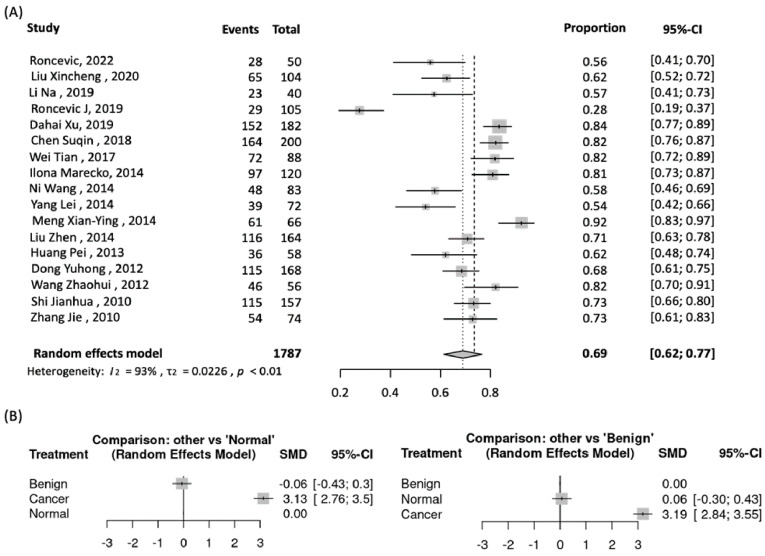
Matrix metalloproteinase 9 (MMP9) and microRNA-145 (miR-145) have emerged as essential biomarkers in thyroid cancer progression and metastasis. However, their combined evaluation and clinical utility as a unified prognostic marker across diverse thyroid cancer subgroups remain unexplored. We investigated the diagnostic and prognostic value of the MMP9/miR-145 ratio in thyroid cancer, hypothesizing it may overcome inter-patient heterogeneity and serve as a versatile biomarker regardless of genetic mutations or autoimmune status. MMP9 and miR-145 expressions were analyzed in 175 paired papillary thyroid cancer (PTC) and normal tissues. Plasma levels were assessed perioperatively and longitudinally over 12-18 months in 86 matched PTC patients. The associations with clinicopathological parameters and patient outcomes were evaluated. MMP9 was upregulated, and miR-145 downregulated in cancer tissues, with a median MMP9/miR-145 ratio 17.6-fold higher versus controls. The tissue ratio accurately diagnosed thyroid malignancy regardless of BRAF mutation or Hashimoto's thyroiditis status, overcoming genetic and autoimmune heterogeneity. A high preoperative circulating ratio predicted aggressive disease features, including lymph node metastasis, extrathyroidal extension, progression/relapse, and recurrence. Although the preoperative plasma ratio was elevated in patients with unfavorable outcomes, it had limited utility for post-surgical monitoring. In conclusion, the MMP9/miR-145 ratio is a promising biomarker in PTC that bridges genetic and immunological variabilities, enhancing preoperative diagnosis and prognostication across diverse patient subgroups. It accurately stratifies heterogenous cases by aggressiveness. The longitudinal trends indicate decreasing applicability for post-thyroidectomy surveillance. Further large-scale validation and protocol standardization can facilitate clinical translation of the MMP9/miR-145 ratio to guide personalized thyroid cancer management.

Keywords: BRAF; MMP9/miR-145 ratio; PTC; biomarker; perioperative assessment; thyroid cancer.


Conflict of interest statement

The authors declare no conflict of interest.

Figures

Figure 1
Figure 1
MMP9 and miR-145 expression pattern in thyroid tumors compared to normal controls. (A) The expression level of MMP9 RNA in tissues. (B) The expression level of miR-145 in tissues. (C) The ratio between the expression levels of MMP9 and miR-145 in thyroid tissues. The box represents the middle 50% of the data (between 25th and 75th percentiles). The whiskers indicate the ranges for the upper and lower 25% of the data, excluding outliers. The triangles represent individual data points for each tumor sample. The dots outside the whiskers represent the mean values of the outliers at that height. Paired non-tumor and tumor samples (n = 175 patients) were compared. Related-samples Wilcoxon signed rank test was used. Statistical significance was considered at p < 0.05.
Figure 2
Figure 2
Prognostic accuracy of MMP9 and miR-145 expression in papillary thyroid carcinoma. Receiver operator characteristics (ROC) curve analysis was employed for MMP9, miR-145, and the ratio MMP9/miR-145. Areas under the curve (AUCs) were estimated and compared for detecting (A) lymph nodal metastasis. (B) Disease progression and relapse. (C) Recurrence. Statistical significance was considered at p < 0.05. The AUC is a pivotal metric that quantifies the diagnostic capability of a biomarker or test to differentiate between the positive and negative groups. An AUC of 1.0 signifies perfect discrimination, whereas an AUC of 0.5 indicates a performance no better than chance.
Figure 3
Figure 3
Kaplan–Meier curve for survival analysis. MMP9/miR-145 ratio was used to categorize patients at the cutoff of 15 into high expressors and low expressors. Survival times are presented in months on x-axis. Comparison was performed using log rank (Mantel–Cox) test. Significance was set at p < 0.05. (A) Relapse-free survival times. (B) Disease-free survival time. (C) Overall survival analysis.
Figure 4
Figure 4
Impact of MMP9/miR-145 ratio in thyroid tissues on predicting disease outcomes at the time of surgery. (A) Risk factors predicting lymph node metastasis. Multivariate logistic regression analysis was employed, and odds ratio (OR) and 95% confidence intervals (CI) were reported. (B) Risk factors predicting disease progression and relapse. Cox regression model was performed, and hazards ratio (HR) and 95% CI were reported. (C) Risk factors predicting recurrence. Cox regression model was performed, and HR and 95% CI were reported.
Figure 5
Figure 5
Circulatory expression of MMP9/miR-145 ratio in PTC patients. A comparative analysis of plasma and tissue samples of 86 PTC patients. Boxplot representing the median and interquartile range of the timepoint. Related-samples Friedman’s two-way analysis of variance by ranks test. Significance values have been adjusted by the Bonferroni correction for multiple tests.
Figure 6
Figure 6
Comparative densitogram of MMP9/miR-145 ratios in PTC patients. Comparative analysis of patients based on the presence or absence of LNM and recurrence among 86 participants with PTC. Panels A to C differentiate between 42 patients with LNM and 44 patients without LNM. (A) Ratio in tissue. (B) Ratio in pre-operative plasma. (C) Ratio in immediate post-operative plasma. Meanwhile, panels D to F compare 17 patients with recurrence to the 69 without recurrence. (D) Ratio in tissue. (E) Ratio in pre-operative plasma. (F) Ratio in immediate post-operative plasma. Statistical analysis was conducted using the independent-samples Mann–Whitney U Test. A p-value of less than 0.05 was considered statistically significant.
Figure 7
Figure 7
Evaluating the predictive capacity of plasma MMP9/miR-145 ratio. Subgroup analysis by (A) LNM: lymph node metastasis, (B) progression, and (C) recurrence to compare post-operative MMP9/miR-145 ratio values in circulation. The analysis was performed using the related-samples Friedman’s two-way analysis of variance by ranks test. All significant values were adjusted by the Bonferroni correction for multiple tests. ** p < 0.01, *** p < 0.001. ns: non-significant.
Figure 8
Figure 8
MMP9 expression patterns and correlation with immune infiltration across thyroid tissue types. (A) Boxplot showing MMP9 and CD45 expression intensity across normal, non-cancer adjacent tissues (NAT), and malignant thyroid tissues. (B) Boxplot showing the MMP9 and CD45 positive area across tissue types. Y axes represent the percentage area of the marker, divided by the nuclear area stained with DAPI area. (C) Boxplot showing H-scores of MMP9 and CD45 across the tissue types. The Kruskal–Wallis test was used for analysis followed by Mann–Whitney U test for pairwise comparisons. (D) Scatterplot showing the correlation between MMP9 area and MMP9 intensity for overall samples. Spearman’s correlation area was performed. Color gradient is based on the degree of immune cell infiltration as evidenced by CD45 percent area. NAT: non-cancer adjacent tissue.
Figure 9
Figure 9
miRNA–gene interaction analysis. (A) MMP9 sequence at the 3′ untranslated region. (B) mature miRNA sequence. (C) Predicted regions of complement base pair between MMP9 and hsa-miR-145. Data source mirTarBase database. (D) Predicted functional effect of upregulation of MMP9 and downregulation of miR-145 in humans. Data source: Ingenuity Pathway Analysis version 01-22-01.
Figure 10
Figure 10
The quantitative relationships between MMP9 and miR-145 and immune cells in thyroid tissues (the data derived from the microarray dataset GSE138198 [29]). t-SNE: t-distributed stochastic neighbor embedding, an unsupervised non-linear dimensionality reduction technique for data exploration and visualizing high-dimensional data. The data presentation relate to single-cell RNA seq; each colored dot cluster represents the subtype of immune, stromal, and epithelial cell populations.
Figure 11
Figure 11
Meta-analysis on the tissue and circulatory MMP9 levels in thyroid tumors. (A) Pooled analysis of MMP9 expression level in tissues of PTC patients. (B) Network meta-analysis comparing the circulatory level of MMP9 in patients with malignant and benign thyroid diseases and healthy controls [21,61,62,63,64,65,66,67,68,69,70,71,72,73,74,75,76].

Similar articles

Cited by

References

    1. Sung H., Ferlay J., Siegel R.L., Laversanne M., Soerjomataram I., Jemal A., Bray F. Global Cancer Statistics 2020: GLOBOCAN Estimates of Incidence and Mortality Worldwide for 36 Cancers in 185 Countries. CA Cancer J. Clin. 2021;71:209–249. doi: 10.3322/caac.21660. - DOI - PubMed
    1. Zhai M., Zhang D., Long J., Gong Y., Ye F., Liu S., Li Y. The global burden of thyroid cancer and its attributable risk factor in 195 countries and territories: A systematic analysis for the Global Burden of Disease Study. Cancer Med. 2021;10:4542–4554. doi: 10.1002/cam4.3970. - DOI - PMC - PubMed
    1. Nylen C., Mechera R., Marechal-Ross I., Tsang V., Chou A., Gill A.J., Clifton-Bligh R.J., Robinson B.G., Sywak M.S., Sidhu S.B., et al. Molecular Markers Guiding Thyroid Cancer Management. Cancers. 2020;12:2164. doi: 10.3390/cancers12082164. - DOI - PMC - PubMed
    1. Issa P.P., Omar M., Buti Y., Issa C.P., Chabot B., Carnabatu C.J., Munshi R., Hussein M., Aboueisha M., Shama M., et al. Hashimoto’s Thyroiditis Minimizes Lymph Node Metastasis in BRAF Mutant Papillary Thyroid Carcinomas. Biomedicines. 2022;10:2051. doi: 10.3390/biomedicines10082051. - DOI - PMC - PubMed
    1. Osborne D., Choudhary R., Vyas A., Kampa P., Abbas L.F., Chigurupati H.D., Alfonso M. Hashimoto’s Thyroiditis Effects on Papillary Thyroid Carcinoma Outcomes: A Systematic Review. Cureus. 2022;14:e28054. doi: 10.7759/cureus.28054. - DOI - PMC - PubMed