

Intercellular Molecular Crosstalk Networks within Invasive and Immunosuppressive Tumor Microenvironment Subtypes Associated with Clinical Outcomes in Four Cancer Types
- PMID: 38002057
- PMCID: PMC10669098
- DOI: 10.3390/biomedicines11113057
Intercellular Molecular Crosstalk Networks within Invasive and Immunosuppressive Tumor Microenvironment Subtypes Associated with Clinical Outcomes in Four Cancer Types
Abstract
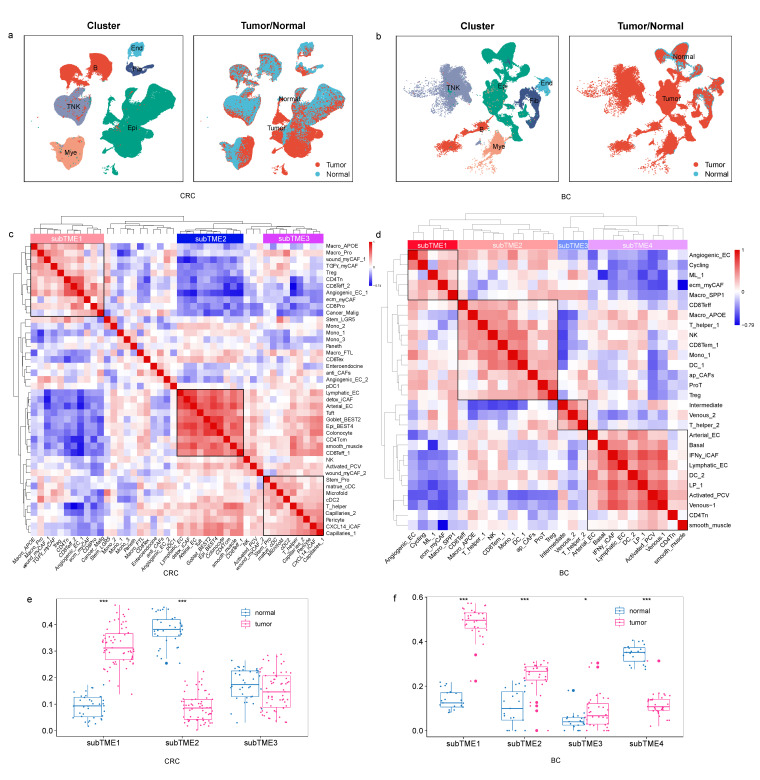
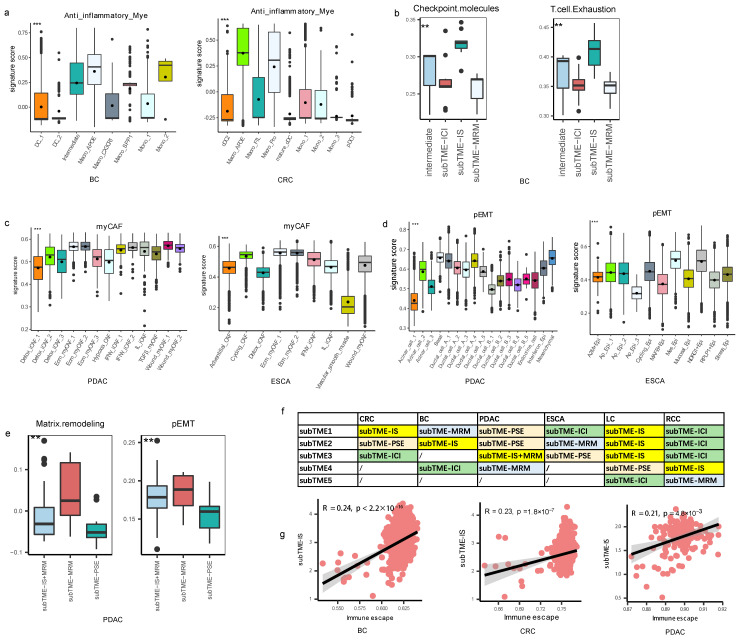
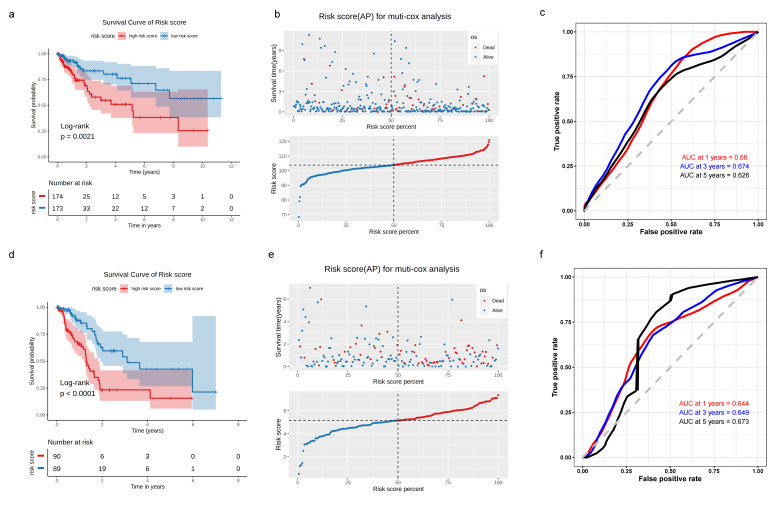
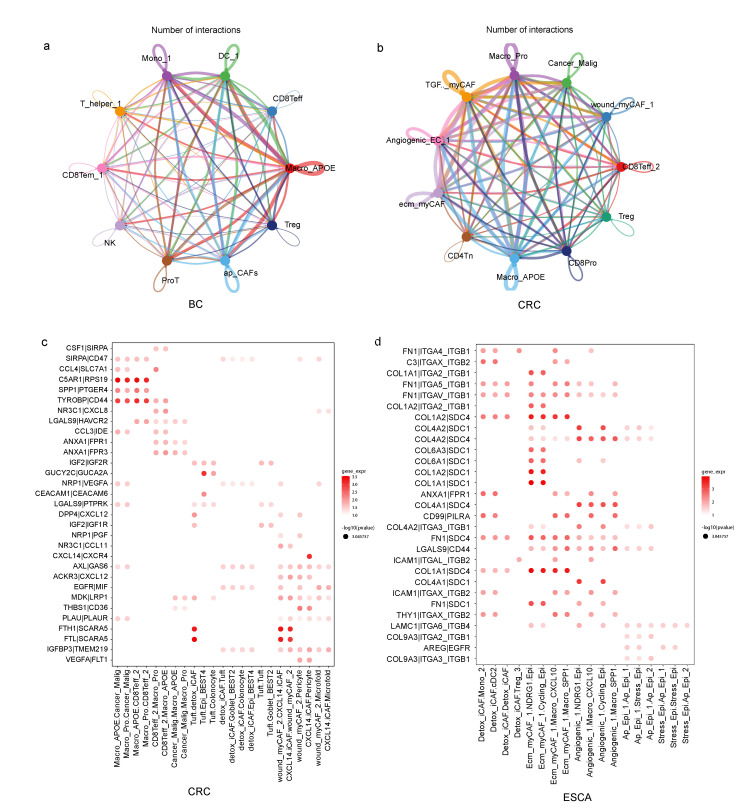
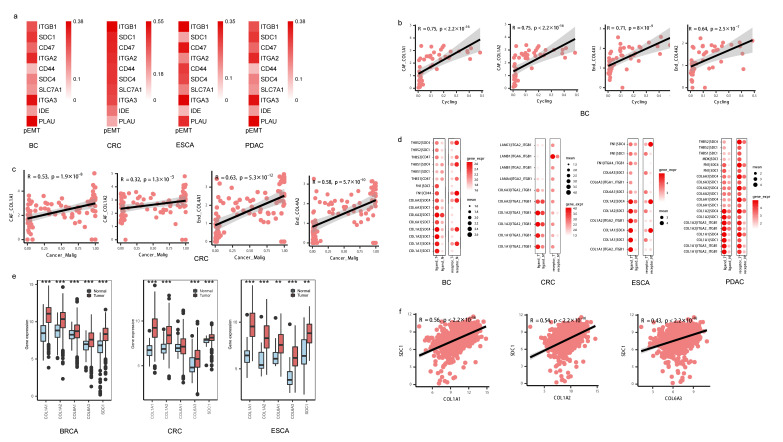
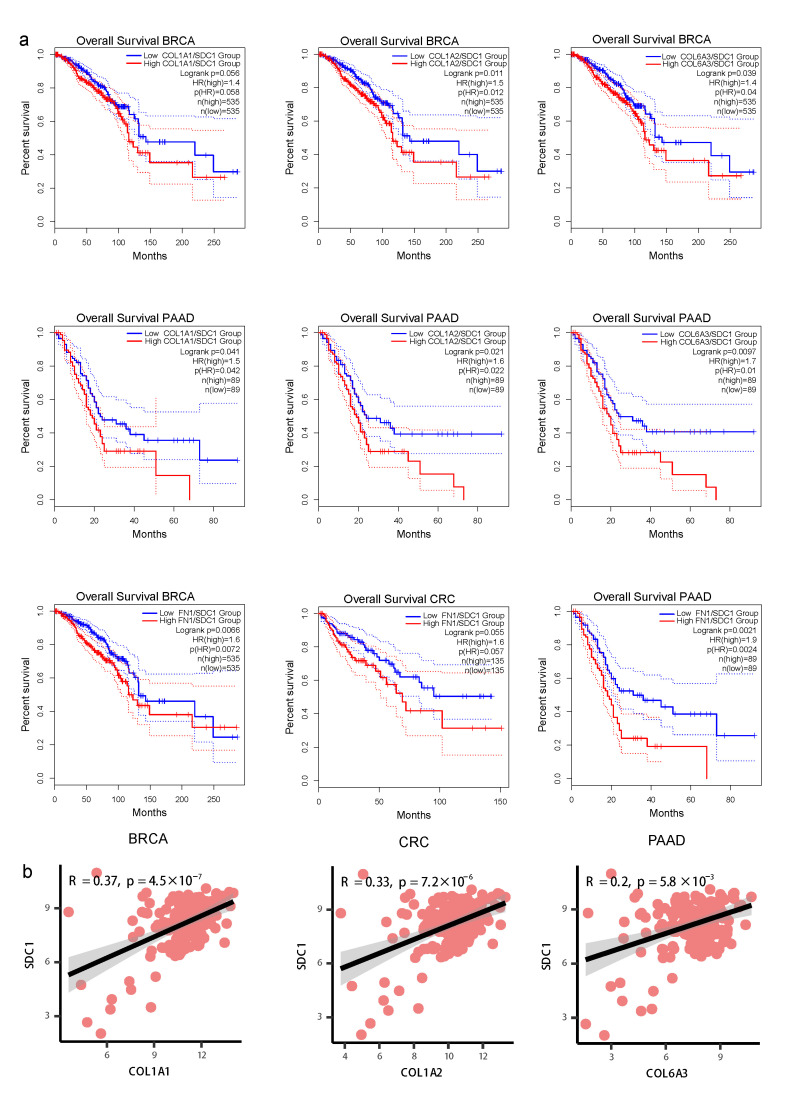
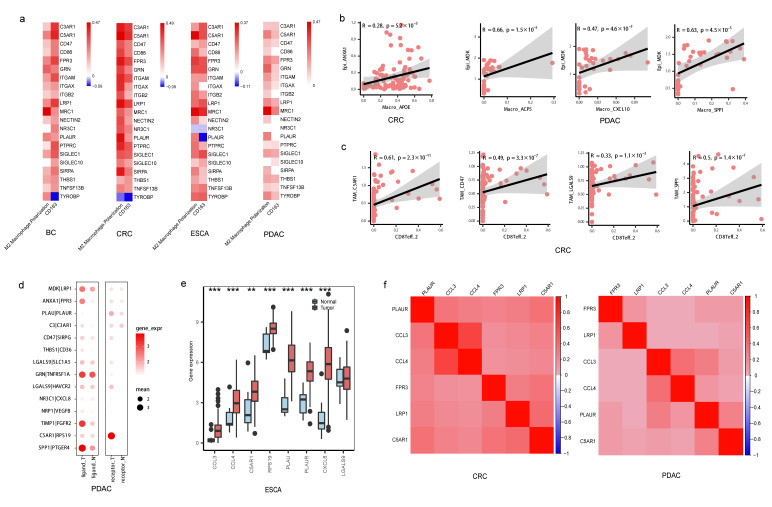
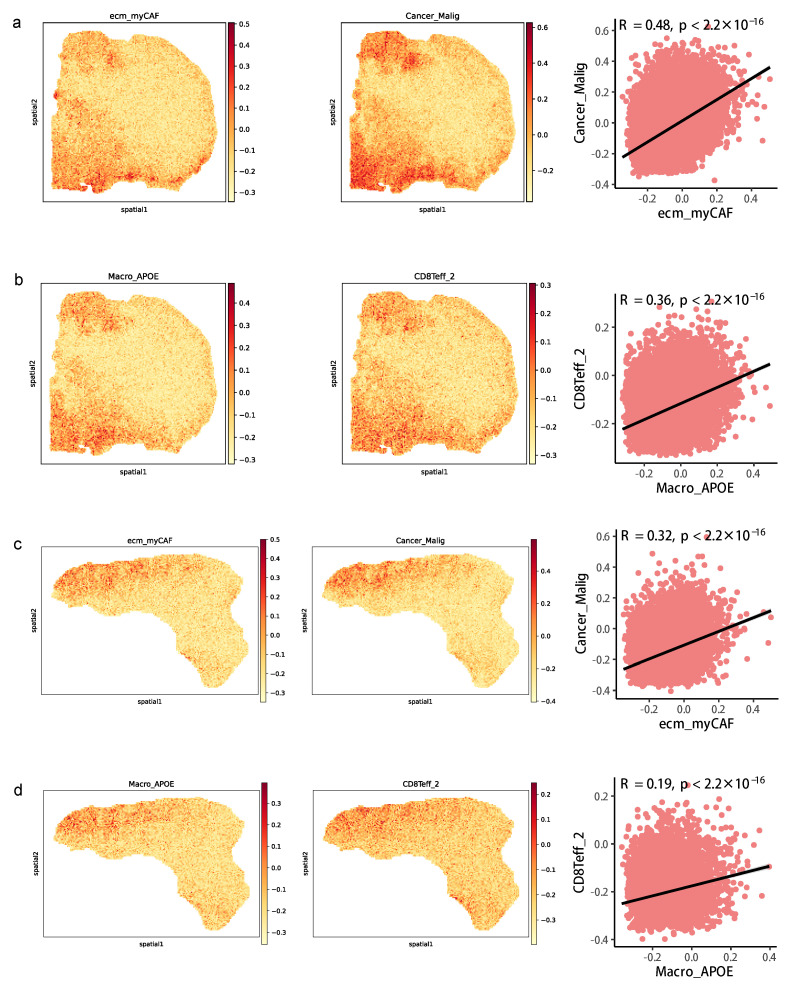
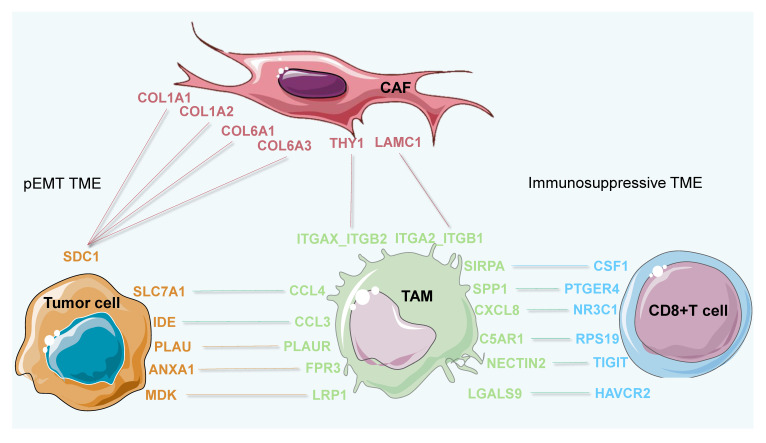
Heterogeneity is a critical basis for understanding how the tumor microenvironment (TME) contributes to tumor progression. However, an understanding of the specific characteristics and functions of TME subtypes (subTMEs) in the progression of cancer is required for further investigations into single-cell resolutions. Here, we analyzed single-cell RNA sequencing data of 250 clinical samples with more than 200,000 cells analyzed in each cancer datum. Based on the construction of an intercellular infiltration model and unsupervised clustering analysis, four, three, three, and four subTMEs were revealed in breast, colorectal, esophageal, and pancreatic cancer, respectively. Among the subTMEs, the immune-suppressive subTME (subTME-IS) and matrix remodeling with malignant cells subTME (subTME-MRM) were highly enriched in tumors, whereas the immune cell infiltration subTME (subTME-ICI) and precancerous state of epithelial cells subTME (subTME-PSE) were less in tumors, compared with paracancerous tissues. We detected and compared genes encoding cytokines, chemokines, cytotoxic mediators, PD1, and PD-L1. The results showed that these genes were specifically overexpressed in different cell types, and, compared with normal tissues, they were upregulated in tumor-derived cells. In addition, compared with other subTMEs, the expression levels of PDCD1 and TGFB1 were higher in subTME-IS. The Cox proportional risk regression model was further constructed to identify possible prognostic markers in each subTME across four cancer types. Cell-cell interaction analysis revealed the distinguishing features in molecular pairs among different subTMEs. Notably, ligand-receptor gene pairs, including COL1A1-SDC1, COL6A2-SDC1, COL6A3-SDC1, and COL4A1-ITGA2 between stromal and tumor cells, associated with tumor invasion phenotypes, poor patient prognoses, and tumor advanced progression, were revealed in subTME-MRM. C5AR1-RPS19, LGALS9-HAVCR2, and SPP1-PTGER4 between macrophages and CD8+ T cells, associated with CD8+ T-cell dysfunction, immunosuppressive status, and tumor advanced progression, were revealed in subTME-IS. The spatial co-location information of cellular and molecular interactions was further verified by spatial transcriptome data from colorectal cancer clinical samples. Overall, our study revealed the heterogeneity within the TME, highlighting the potential pro-invasion and pro-immunosuppressive functions and cellular infiltration characteristics of specific subTMEs, and also identified the key cellular and molecular interactions that might be associated with the survival, invasion, immune escape, and classification of cancer patients across four cancer types.
Keywords: C5AR1-RPS19; COL1A1-SDC1; COL6A3-SDC1; LGALS9-HAVCR2; SPP1-PTGER4; cell-cell interaction; immunosuppressive; single-cell RNA-seq; tumor invasion; tumor microenvironment subtypes.
Conflict of interest statement
The authors declare no conflict of interest.
Figures
Similar articles
-
Integration of single-cell RNA sequencing and bulk RNA transcriptome sequencing reveals a heterogeneous immune landscape and pivotal cell subpopulations associated with colorectal cancer prognosis.Front Immunol. 2023 Aug 22;14:1184167. doi: 10.3389/fimmu.2023.1184167. eCollection 2023. Front Immunol. 2023. PMID: 37675100 Free PMC article.
-
Multiphasic Heterogeneity of Fibroblasts in the Microenvironment of Pancreatic Ductal Adenocarcinoma: Dissection and the Sum of the Dynamics.Cancers (Basel). 2022 Oct 5;14(19):4880. doi: 10.3390/cancers14194880. Cancers (Basel). 2022. PMID: 36230803 Free PMC article.
-
Spatially confined sub-tumor microenvironments in pancreatic cancer.Cell. 2021 Oct 28;184(22):5577-5592.e18. doi: 10.1016/j.cell.2021.09.022. Epub 2021 Oct 12. Cell. 2021. PMID: 34644529
-
Mathematical models of intercellular signaling in breast cancer.Semin Cancer Biol. 2025 Feb;109:91-100. doi: 10.1016/j.semcancer.2025.01.005. Epub 2025 Jan 29. Semin Cancer Biol. 2025. PMID: 39890041 Review.
-
Co-dependencies in the tumor immune microenvironment.Oncogene. 2022 Jul;41(31):3821-3829. doi: 10.1038/s41388-022-02406-7. Epub 2022 Jul 11. Oncogene. 2022. PMID: 35817840 Free PMC article. Review.
Cited by
-
The immune duality of osteopontin and its therapeutic implications for kidney transplantation.Front Immunol. 2025 Feb 28;16:1520777. doi: 10.3389/fimmu.2025.1520777. eCollection 2025. Front Immunol. 2025. PMID: 40093009 Free PMC article. Review.
-
A comprehensive characterization of metabolic signatures-hypoxia, glycolysis, and lactylation-in non-healing diabetic foot ulcers.Front Mol Biosci. 2025 Jul 9;12:1593390. doi: 10.3389/fmolb.2025.1593390. eCollection 2025. Front Mol Biosci. 2025. PMID: 40703704 Free PMC article.
-
A novel identified epithelial ligand-receptor-associated gene signature highlights POPDC3 as a potential therapy target for non-small cell lung cancer.Cell Death Dis. 2025 Feb 19;16(1):114. doi: 10.1038/s41419-025-07410-9. Cell Death Dis. 2025. PMID: 39971925 Free PMC article.
-
Integrating spatial and single-cell transcriptomics reveals tumor heterogeneity and intercellular networks in colorectal cancer.Cell Death Dis. 2024 May 10;15(5):326. doi: 10.1038/s41419-024-06598-6. Cell Death Dis. 2024. PMID: 38729966 Free PMC article.
References
-
- Barkley D., Moncada R., Pour M., Liberman D.A., Dryg I., Werba G., Wang W., Baron M., Rao A., Xia B., et al. Cancer cell states recur across tumor types and form specific interactions with the tumor microenvironment. Nat. Genet. 2022;54:1192–1201. doi: 10.1038/s41588-022-01141-9. - DOI - PMC - PubMed
Grants and funding
LinkOut - more resources
Full Text Sources
Research Materials
Miscellaneous
