. 2023 Nov 16;11(11):3066.
doi: 10.3390/biomedicines11113066.

The Combination of Radiation with PARP Inhibition Enhances Senescence and Sensitivity to the Senolytic, Navitoclax, in Triple Negative Breast Tumor Cells

Affiliations

The Combination of Radiation with PARP Inhibition Enhances Senescence and Sensitivity to the Senolytic, Navitoclax, in Triple Negative Breast Tumor Cells

Abrar Softah et al. Biomedicines. .

Abstract

Despite significant advances in the treatment of triple-negative breast cancer, this disease continues to pose a clinical challenge, with many patients ultimately suffering from relapse. Tumor cells that recover after entering into a state of senescence after chemotherapy or radiation have been shown to develop a more aggressive phenotype, and to contribute to disease recurrence. By combining the PARP inhibitor (PARPi), talazoparib, with radiation, senescence was enhanced in 4T1 and MDA-MB-231 triple-negative breast cancer cell lines (based on SA-β-gal upregulation, increased expression of CDKN1A and the senescence-associated secretory phenotype (SASP) marker, IL6). Subsequent treatment of the radiation- and talazoparib-induced senescent 4T1 and MDA-MB231 cells with navitoclax (ABT-263) resulted in significant apoptotic cell death. In immunocompetent tumor-bearing mice, navitoclax exerted a modest growth inhibitory effect when used alone, but dramatically interfered with the recovery of 4T1-derived tumors induced into senescence with ionizing radiation and talazoparib. These findings support the potential utility of a senolytic strategy in combination with the radiotherapy/PARPi combination to mitigate the risk of disease recurrence in triple-negative breast cancer.

Keywords: PARP inhibitors; apoptosis; breast cancer; radiotherapy; senescence; senolytics.


Conflict of interest statement

The authors declare no conflict of interest. The funders had no role in the design of the study; in the collection, analyses, or interpretation of data; in the writing of the manuscript; or in the decision to publish the results.

Figures
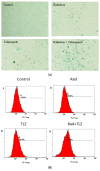
Figure 1
Figure 1
Pre-treatment with PARP inhibitors induces robust senescence in irradiated MDA-MB-231 and 4T1 breast cancer cells. β-galactosidase upregulation was monitored in MDA-MB-231 and 4T1 breast cancer cells to evaluate senescence markers post-radiation (6 Gy). (a,d) Images show high expression of β-galactosidase in both cell lines when exposed to radiation post-PARP inhibition. (b,e) illustrate representative flow cytometry charts of senescent cell percentage using C12FDG staining. A shows the gated C12FDG-postive cells that were considered senescent cells. (c,f) Evaluation of senescence in both cell lines using flow cytometry with C12FDG. Values are expressed as mean ± SEM. * p < 0.05, ** p < 0.01, *** p < 0.001, and **** p < 0.0001 indicate statistical significance between treatment groups (one-way ANOVA followed by Tukey’s post-hoc test; n (number of independent experiments) = 3).
Figure 1
Figure 1
Pre-treatment with PARP inhibitors induces robust senescence in irradiated MDA-MB-231 and 4T1 breast cancer cells. β-galactosidase upregulation was monitored in MDA-MB-231 and 4T1 breast cancer cells to evaluate senescence markers post-radiation (6 Gy). (a,d) Images show high expression of β-galactosidase in both cell lines when exposed to radiation post-PARP inhibition. (b,e) illustrate representative flow cytometry charts of senescent cell percentage using C12FDG staining. A shows the gated C12FDG-postive cells that were considered senescent cells. (c,f) Evaluation of senescence in both cell lines using flow cytometry with C12FDG. Values are expressed as mean ± SEM. * p < 0.05, ** p < 0.01, *** p < 0.001, and **** p < 0.0001 indicate statistical significance between treatment groups (one-way ANOVA followed by Tukey’s post-hoc test; n (number of independent experiments) = 3).
Figure 2
Figure 2
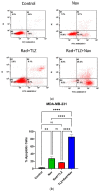
Addition of navitoclax to radiation and PARP inhibitor promotes apoptosis in MDA-MB-231 and 4T1 breast cancer cells. Both cell lines were treated with navitoclax, radiation and talazoparib, and radiation and talazoparib followed by navitoclax. Cell apoptosis was examined based on Annexin V/PI staining using flow cytometry. Four subpopulations have been detected, A1: dead cells (annexin V−/PI+), A2: late apoptotic cells (annexin V+/PI+), A3: viable cells (annexin V−/PI−), A4: early apoptotic cells (annexin V+/PI−). Percentages of apoptotic cell subpopulations were computed, including both early and late apoptotic cells. Panels (a,b) show apoptosis profile in the MDA-MB-231 cell line. Panels (c,d) represent apoptosis profile in the 4T1 cell line. Values are expressed as mean ± SEM. * p < 0.05, ** p < 0.01, and **** p < 0.0001 indicate statistical significance between treatment groups (one-way ANOVA followed by Tukey’s post-hoc test; n (number of independent experiments) = 3).
Figure 2
Figure 2
Addition of navitoclax to radiation and PARP inhibitor promotes apoptosis in MDA-MB-231 and 4T1 breast cancer cells. Both cell lines were treated with navitoclax, radiation and talazoparib, and radiation and talazoparib followed by navitoclax. Cell apoptosis was examined based on Annexin V/PI staining using flow cytometry. Four subpopulations have been detected, A1: dead cells (annexin V−/PI+), A2: late apoptotic cells (annexin V+/PI+), A3: viable cells (annexin V−/PI−), A4: early apoptotic cells (annexin V+/PI−). Percentages of apoptotic cell subpopulations were computed, including both early and late apoptotic cells. Panels (a,b) show apoptosis profile in the MDA-MB-231 cell line. Panels (c,d) represent apoptosis profile in the 4T1 cell line. Values are expressed as mean ± SEM. * p < 0.05, ** p < 0.01, and **** p < 0.0001 indicate statistical significance between treatment groups (one-way ANOVA followed by Tukey’s post-hoc test; n (number of independent experiments) = 3).
Figure 3
Figure 3
Determination of gene expression of apoptosis and senescence genes in 4T1 breast cancer cells. Isolated RNAs of four treatment groups were assessed for TP53, CDKN1A, IL6, and CASP3 expression for 4T1 cell line. (a) Shows data for the expression of TP53, (b) shows data for the expression of CDKN1A, (c) shows data for the expression of IL6, and (d) shows data for the expression of CASP3. Values are expressed as mean ± SEM. * p < 0.05, ** p < 0.01, *** p < 0.001, and **** p < 0.0001 indicate statistical significance between treatment groups (one-way ANOVA followed by Tukey’s post-hoc test; n (number of independent experiments) = 3).
Figure 3
Figure 3
Determination of gene expression of apoptosis and senescence genes in 4T1 breast cancer cells. Isolated RNAs of four treatment groups were assessed for TP53, CDKN1A, IL6, and CASP3 expression for 4T1 cell line. (a) Shows data for the expression of TP53, (b) shows data for the expression of CDKN1A, (c) shows data for the expression of IL6, and (d) shows data for the expression of CASP3. Values are expressed as mean ± SEM. * p < 0.05, ** p < 0.01, *** p < 0.001, and **** p < 0.0001 indicate statistical significance between treatment groups (one-way ANOVA followed by Tukey’s post-hoc test; n (number of independent experiments) = 3).
Figure 4
Figure 4
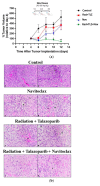
Assessment of senolytic effect of navitoclax in 4T1 breast cancer cells following radiation and talazoparib in mice. 4T1 cells were exposed to 6 Gy following 1 µM talazoparib at in vitro settings to induce senescence; then cells were implanted into Balb/c mice. The mice were then treated with navitoclax 50 mg/kg (p.o.) every other day for 7 days (four doses). (a) Growth curves for untreated tumor cells (left panel) and irradiated PARPi cells (right panel) with or without navitoclax. (b) Histopathological screening of tumor samples using H&E staining (H&E-400×). Photomicrographs of untreated tumor, radiation plus talazoparib, navitoclax alone, and radiation plus talazoparib followed by navitoclax are displayed. (A) Loose tumor cells, (V) blood vessels, (B) inflammatory cells inside the tumor, (H) hemorrhage, (N) necrotic areas, (E) edema, and (S) stroma as indicated in the images. (c) TUNEL images of the in vivo tissue samples. * p < 0.05 and ** p < 0.01, indicate statistical significance between treatment groups (one-way ANOVA followed by Tukey’s post-hoc test; n (number of mice in each experimental group) = 6).
Figure 4
Figure 4
Assessment of senolytic effect of navitoclax in 4T1 breast cancer cells following radiation and talazoparib in mice. 4T1 cells were exposed to 6 Gy following 1 µM talazoparib at in vitro settings to induce senescence; then cells were implanted into Balb/c mice. The mice were then treated with navitoclax 50 mg/kg (p.o.) every other day for 7 days (four doses). (a) Growth curves for untreated tumor cells (left panel) and irradiated PARPi cells (right panel) with or without navitoclax. (b) Histopathological screening of tumor samples using H&E staining (H&E-400×). Photomicrographs of untreated tumor, radiation plus talazoparib, navitoclax alone, and radiation plus talazoparib followed by navitoclax are displayed. (A) Loose tumor cells, (V) blood vessels, (B) inflammatory cells inside the tumor, (H) hemorrhage, (N) necrotic areas, (E) edema, and (S) stroma as indicated in the images. (c) TUNEL images of the in vivo tissue samples. * p < 0.05 and ** p < 0.01, indicate statistical significance between treatment groups (one-way ANOVA followed by Tukey’s post-hoc test; n (number of mice in each experimental group) = 6).

References

    1. Xu Y., Gong M., Wang Y., Yang Y., Liu S., Zeng Q. Global Trends and Forecasts of Breast Cancer Incidence and Deaths. Sci. Data. 2023;10:334. doi: 10.1038/s41597-023-02253-5. - DOI - PMC - PubMed
    1. Sung H., Ferlay J., Siegel R.L., Laversanne M., Soerjomataram I., Jemal A., Bray F. Global Cancer Statistics 2020: GLOBOCAN Estimates of Incidence and Mortality Worldwide for 36 Cancers in 185 Countries. CA Cancer J. Clin. 2021;71:209–249. doi: 10.3322/caac.21660. - DOI - PubMed
    1. Dyba T., Randi G., Bray F., Martos C., Giusti F., Nicholson N., Gavin A., Flego M., Neamtiu L., Dimitrova N., et al. The European Cancer Burden in 2020: Incidence and Mortality Estimates for 40 Countries and 25 Major Cancers. Eur. J. Cancer. 2021;157:308–347. doi: 10.1016/j.ejca.2021.07.039. - DOI - PMC - PubMed
    1. Siegel R.L., Miller K.D., Wagle N.S., Jemal A. Cancer Statistics, 2023. CA A Cancer J. Clin. 2023;73:17–48. doi: 10.3322/caac.21763. - DOI - PubMed
    1. Ramos P., Bentires-Alj M. Mechanism-Based Cancer Therapy: Resistance to Therapy, Therapy for Resistance. Oncogene. 2014;34:3617–3626. doi: 10.1038/onc.2014.314. - DOI - PubMed

LinkOut - more resources