. 2023 Oct 26;13(11):1575.
doi: 10.3390/biom13111575.

8-Hydroxydaidzein Induces Apoptosis and Inhibits AML-Associated Gene Expression in U-937 Cells: Potential Phytochemical for AML Treatment

Affiliations

8-Hydroxydaidzein Induces Apoptosis and Inhibits AML-Associated Gene Expression in U-937 Cells: Potential Phytochemical for AML Treatment

Pei-Shan Wu et al. Biomolecules. .

Abstract

Background: 8-hydroxydaidzein (8-OHD) is a compound derived from daidzein, known for its anti-inflammatory and anti-proliferative properties in K562 human chronic myeloid leukemia (CML) cells. However, its effects on acute myeloid leukemia (AML) cells have not been fully understood.

Method: To investigate its potential anti-AML mechanism, we employed an integrated in vitro-in silico approach.

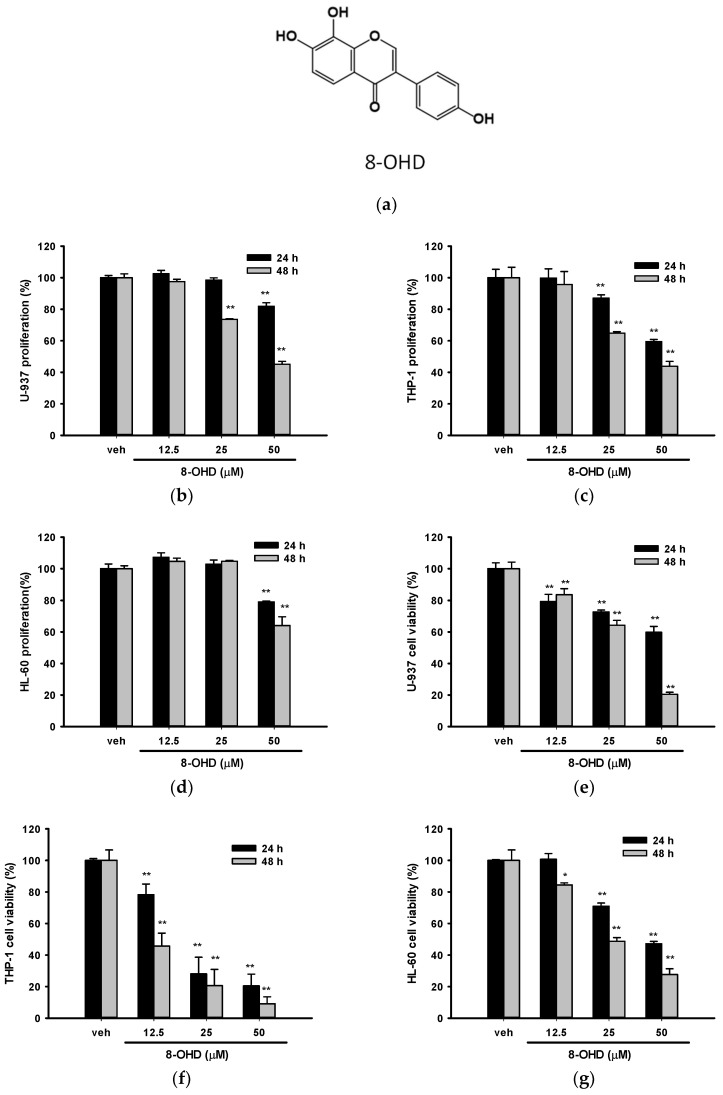
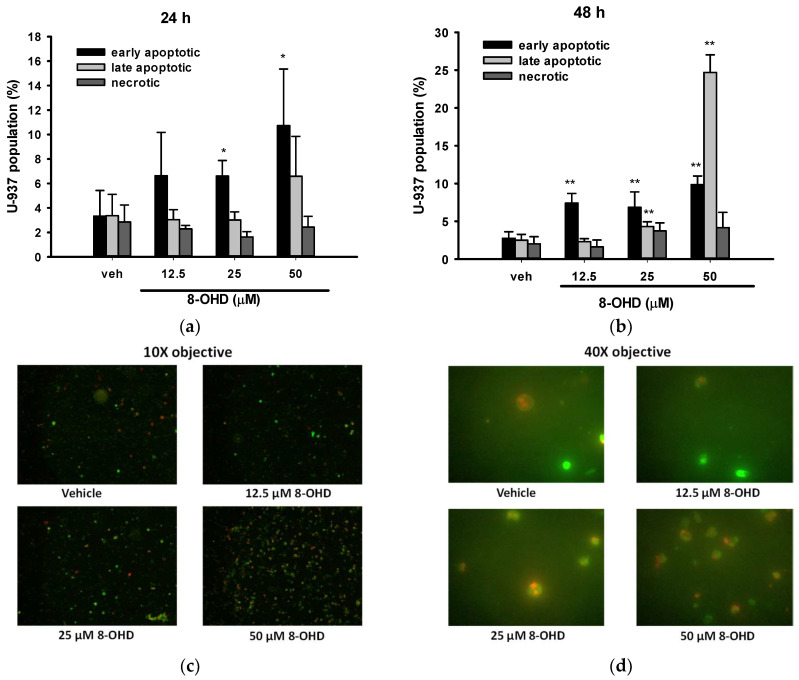
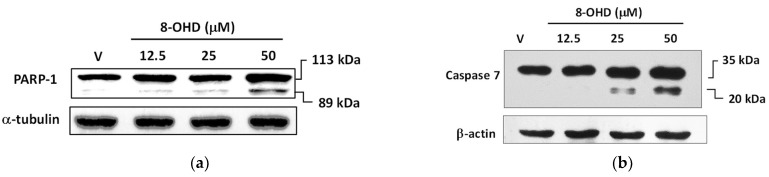
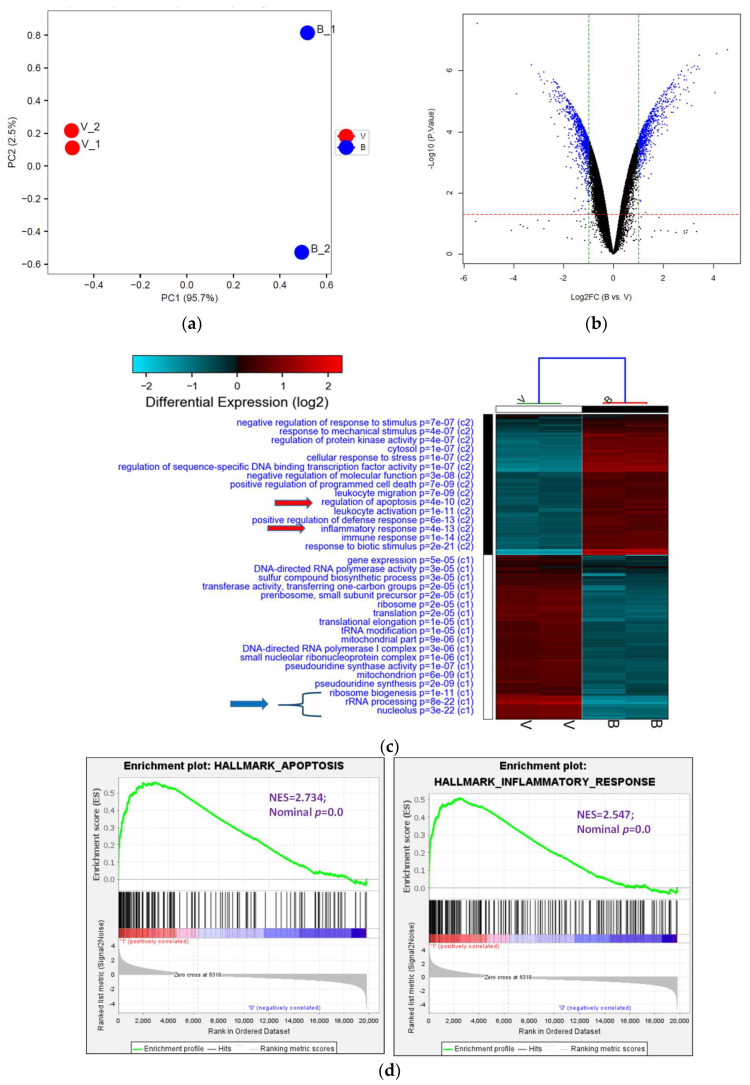
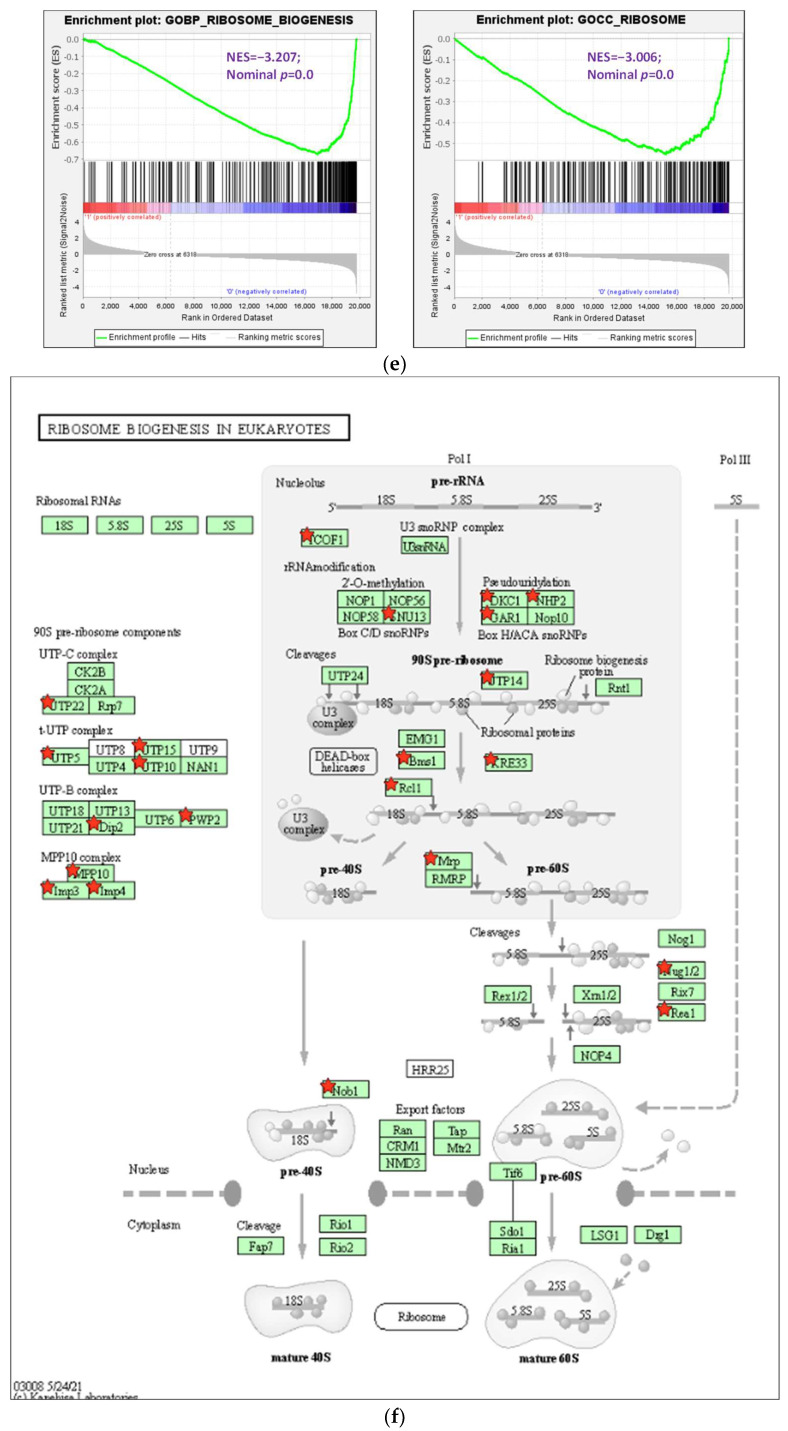
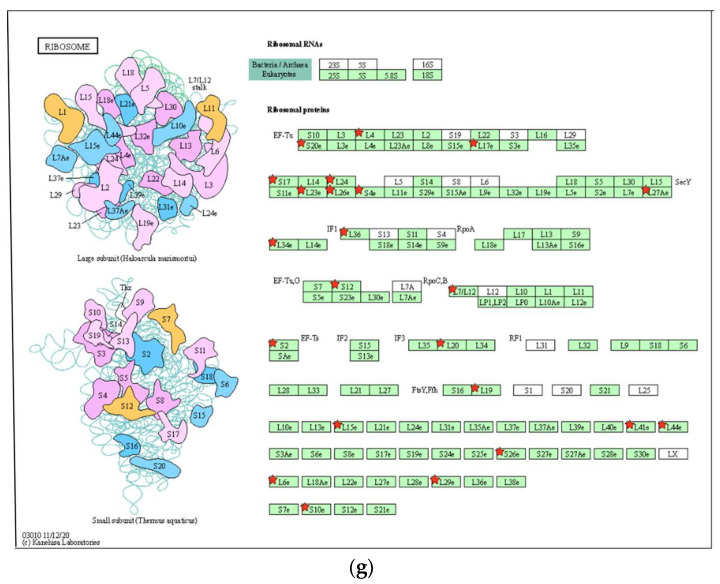
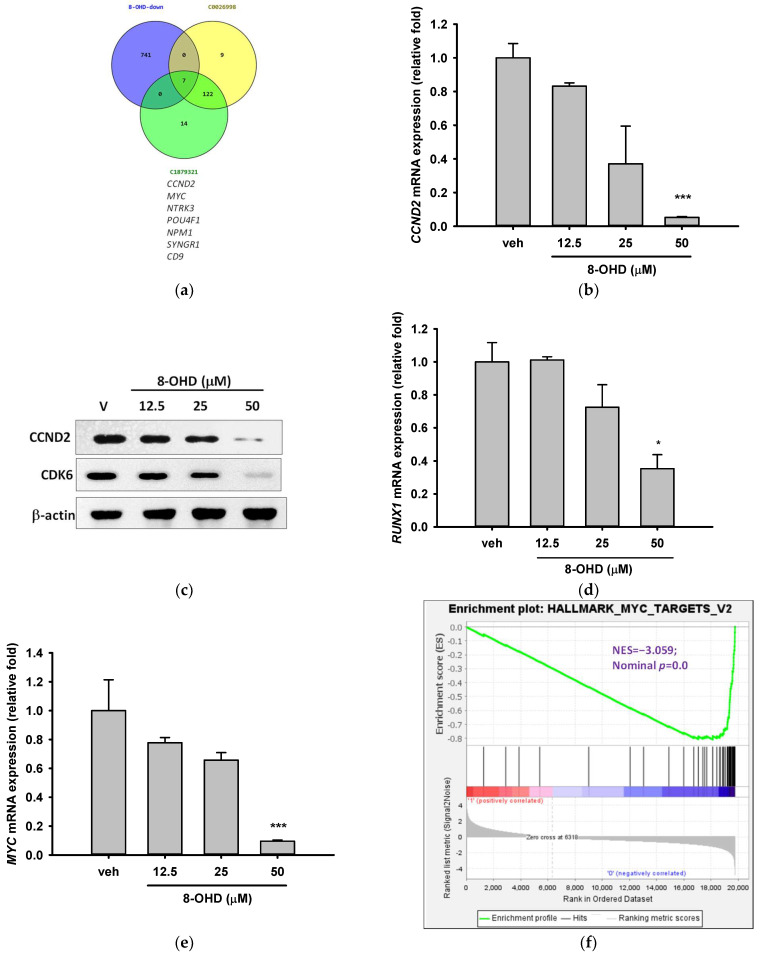
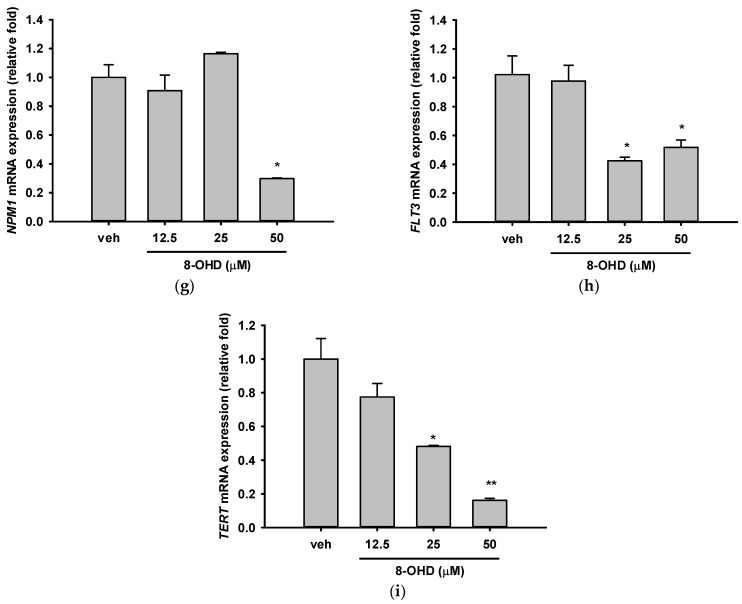
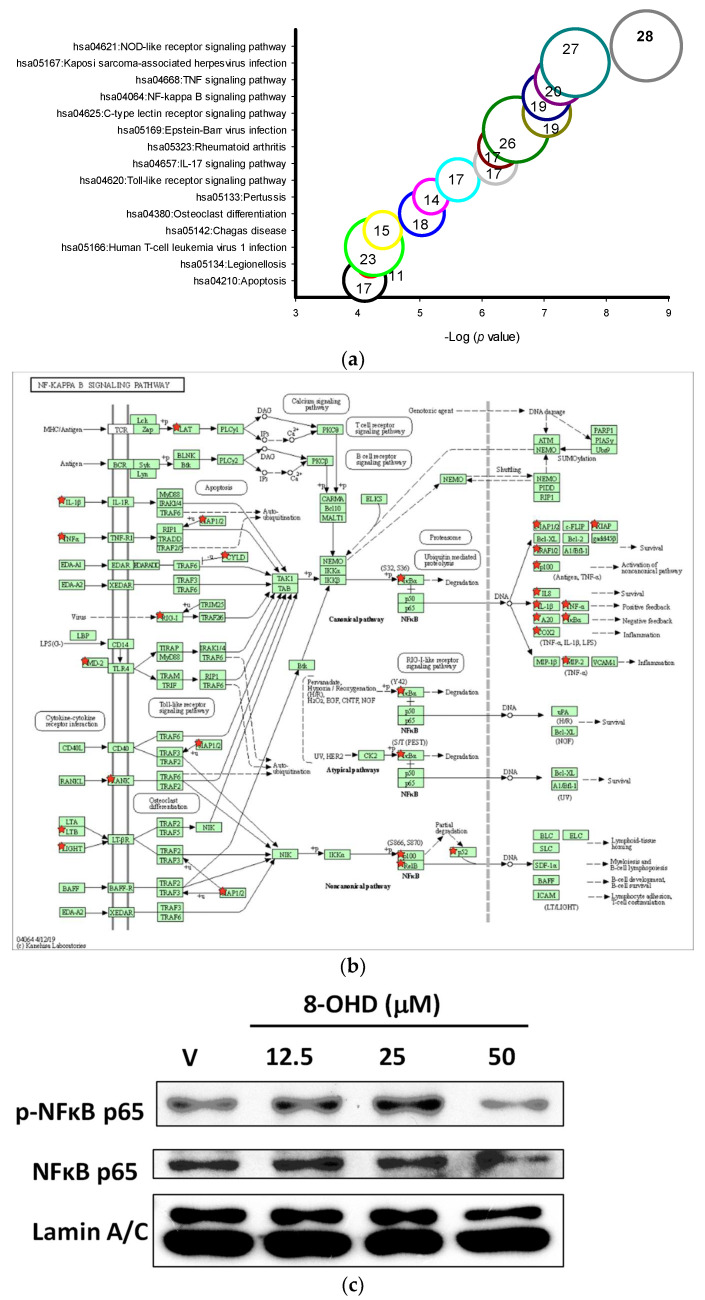
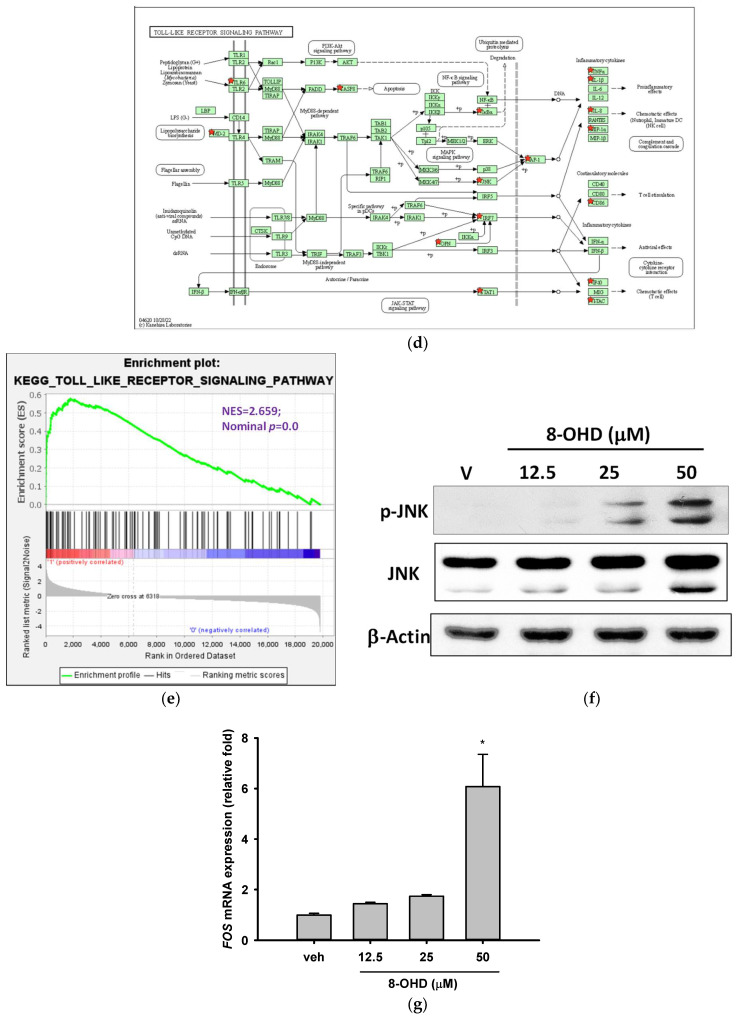
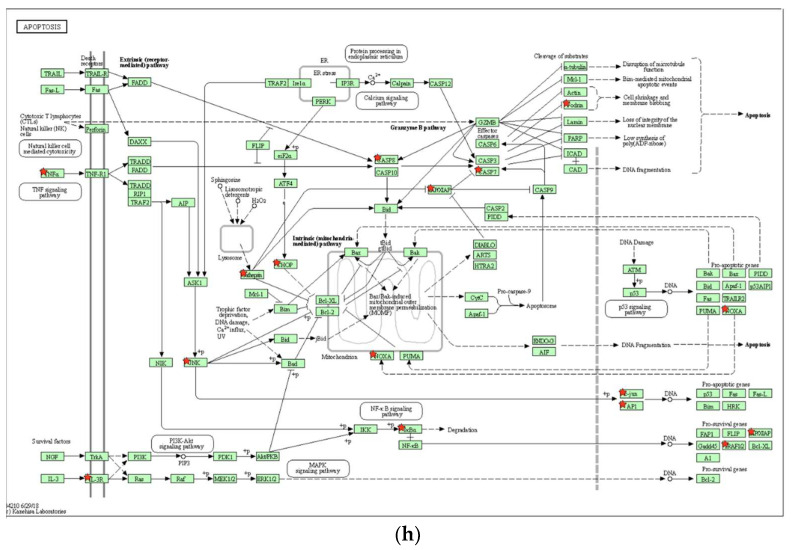
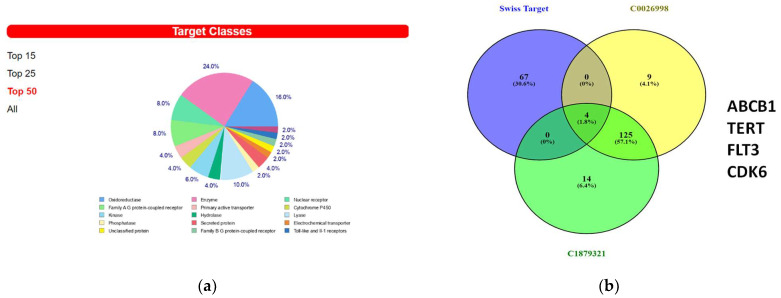
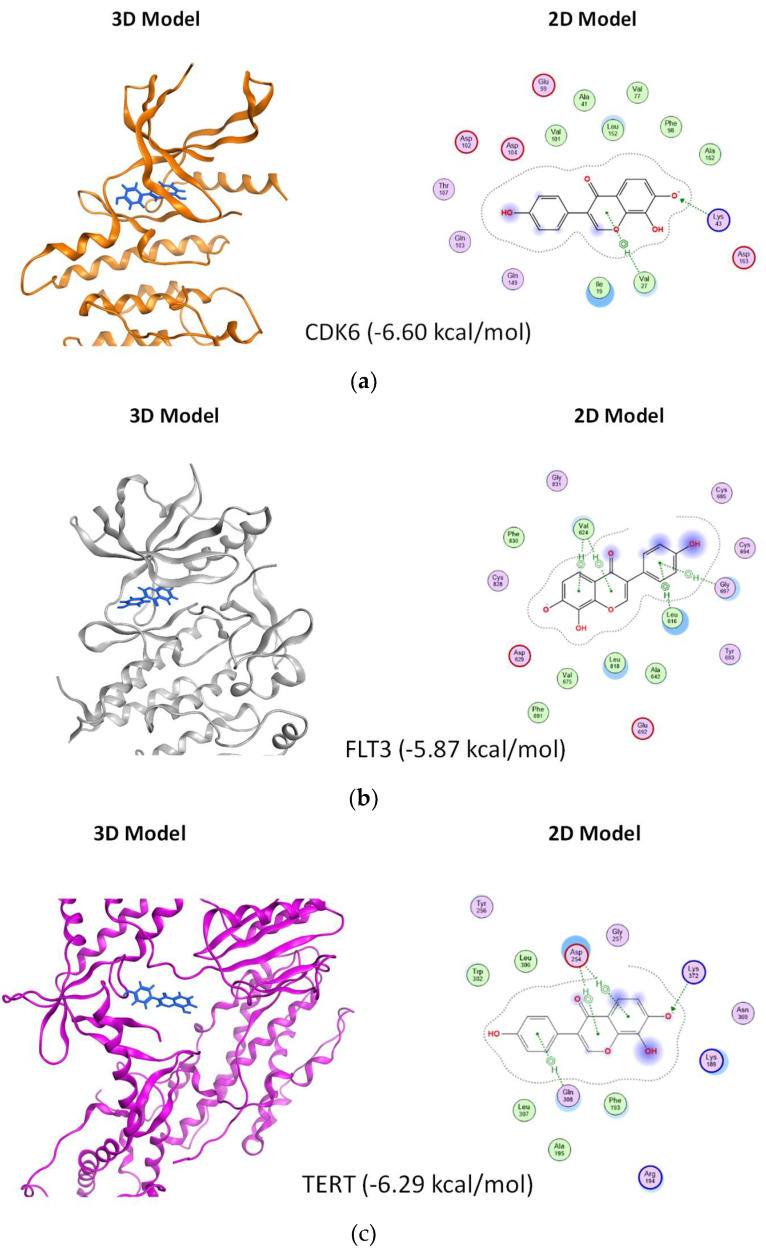
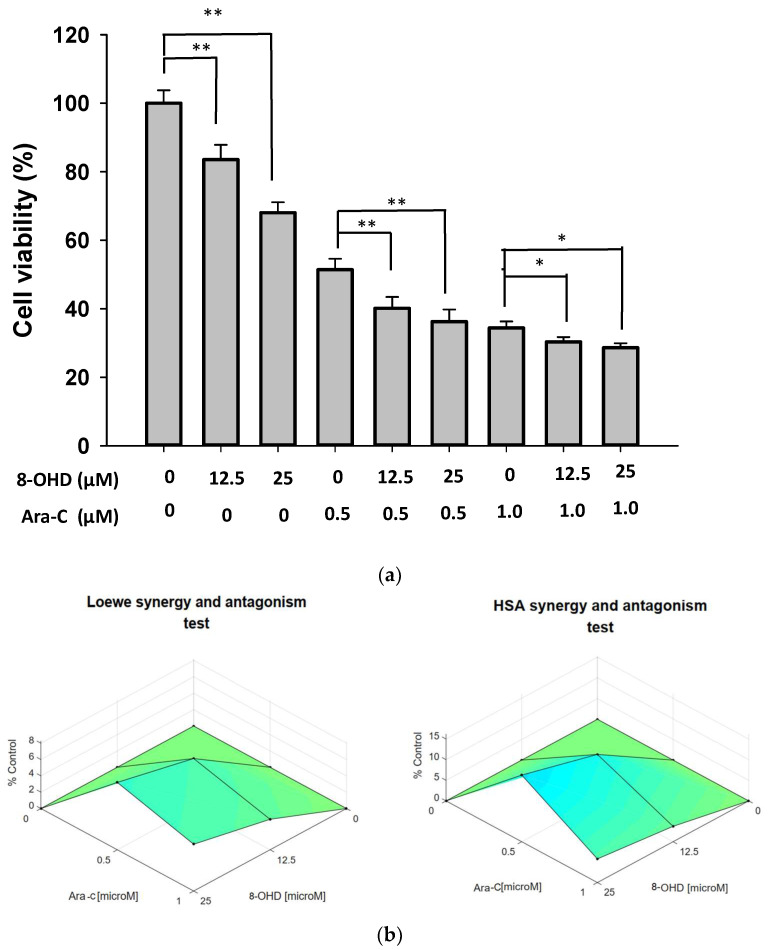
Results: Our findings demonstrate that 8-OHD suppresses the expression of CDK6 and CCND2 proteins and induces cell apoptosis in U-937 cells by activating Caspase-7 and cleaving PARP-1. Microarray analysis revealed that 8-OHD downregulates differentially expressed genes (DEGs) associated with rRNA processing and ribosome biogenesis pathways. Moreover, AML-target genes, including CCND2, MYC, NPM1, FLT3, and TERT, were downregulated by 8-OHD. Additionally, molecular docking software predicted that 8-OHD has the potential to interact with CDK6, FLT3, and TERT proteins, thereby reducing their activity and inhibiting cell proliferation. Notably, we discovered a synergic pharmacological interaction between 8-OHD and cytarabine (Ara-C).

Conclusions: Overall, this study provides insights into the therapeutic applications of 8-OHD in treating AML and elucidates its underlying mechanisms of action.

Keywords: 8-hydroxydaidzein; CDK6; acute myeloid leukemia; apoptosis; caspase-7.


Conflict of interest statement

The authors declare no conflict of interest.

Figures

Figure 1
Figure 1
Effects of 8-OHD on the cell proliferation and cell viability of U-937, THP-1, and HL-60 cells. (a) Chemical structure of 8-OHD. (bd) U-937, THP-1, and HL-60 cells were treated with vehicle (0.1% DMSO) or 8-OHD (12.5–50 μM) for the indicated period, and cell proliferation was measured using the MTT assay. (eg) Cell viability was examined using the trypan blue exclusion test. The experiments were repeated three times. These data represent the mean ± SD of three independent experiments. * p < 0.05 and ** p < 0.01 represent significant differences compared with the vehicle-treated cells.
Figure 2
Figure 2
Quantitation of early apoptosis, late apoptosis, and necrosis by Annexin V and propidium iodide (PI) stain. U-937 cells were treated with various concentrations of 8-OHD for 24 or 48 h and stained with Annexin V-PI. Images were captured using ×10 and ×40 objectives, and apoptotic cells were identified by direct visualization under a fluorescent microscope. Cells stained for Annexin V are green, cells stained for PI are red, and cells stained for both are yellow under ×10 objective. Annexin V-positive and PI-negative cells are classified as early apoptotic, PI-positive and annexin V-negative cells are denoted as necrotic, and both Annexin V- and PI-positive are symbolized as late apoptotic in a population. (a,b) Quantitation of early apoptosis, late apoptosis, and necrosis after 24 and 48 h treatment with 8-OHD in U-937 cells. These data represent the mean ± SD of five different fields. * p < 0.05 and ** p < 0.01 represent significant differences compared with the vehicle-treated cells. (c,d) Representative merged images of U-937 cells treated with various levels of 8-OHD for 48 h under 10× and 40× objectives.
Figure 3
Figure 3
8-OHD causes poly (ADP-ribose) polymerase-1 (PARP-1) cleavage (a) and caspase-7 activation (b) in U-937 cells dose dependently. Total cell lysates were prepared 24 h after 8-OHD treatment, as described in Materials and Methods.
Figure 4
Figure 4
Analysis of Gene Ontology (GO) terms and Kyoto Encyclopedia of Genes and Genomes (KEGG) pathways of DEGs. (a) PCA plot of variants of two duplicated vehicles (V) and 50 μM 8-OHD (B). (b) The volcano plot of 50 μM 8-OHD (B) versus vehicle (V). Standard selection criteria to identify differentially expressed genes (DEGs) are established at log2 |fold change| > 1 and p < 0.05 (Blue dots in figure). (c) Cluster analysis of DEGs. GO terms listed in the upper half are terms of upregulated DEGs, while lower half are terms of downregulated DEGs. Only some of the representative GO terms are shown. (d) Gene Set Enrichment Analysis (GSEA) demonstrates that the signature “Hallmark apoptosis” and “Hallmark inflammatory response” gene sets are enriched with 8-OHD-upregulated genes. (e) GSEA demonstrates that “GOBP ribosome biogenesis” and “GOCC ribosome” are enriched with 8-OHD-downregulated genes. The barcode plot indicates the position of the genes in each gene set. The horizontal bar in graded color from red to blue indicates up- and down-regulated by 8-OHD. The vertical axis in the lower plot indicates the Ranked List Metric. (f) Kegg pathway—ribosome biogenesis in eukaryotes (hsa03008) (g) Kegg pathway—ribosome (hsa03010). The downregulated DEGs were marked with red stars.
Figure 4
Figure 4
Analysis of Gene Ontology (GO) terms and Kyoto Encyclopedia of Genes and Genomes (KEGG) pathways of DEGs. (a) PCA plot of variants of two duplicated vehicles (V) and 50 μM 8-OHD (B). (b) The volcano plot of 50 μM 8-OHD (B) versus vehicle (V). Standard selection criteria to identify differentially expressed genes (DEGs) are established at log2 |fold change| > 1 and p < 0.05 (Blue dots in figure). (c) Cluster analysis of DEGs. GO terms listed in the upper half are terms of upregulated DEGs, while lower half are terms of downregulated DEGs. Only some of the representative GO terms are shown. (d) Gene Set Enrichment Analysis (GSEA) demonstrates that the signature “Hallmark apoptosis” and “Hallmark inflammatory response” gene sets are enriched with 8-OHD-upregulated genes. (e) GSEA demonstrates that “GOBP ribosome biogenesis” and “GOCC ribosome” are enriched with 8-OHD-downregulated genes. The barcode plot indicates the position of the genes in each gene set. The horizontal bar in graded color from red to blue indicates up- and down-regulated by 8-OHD. The vertical axis in the lower plot indicates the Ranked List Metric. (f) Kegg pathway—ribosome biogenesis in eukaryotes (hsa03008) (g) Kegg pathway—ribosome (hsa03010). The downregulated DEGs were marked with red stars.
Figure 5
Figure 5
AML-related genes were downregulated by 8-OHD. (a) Venn diagram of 8-OHD-downregulated DEGs and gene sets of DisGeNET CUI: C0026998 and CUI: C1879321. The 7 genes in the intersection of three sets are listed below. (b,d,e,gi) mRNA expression of AML-targeted genes was measured using RT-qPCR 24 h after treatment, following the methodology outlined in the Materials and Methods section. * p < 0.05, ** p < 0.01, and *** p < 0.001 represent significant differences compared with the vehicle-treated cells. (c) Western blotting of CCND2 and CDK6. Total cell lysates were obtained 24 h after 8-OHD treatment, following the protocol outlined in the Materials and Methods section. (f) GSEA result indicates that the gene set “Hallmark Myc Targets v. 2” is enriched with 8-OHD-downregulated genes. The barcode plot indicates the position of the genes in each gene set. The horizontal bar in graded color from red to blue indicates up- and down-regulated by 8-OHD. The vertical axis in the lower plot indicates Ranked List Metri.
Figure 5
Figure 5
AML-related genes were downregulated by 8-OHD. (a) Venn diagram of 8-OHD-downregulated DEGs and gene sets of DisGeNET CUI: C0026998 and CUI: C1879321. The 7 genes in the intersection of three sets are listed below. (b,d,e,gi) mRNA expression of AML-targeted genes was measured using RT-qPCR 24 h after treatment, following the methodology outlined in the Materials and Methods section. * p < 0.05, ** p < 0.01, and *** p < 0.001 represent significant differences compared with the vehicle-treated cells. (c) Western blotting of CCND2 and CDK6. Total cell lysates were obtained 24 h after 8-OHD treatment, following the protocol outlined in the Materials and Methods section. (f) GSEA result indicates that the gene set “Hallmark Myc Targets v. 2” is enriched with 8-OHD-downregulated genes. The barcode plot indicates the position of the genes in each gene set. The horizontal bar in graded color from red to blue indicates up- and down-regulated by 8-OHD. The vertical axis in the lower plot indicates Ranked List Metri.
Figure 6
Figure 6
Key KEGG pathways associated with 8-OHD-upregulated DEGs. (a) Top 15 enriched KEGG pathways. (b) NF-κB signaling pathway (hsa04064). (c) Western blot analysis of nuclear NFκB p65 and phospho-NFκB p65. Nuclear extract was prepared 24 h after 8-OHD treatment, as described in Materials and Methods. (d) Toll-like receptor signaling pathway (hsa04620). (e) GSEA result indicates that the gene set “KEGG Toll-like receptor signaling pathway” is enriched with 8-OHD-upregulated genes. The barcode plot indicates the position of the genes in each gene set. The horizontal bar in graded color from red to blue indicates up- and down-regulated by 8-OHD. The vertical axis in the lower plot indicates Ranked List Metri. (f) Western blot analyses of JNK and phospho-JNK. Total cell lysate was prepared 6 h after 8-OHD treatment, as described in Materials and Methods. (g) FOS gene upregulation. RNA was prepared 24 h after treatment and measured by RT-qPCR as described in Materials and Methods. * p < 0.05 represents significant differences compared with the vehicle-treated cells. (h) Apoptosis pathway (hsa04210). Upregulated DEGs were marked with red stars in KEGG pathways.
Figure 6
Figure 6
Key KEGG pathways associated with 8-OHD-upregulated DEGs. (a) Top 15 enriched KEGG pathways. (b) NF-κB signaling pathway (hsa04064). (c) Western blot analysis of nuclear NFκB p65 and phospho-NFκB p65. Nuclear extract was prepared 24 h after 8-OHD treatment, as described in Materials and Methods. (d) Toll-like receptor signaling pathway (hsa04620). (e) GSEA result indicates that the gene set “KEGG Toll-like receptor signaling pathway” is enriched with 8-OHD-upregulated genes. The barcode plot indicates the position of the genes in each gene set. The horizontal bar in graded color from red to blue indicates up- and down-regulated by 8-OHD. The vertical axis in the lower plot indicates Ranked List Metri. (f) Western blot analyses of JNK and phospho-JNK. Total cell lysate was prepared 6 h after 8-OHD treatment, as described in Materials and Methods. (g) FOS gene upregulation. RNA was prepared 24 h after treatment and measured by RT-qPCR as described in Materials and Methods. * p < 0.05 represents significant differences compared with the vehicle-treated cells. (h) Apoptosis pathway (hsa04210). Upregulated DEGs were marked with red stars in KEGG pathways.
Figure 7
Figure 7
Predicted 8-OHD binding targets using Swiss Target Prediction. (a) The summary of the predicted target classes displayed as a pie chart. Percentages are calculated using the top 50 predicted targets. (b) Venn diagram of predicted 8-OHD targets and gene sets of DisGeNET CUI: C0026998 and CUI: C1879321. The 4 targets in the intersection of three sets were listed.
Figure 8
Figure 8
Plausible docking models of 8-OHD with AML target proteins. The preferable 3D and 2D poses of 8-OHD docked into the binding domain of different proteins. (a) CDK6 (docking score: −6.60). (b) FLT3 (docking score: −5.87). (c) TERT (docking score: −6.29). The proteins are shown in ribbon, and the compound is shown in blue color in 3D model. In 2D model, key amino acids within 4.5 Å of docked 8-OHD and their binding interactions were identified. Polar residues are colored mauve, while hydrophobic residues are represented in green. Basic residues are indicated with a blue rim and acidic residues with a red rim. Hydrogen bonds are represented as dotted lines with arrows indicating the direction of the bond. A halo-like disc around a residue denotes a reduction in solvent exposure induced by 8-OHD [77]. CH/π hydrogen bond interactions are shown by a dotted green line from the residue to the center of the ring of 8-OHD.
Figure 9
Figure 9
Synergic effect of combination treatment of 8-OHD and Ara-C in U-937 cells. (a) U-937 cells were treated with vehicle (0.1% DMSO), 8-OHD, Ara-C, or combination for 24 h. Cell viability was examined using trypan blue exclusion test. The experiments were repeated three times. These data represent the mean ± SD of three independent experiments. * p < 0.05 and ** p < 0.01 represent significant differences compared with indicated treatment. (b) Synergy scores displayed in Surface plots modeled by Loewe and HSA.

Similar articles

Cited by

References

    1. Tsao R. Chemistry and biochemistry of dietary polyphenols. Nutrients. 2010;2:1231–1246. doi: 10.3390/nu2121231. - DOI - PMC - PubMed
    1. Wang Q., Ge X., Tian X., Zhang Y., Zhang J., Zhang P. Soy isoflavone: The multipurpose phytochemical (Review) Biomed. Rep. 2013;1:697–701. doi: 10.3892/br.2013.129. - DOI - PMC - PubMed
    1. Mann G.E., Bonacasa B., Ishii T., Siow R.C. Targeting the redox sensitive Nrf2-Keap1 defense pathway in cardiovascular disease: Protection afforded by dietary isoflavones. Curr. Opin. Pharmacol. 2009;9:139–145. doi: 10.1016/j.coph.2008.12.012. - DOI - PubMed
    1. Vitale D.C., Piazza C., Melilli B., Drago F., Salomone S. Isoflavones: Estrogenic activity, biological effect and bioavailability. Eur. J. Drug Metab. Pharmacokinet. 2013;38:15–25. doi: 10.1007/s13318-012-0112-y. - DOI - PubMed
    1. Yamagata K., Yamori Y. Potential Effects of Soy Isoflavones on the Prevention of Metabolic Syndrome. Molecules. 2021;26:5863. doi: 10.3390/molecules26195863. - DOI - PMC - PubMed

Publication types