. 2023 Nov 1;13(11):1603.
doi: 10.3390/biom13111603.

Targeting the Structural Maturation Pathway of HIV-1 Reverse Transcriptase

Affiliations

Targeting the Structural Maturation Pathway of HIV-1 Reverse Transcriptase

Thomas W Kirby et al. Biomolecules. .

Abstract

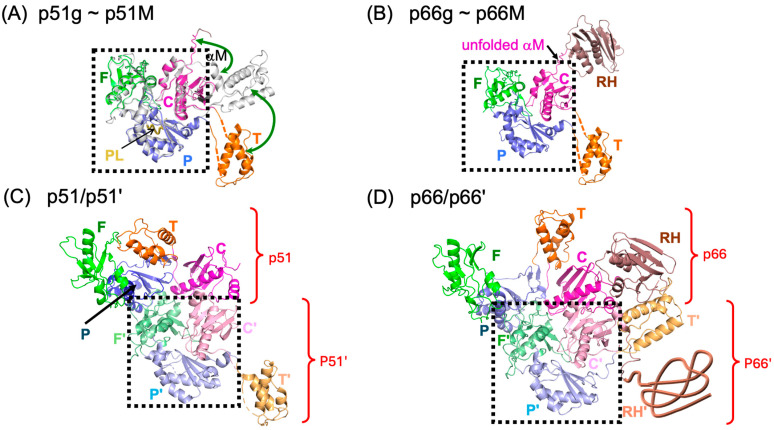
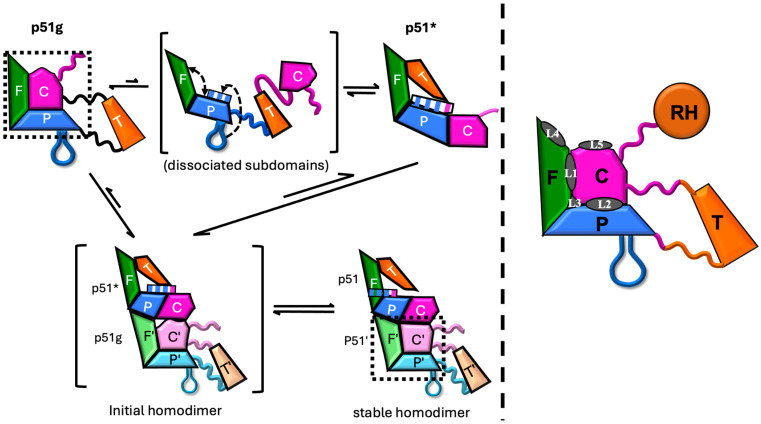
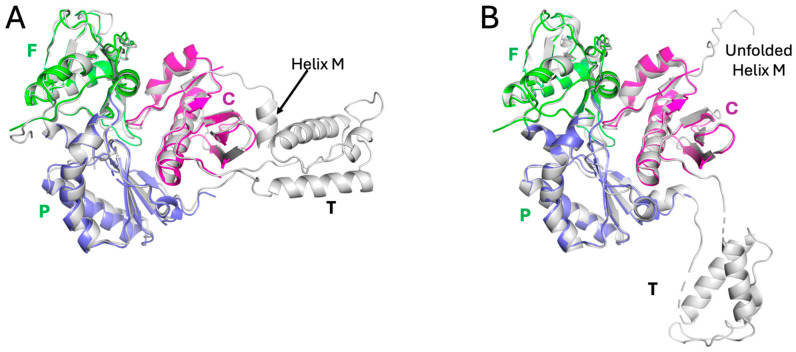
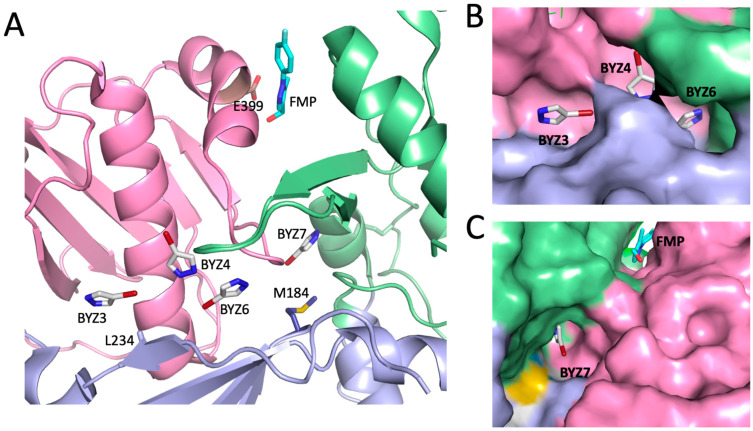
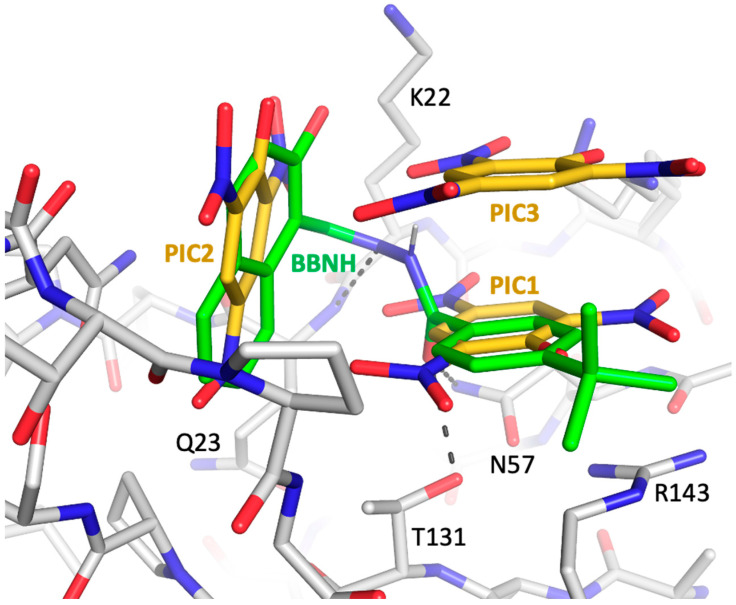
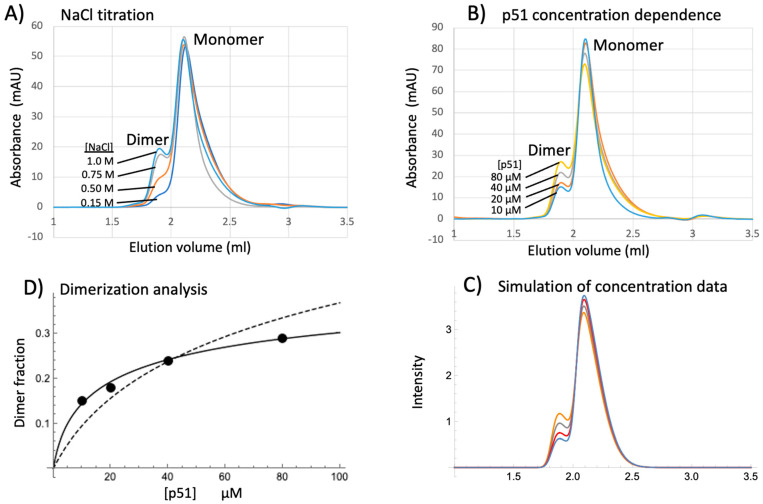
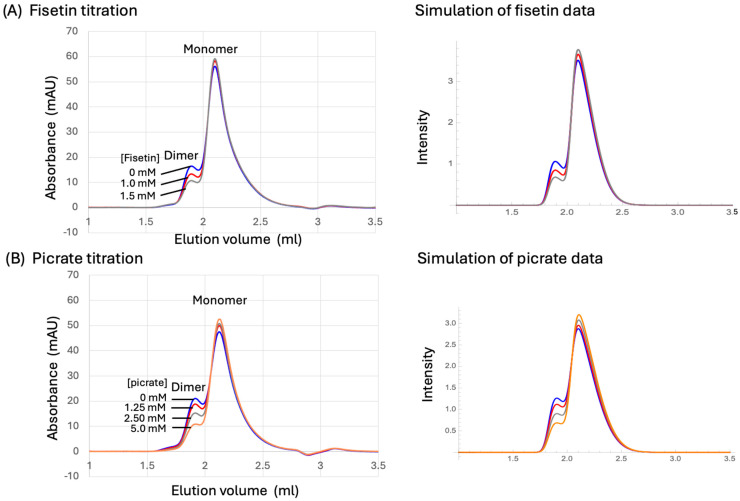
Formation of active HIV-1 reverse transcriptase (RT) proceeds via a structural maturation process that involves subdomain rearrangements and formation of an asymmetric p66/p66' homodimer. These studies were undertaken to evaluate whether the information about this maturation process can be used to identify small molecule ligands that retard or interfere with the steps involved. We utilized the isolated polymerase domain, p51, rather than p66, since the initial subdomain rearrangements are largely limited to this domain. Target sites at subdomain interfaces were identified and computational analysis used to obtain an initial set of ligands for screening. Chromatographic evaluations of the p51 homodimer/monomer ratio support the feasibility of this approach. Ligands that bind near the interfaces and a ligand that binds directly to a region of the fingers subdomain involved in subunit interface formation were identified, and the interactions were further characterized by NMR spectroscopy and X-ray crystallography. Although these ligands were found to reduce dimer formation, further efforts will be required to obtain ligands with higher binding affinity. In contrast with previous ligand identification studies performed on the RT heterodimer, subunit interface surfaces are solvent-accessible in the p51 and p66 monomers, making these constructs preferable for identification of ligands that directly interfere with dimerization.

Keywords: HIV-1 reverse transcriptase; RT dimerization inhibitor; RT polymerase domain; RT structural maturation; ground state stabilization; maturation inhibitors.


Conflict of interest statement

The authors declare no conflict of interest.

Figures

Figure 1
Figure 1
Structures of p51 and p66 monomers and homodimers. (A) Ribbon diagram of the stabilized p51 monomer lacking the disordered palm loop residues (PDB: 4KSE, [1]) in which the position of the missing palm loop residues is indicated (PL, gold loop). The subdomains are color-coded: fingers (F, green), palm (P, blue), thumb (T, orange), and connection (C, magenta), and the structure is shown overlaid with the p51 subunit of RT (gray, PDB: 1DLO, [2]) in order to illustrate the differences. (B) The p66 monomer structure determined based on NMR studies of the δ-13CH3-Ile-labeled constructs [13]. The RH domain is shown in brown. The monomer structures in panels A and B correspond to the predominant p51g and p66g ground states. (C) The modeled p51/p51′ homodimer is derived from the structure of the p66/p51 heterodimer by deleting the p66 RH domain and replacing the p51 subunit structure with that of the p51M shown in panel A. Since p51 lacks an RNase H domain, there are no inter-subunit contacts to position the T′ subdomain in p51′. The compact, globular FPC structure indicated by the dotted black line is present in each of the structures shown. (D) The p66/p66′ homodimer is formed after a series of slow processes that include formation of the thumb’–RH interface. Late in the process, residues are transferred from the folded RH′ domain to the C′ subdomain. The p66/p66′ homodimer shown is based on RT heterodimer structure 1RTJ [3], in which the entire RH′ domain segment from Tyr427 through Phe440 has been transferred to C′. In this state, the RH′ domain has already unfolded but, in the illustrated structure, RH′ has not yet been proteolyzed and is represented as a random coil. In the dimeric structures, panels C and D, the active subunits are shown using brighter hues and the structural subunits are shown using paler hues. The helical segment at the C-terminus of the C′ subdomain extends through Leu29, incorporating residues that also are important for RH′ domain stability.
Figure 2
Figure 2
Reversible dimerization of the RT polymerase domain and identification of inhibitory targets. (Left hand panel): rearrangement of the p51 monomer proceeds through dissociation of the polymerase subdomains with the exception of the discontinuous fingers/palm. The dissociated subdomains can either reassemble back to the more stable ground state or rearrange and alternately reassociate to adopt an ensemble of more extended p51* structures that approximate the active polymerase structure in the p66 subunit of the heterodimer. The palm loop (blue) is able to form a short β-sheet, adding an additional strand from the connection subdomain (magenta) on the inner surface of the palm subdomain. As shown in the lower portion of the figure, the p51* excited states can then form an initial dimer with the monomer that is further stabilized by conformational adjustments of the palm and connection subdomains. Deletion of the palm loop (blue) prevents subdomain rearrangements and formation of p51* [13]. Subdomain color coding: fingers (green), palm (blue), thumb (orange), and connection (magenta), with the p51′ subdomains of the homodimer indicated with paler hues. The more compact, globular FPC structure characteristic of the p51 subunit is also present in the initial monomer ground state and is indicated by a dotted black line. (Right hand side): schematic of p66g showing potential subdomain and interface target ligands postulated to stabilize the monomer form. Ligands L1, L2, and L3 would target subdomain interfaces, while ligands L4 and L5 would target the p66g monomer surface involved in dimer formation. Color coding is as in the left-hand panel, with the additional RH domain shown in brown.
Figure 3
Figure 3
Structural comparisons of FPC constructs. (A) Ribbon diagram overlay of construct FPC1 with the p51 subunit (chain B) of unliganded RT (gray, PDB: 1DLO, [9]). (B) Overlay of FPC1 with the stabilized p51∆PL construct lacking palm loop residues Lys219-Met230. This palm loop deletion previously was shown to stabilize the compact subunit structure of the p51 monomer [13], and the same palm loop residues are disordered in the p51 subunit of apo RT (PDB: 1DLO). The FPC1 subdomains are color-coded as in Figure 1. As also shown in panel B, the p51∆PL segments linking the thumb to the palm and connection subdomains are partially disordered and helix M has unfolded.
Figure 4
Figure 4
Positions of previously identified ligands located at subdomain boundaries. (A) The positions of bromopyrazoles BYZ3, BYZ4, BYZ6, and BYZ7 and of the Glu399 ligand [1-(4-Fluorophenyl)-5-methyl-1H-pyrazol-4-yl]methanol (FMP) in the p51 subunit of RT were obtained using overlaid PDB files 5CYQ [22] and 4IFV [23]. The protein is shown as a ribbon diagram and the sidechains of Met184 located near BYZ7 and L234, located near BYZ3 and E399, and located near FMP are also indicated. (B) Surface rendering of the FPC1 binding region containing BYZ3, BYZ4, and BYZ6; (C) surface rendering of the FPC1 binding region containing BYZ7 and the Glu399 ligand. In all panels, the subdomains are color-coded as fingers (green), palm (blue), and connection (magenta).
Figure 5
Figure 5
Illustrative STD data. Panels (A,B) correspond to screening studies of the ligands pictured at the top. The lower spectra are control NMR studies of the mixture, and the spectra in the center of the panels are the STD experiments. In panel A, compound nsc350081 (tetrahydroxyxanthene) produced significantly stronger STD peaks (indicated with an asterisk) compared with the other compounds present in the mixture. In panel B, only the resonance near 9.0 ppm gave a strong STD signal (indicated with an asterisk). As noted in the text, this resonance was assigned to the picrate counter ion present in nsc101563 (CAS # 17415-78-0). The figures at the top include the compound structures present in the group, the NSC number, and a schematic representation of the binding site; positions highlighted in yellow make favorable H-bonds with the binding site, while positions highlighted in magenta make unfavorable contacts. The STD samples contained 200 µM of the test compounds in the following screening buffer: 15 µM FPC1 in 50 mM K2HPO4, pH 7.4; 50 mM KCl; and 10% DMSO-d6 in D2O containing a DSS shift standard.
Figure 6
Figure 6
Effect of fisetin on the NMR spectrum of [13CH3-Met]FPC1(L234M). (A) Titration of methionine-labeled FPC1 with fisetin produces significant shift perturbations of Met41, while Met184 shifts and is strongly broadened, precluding a more complete titration analysis. The remaining Met resonances exhibit smaller shifts, which are more difficult to interpret quantitatively due to overlap. As shown in Figure S2, M16 produces two resonances. (B) The interaction with Met41 corresponds to a Kd = 1.1 mM. The sample contained 200 µM of the labeled FPC1 in 50 mM KH2PO4 (pH7.5), 50 mM KCl, 20% DMSO-d6, 80% D2O, where the DMSO was required to maintain fisetin solubility over the concentration range used. The sample was in a Shigemi tube and the experiment run on a Varian 800 MHz NMR spectrometer at 25 °C.
Figure 7
Figure 7
Picrate binding to the fingers subdomain interferes with dimerization. (A) Three picrate ligands (gold) are bound to the fingers subdomain in the crystal structure with FPC1 (gray). The three negative charges are neutralized by Lys20, Lys22, and Arg143 in the binding site. The β2–β3 loop shifts position and the conformation of the β7–β8 loop is altered relative to their positions in the unliganded FPC structures. In the FPC1–picrate complex structure, the picrate ligands also form a lattice contact with a second FPC1 molecule (Supplementary Figure S4). As indicated in the figure, the electron density of Lys20 was fit to two alternate conformations. Dashed black lines indicate H-bonds and dashed red lines indicate repulsive interactions. (B) Overlay of the picrate–FPC1 complex with the p51 subunit of apo RT (p66 (green)/p51 (brown); PDB: 1DLO, [9]) demonstrates significant steric conflict with the p66 αB-β5 palm loop. In the overlay, the position of picrate 1 largely overlaps the Trp88 indole ring in p66 subunit of the RT heterodimer, with picrate 2 and 3 showing extensive conflict with other residues in the p66 αB-β5 palm loop. In addition to the direct overlap, alteration of the conformation of the p51 β7–β8 loop would interfere with p66 binding. Thus, picrate binding to p51 would be expected to compete with formation of the p66-p51 dimer and with formation of the p66-p66′ homodimer.
Figure 8
Figure 8
Predicted and experimental interactions with XOH. (A) Predicted position of 9H-Xanthene-1,3,6,8-tetrol (XOH, cyan) in the BYZ46 site of FPC1. The ligand is sandwiched between palm subdomain residue Y232 and connection subdomain residues Q373 and W410, with the hydroxyl groups positioned to form multiple H-bond interactions. Predicted hydrogen bonds with Lys65 and Arg358 sidechains are not likely to be significant since their positions vary in different crystal structures. (B) Observed interactions of the XOH1 ligand at the BYZ7 site. The XOH hydroxyl groups form H-bonds with the Asp185 and Asn81 sidechains and the xanthene ring is stacked between Met184 and Lys154. (C) Binding of XOH2 at the Met41 site in the fingers subdomain; the XOH hydroxyls form H-bonds with the Glu44 sidechain, the Lys73 backbone amide, and with a His-tag-derived imidazole. The ring stacks against Ile37 and is positioned near Met41. Subdomains are color-coded as in Figure 1. The shift behavior of Met41 in the presence of fisetin (Figure 6) suggests that it also is binding to this site.
Figure 9
Figure 9
CB-dock analysis showing binding of dimerization inhibitor BBNH to the picrate site. A CB-dock analysis of the interaction of ligand BBNH (green) with the FPC1 construct (gray) was performed on the structure of the complex after removal of the bound picrate (gold) and tetrahydroxyxanthene ligands. The docking program is unable to identify this binding cavity in structures obtained in the absence of picrate. The BBNH aromatic groups overlap with the PIC1 and PIC2 ligands (shown after superimposing the picrate ligands on the BBNH complex) and the linking segment makes H-bonds with Gln23, Asn57, and Thr131, as indicated. As in Figure 7, density for K20 is resolved into two alternate conformers.
Figure 10
Figure 10
Size exclusion chromatograms showing the effects of ionic strength and concentration on p51 homodimerization. (A) The homodimer fraction increases as a function of [NaCl] = 0.15, 0.5, 0.75, 1.0 M. (B) Homodimer fraction increase for [p51] = 10, 20, 40, 80 µM. (C) Simulation of the data in panel B using a skewed Gaussian model with parameters µ1 = 1.82, µ2 = 2.03, σ1 = σ2 = 0.17, and α1 = α2 = 4.5. The orange, gray, red, and blue colors used in panels B and C both correspond to the concentrations indicated in panel B. (D) Fit of the homodimerization data (filled circles) using a model in which the limiting fractional homodimer approaches 1.0 (dashed line) or a limit of 0.47 (solid line); the comparison indicates that only the latter model provides a reasonable fit of the data.
Figure 11
Figure 11
Effects of fisetin and picrate on p51 homodimerization. (A) Size exclusion chromatogram of 20 µM p51 as a function of fisetin (0, 1.0, and 1.5 mM); (B) size exclusion chromatogram of 20 µM p51 as a function of picrate (0, 1.25, 2.5, and 5.0 mM). A set of simulated curves obtained as described in the text is shown to the right of each set of titration data. Colors used for the simulated curves on the right correspond to the color-concentration relation indicated on the left. The fractional dimer concentration decreases by 50% at 2.2 mM fisetin or 5.2 mM picrate. The SEC column was equilibrated and eluted with SEC buffer (50 mM Bis-Tris, 1 M NaCl, 1 mM CDTA, pH 6.5); samples contained 80% SEC buffer, 20% glycerol.

Similar articles

Cited by

References

    1. Agosto L.M., Zhong P., Munro J., Mothes W. Highly Active Antiretroviral Therapies Are Effective against HIV-1 Cell-to-Cell Transmission. PLoS Pathog. 2014;10:e1003982. doi: 10.1371/journal.ppat.1003982. - DOI - PMC - PubMed
    1. Gallant J.E., DeJesus E., Arribas J.R., Pozniak A.L., Gazzard B., Campo R.E., Lu B., McColl D., Chuck S., Enejosa J., et al. Tenofovir DF, emtricitabine, and efavirenz vs. zidovudine, lamivudine, and efavirenz for HIV. N. Engl. J. Med. 2006;354:251–260. doi: 10.1056/NEJMoa051871. - DOI - PubMed
    1. Chaudhuri S., Symons J.A., Deval J. Innovation and trends in the development and approval of antiviral medicines: 1987–2017 and beyond. Antivir. Res. 2018;155:76–88. doi: 10.1016/j.antiviral.2018.05.005. - DOI - PMC - PubMed
    1. Das K., Arnold E. HIV-1 reverse transcriptase and antiviral drug resistance. Part 1. Curr. Opin. Virol. 2013;3:111–118. doi: 10.1016/j.coviro.2013.03.012. - DOI - PMC - PubMed
    1. Das K., Arnold E. HIV-1 reverse transcriptase and antiviral drug resistance. Part 2. Curr. Opin. Virol. 2013;3:119–128. doi: 10.1016/j.coviro.2013.03.014. - DOI - PMC - PubMed

Publication types

Substances

LinkOut - more resources