

Machine Learning Technology for EEG-Forecast of the Blood-Brain Barrier Leakage and the Activation of the Brain's Drainage System during Isoflurane Anesthesia
- PMID: 38002287
- PMCID: PMC10669477
- DOI: 10.3390/biom13111605
Machine Learning Technology for EEG-Forecast of the Blood-Brain Barrier Leakage and the Activation of the Brain's Drainage System during Isoflurane Anesthesia
Abstract
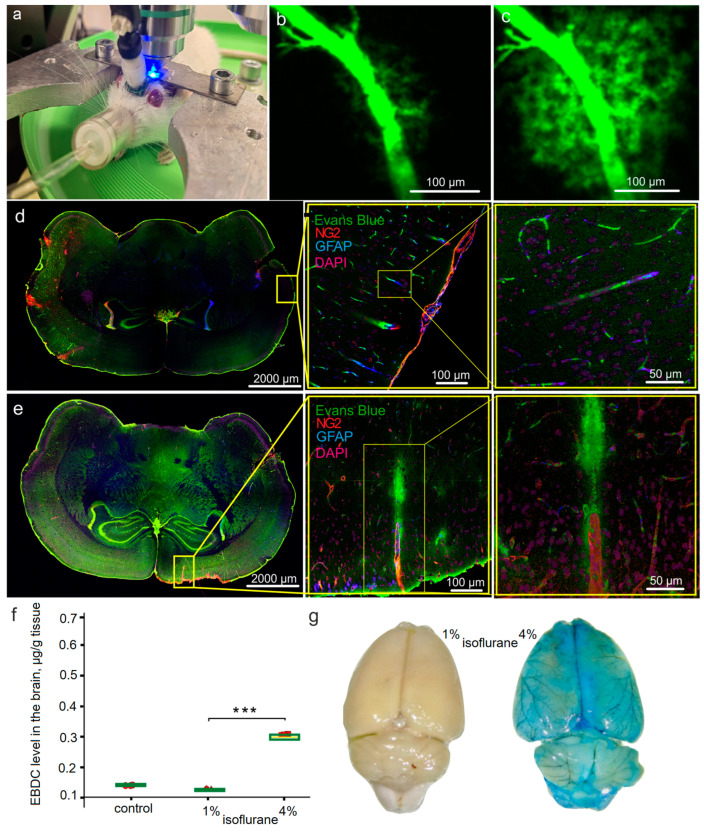
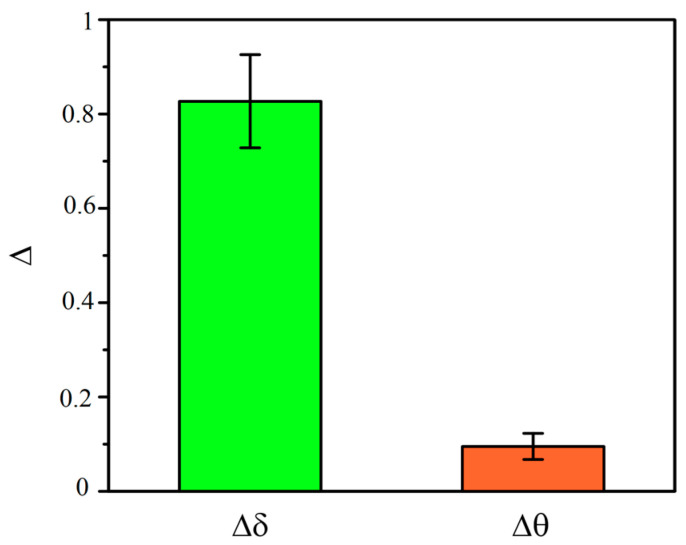
Anesthesia enables the painless performance of complex surgical procedures. However, the effects of anesthesia on the brain may not be limited only by its duration. Also, anesthetic agents may cause long-lasting changes in the brain. There is growing evidence that anesthesia can disrupt the integrity of the blood-brain barrier (BBB), leading to neuroinflammation and neurotoxicity. However, there are no widely used methods for real-time BBB monitoring during surgery. The development of technologies for an express diagnosis of the opening of the BBB (OBBB) is a challenge for reducing post-surgical/anesthesia consequences. In this study on male rats, we demonstrate a successful application of machine learning technology, such as artificial neural networks (ANNs), to recognize the OBBB induced by isoflurane, which is widely used in surgery. The ANNs were trained on our previously presented data obtained on the sound-induced OBBB with an 85% testing accuracy. Using an optical and nonlinear analysis of the OBBB, we found that 1% isoflurane does not induce any changes in the BBB, while 4% isoflurane caused significant BBB leakage in all tested rats. Both 1% and 4% isoflurane stimulate the brain's drainage system (BDS) in a dose-related manner. We show that ANNs can recognize the OBBB induced by 4% isoflurane in 57% of rats and BDS activation induced by 1% isoflurane in 81% of rats. These results open new perspectives for the development of clinically significant bedside technologies for EEG-monitoring of OBBB and BDS.
Keywords: anesthesia; blood–brain barrier; brain’s drainage system; machine learning technology; spectral power analysis.
Conflict of interest statement
The authors declare no conflict of interest.
Figures


Similar articles
-
EEG biomarkers of activation of the lymphatic drainage system of the brain during sleep and opening of the blood-brain barrier.Comput Struct Biotechnol J. 2022 Dec 15;21:758-768. doi: 10.1016/j.csbj.2022.12.019. eCollection 2023. Comput Struct Biotechnol J. 2022. PMID: 36698965 Free PMC article.
-
Effects of mild hypothermia on blood-brain barrier disruption during isoflurane or pentobarbital anesthesia.Anesthesiology. 2001 Oct;95(4):933-8. doi: 10.1097/00000542-200110000-00023. Anesthesiology. 2001. PMID: 11605935
-
The impact of isoflurane anesthesia on brain metabolism in mice: An MRI and electroencephalography study.NMR Biomed. 2024 Dec;37(12):e5260. doi: 10.1002/nbm.5260. Epub 2024 Sep 10. NMR Biomed. 2024. PMID: 39254055
-
Beyond anesthetic properties: the effects of isoflurane on brain cell death, neurogenesis, and long-term neurocognitive function.Anesth Analg. 2010 Feb;110(2):431-7. Anesth Analg. 2010. PMID: 25508825 Review.
-
Beyond anesthetic properties: the effects of isoflurane on brain cell death, neurogenesis, and long-term neurocognitive function.Anesth Analg. 2010 Feb;110(2):431-7. doi: 10.1213/ANE.0b013e3181af8015. Anesth Analg. 2010. PMID: 19917621 Review.
References
-
- Wang Y., Wang J., Ye X., Xia R., Ran R., Wu Y., Chen Q., Li H., Huang S., Shu A., et al. Anaesthesia-related mortality within 24 h following 9,391,669 anaesthetics in 10 cities in Hubei Province, China: A serial cross-sectional study. Lancet Reg. Health West. Pac. 2023;37:100787. doi: 10.1016/j.lanwpc.2023.100787. - DOI - PMC - PubMed
Publication types
MeSH terms
Substances
Grants and funding
LinkOut - more resources
Full Text Sources
Medical
