. 2023 Nov 6;13(11):1619.
doi: 10.3390/biom13111619.

Elevated Levels of Mislocalised, Constitutive Ras Signalling Can Drive Quiescence by Uncoupling Cell-Cycle Regulation from Metabolic Homeostasis

Affiliations

Elevated Levels of Mislocalised, Constitutive Ras Signalling Can Drive Quiescence by Uncoupling Cell-Cycle Regulation from Metabolic Homeostasis

Elliot Piper-Brown et al. Biomolecules. .

Abstract

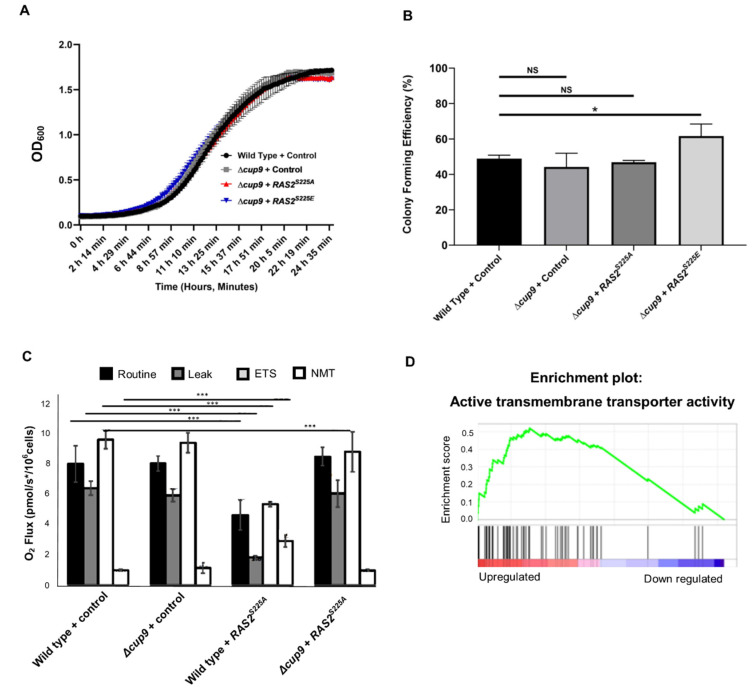
The small GTPase Ras plays an important role in connecting external and internal signalling cues to cell fate in eukaryotic cells. As such, the loss of RAS regulation, localisation, or expression level can drive changes in cell behaviour and fate. Post-translational modifications and expression levels are crucial to ensure Ras localisation, regulation, function, and cell fate, exemplified by RAS mutations and gene duplications that are common in many cancers. Here, we reveal that excessive production of yeast Ras2, in which the phosphorylation-regulated serine at position 225 is replaced with alanine or glutamate, leads to its mislocalisation and constitutive activation. Rather than inducing cell death, as has been widely reported to be a consequence of constitutive Ras2 signalling in yeast, the overexpression of RAS2S225A or RAS2S225E alleles leads to slow growth, a loss of respiration, reduced stress response, and a state of quiescence. These effects are mediated via cAMP/PKA signalling and transcriptional changes, suggesting that quiescence is promoted by an uncoupling of cell-cycle regulation from metabolic homeostasis. The quiescent cell fate induced by the overexpression of RAS2S225A or RAS2S225E could be rescued by the deletion of CUP9, a suppressor of the dipeptide transporter Ptr2, or the addition of peptone, implying that a loss of metabolic control, or a failure to pass a metabolic checkpoint, is central to this altered cell fate. Our data suggest that the combination of an increased RAS2 copy number and a dominant active mutation that leads to its mislocalisation can result in growth arrest and add weight to the possibility that approaches to retarget RAS signalling could be employed to develop new therapies.

Keywords: Ras; cell fate; metabolism; yeast signalling; yquiescence.


Conflict of interest statement

The authors declare that we have no conflicts of interest regarding this submission.

Figures

Figure 1
Figure 1
Cells expressing RAS2, RAS2S225A, and RAS2S225E from either a low-copy (CEN) or high-copy (2 µ) plasmid were grown in selective SD-URA minimal medium for 24 h at 30 °C before the total protein was extracted and probed by Western blotting with an anti-Ras2 and anti-Pgk1 antibody (loading control). Graphs represent the normalised relative band intensity from three biological replicates (A). Growth analysis of wild-type S. cerevisiae cells overexpressing RAS2, RAS2S225A, RAS2S225E, or an empty plasmid control (EV) from either a low-copy (CEN) (B) or high-copy (2 µ) (C) plasmid, representing an average of three biological replicates. Colony-forming unit assay of cells overexpressing RAS2, RAS2S225A, RAS2S225E, or an empty plasmid control grown in SD-URA medium (D). A one-way ANOVA using Dunnett’s multiple comparison test was used to determine statistical significance; * p ≤ 0.05, *** p ≤ 0.001. Error bars represent standard deviations.
Figure 2
Figure 2
Active Ras was visualised in cells overexpressing RAS2, RAS2S225A, RAS2S225E, or a control containing an empty plasmid using a 3xGFP-RBD probe during the logarithmic and stationary phases of growth. Cells were cultured in SD-URA/-LEU growth media. The experiment was repeated three times, and a representative dataset is shown. Scale bar—10 µm (A). Growth of wild-type cells overexpressing RAS2, RAS2S225A, RAS2S225E, or containing an empty plasmid control was carried out in SD-URA or SD-URA + 2 mM H2O2 media; n = 3, error bars represent the standard deviation (B). Wild-type cells overexpressing RAS2, RAS2S225A, RAS2S225E, or containing an empty plasmid control were serially diluted from 2 × 10⁶/mL to 2 × 10³/mL and plated onto SD-URA plates supplemented with increasing concentrations of copper sulphate. This experiment was completed three times, and a representative result is shown (C).
Figure 3
Figure 3
Wild-type cells overexpressing RAS2S225A or an empty plasmid control were grown in SD-URA, and necrosis (PI uptake) (A) and ROS (DHE) (B) measurements were taken over a 12-day period of continuous incubation. The data displayed are the average of three technical repeats, and the error bars represent the standard deviation. A bar chart showing the routine, leak, ETS, and NMT O2 flux values for wild-type cells overexpressing RAS2S225A or RAS2S225E, or containing an empty plasmid backbone control. The experiment was conducted in triplicate, and a representative dataset from one experiment is shown (C). A colony-forming unit assay of wild-type cells overexpressing RAS2S225A or RAS2S225E, or containing an empty plasmid control, grown in SD-URA medium for 24 h at 30 °C, was conducted and plated on either SD-URA or SD-URA + peptone (D). A colony-forming efficiency assay of wild-type cells overexpressing RAS2S225A, RAS2S225E, or an empty plasmid backbone co-expressed with PDE2 (E), or in a strain lacking PDE2 (F). The data presented are the average of three biological replicates, and the error bars represent the standard deviation. A one-way ANOVA using Tukey’s multiple comparison test was used to determine statistical significance. Nonsignificant = NS, * = adjusted p-value ≤ 0.01, ** adjusted p-value of 0.05 and *** = adjusted p value ≤ 0.001.
Figure 4
Figure 4
(A) Global gene expression changes in wild-type cells overexpressing RAS2S225A when compared to a wild-type control. DESeq2 was used to compare gene expression in wild-type cells overexpressing RAS2S225A to a wild-type control; in total, there were 4133 significantly differentially expressed genes. Gene set cluster maps were created using the Cytoscape plugin, showing the most upregulated and downregulated gene sets, as determined by GSEA analysis, along with their cellular functions; circle size within a cluster represents the change in the expression level of a single gene. Representative gene sets shown to be upregulated (B) or downregulated (C) upon the overexpression of RAS2S225A when compared to the wild-type control by GSEA. Vertical black lines represent individual genes in the significantly differentially expressed ranked gene list, from upregulated (left) to downregulated (right). An increase in the enrichment score is seen if there are many genes towards the beginning of the ranked list (upregulated) in the gene set.
Figure 5
Figure 5
Growth analysis (A) and CFU assay (B) of wild-type and Δcup9 cells overexpressing RAS2S225A or RAS2S225E, or containing an empty plasmid control. Routine, leak, ETS, and NMT O2 flux values for wild-type and Δcup9 cells overexpressing RAS2S225A or an empty plasmid backbone control. In each case, the data shown represent an average of three biological repeats, and the error bars indicate the standard deviation. A one-way ANOVA using Tukey’s multiple comparison test was used to determine statistical significance; Nonsignificant = NS, * p ≤ 0.01, *** p ≤ 0.001 (C). A representative GSEA gene set shown to be upregulated upon the overexpression of RAS2S225A in a Δcup9 background when compared to wild-type cells overexpressing RAS2S225A (D).
Figure 6
Figure 6
Model depicting a mechanism by which the overexpression of RAS2S225A or RAS2S225E promotes quiescence. The substitution of Ras2 at serine 225 for alanine or glutamate leads to constitutive activation at the nuclear envelope/ER when overexpressed. RAS2S225A/E-driven cAMP/PKA signalling from the nuclear envelope/ER, in turn, promotes senescence under conditions of nutritional challenge by uncoupling the control of the expression of cell-cycle control for core metabolic processes. The addition of peptone or deletion of CUP9, which leads to the upregulation of a battery of metabolite transporters, can counteract quiescence driven by RAS2S225A/E signalling, potentially by overcoming an essential metabolic checkpoint that is required to re-enter the cell cycle.

Similar articles

Cited by

References

    1. Kataoka T., Powers S., McGill C., Fasano O., Strathern J., Broach J., Wigler M. Genetic analysis of yeast RAS1 and RAS2 genes. Cell. 1984;37:437–445. doi: 10.1016/0092-8674(84)90374-X. - DOI - PubMed
    1. Boguski M.S., McCormick F. Proteins regulating Ras and its relatives. Nature. 1993;366:643–654. doi: 10.1038/366643a0. - DOI - PubMed
    1. Fernández-Medarde A., De Las Rivas J., Santos E. 40 years of RAS—A historic overview. Genes. 2021;12:681. doi: 10.3390/genes12050681. - DOI - PMC - PubMed
    1. Pentland D.R., Piper-Brown E., Mühlschlegel F.A., Gourlay C.W. Ras signalling in pathogenic yeasts. Microb. Cell. 2018;5:63–73. doi: 10.15698/mic2018.02.612. - DOI - PMC - PubMed
    1. Wennerberg K., Rossman K.L., Der C.J. The Ras superfamily at a glance. J. Cell Sci. 2005;118:843–846. doi: 10.1242/jcs.01660. - DOI - PubMed

Publication types

MeSH terms

LinkOut - more resources