. 2023 Nov 17;13(11):1662.
doi: 10.3390/biom13111662.

LEO1 Is Required for Efficient Entry into Quiescence, Control of H3K9 Methylation and Gene Expression in Human Fibroblasts

Affiliations

LEO1 Is Required for Efficient Entry into Quiescence, Control of H3K9 Methylation and Gene Expression in Human Fibroblasts

Marc Laurent et al. Biomolecules. .

Abstract

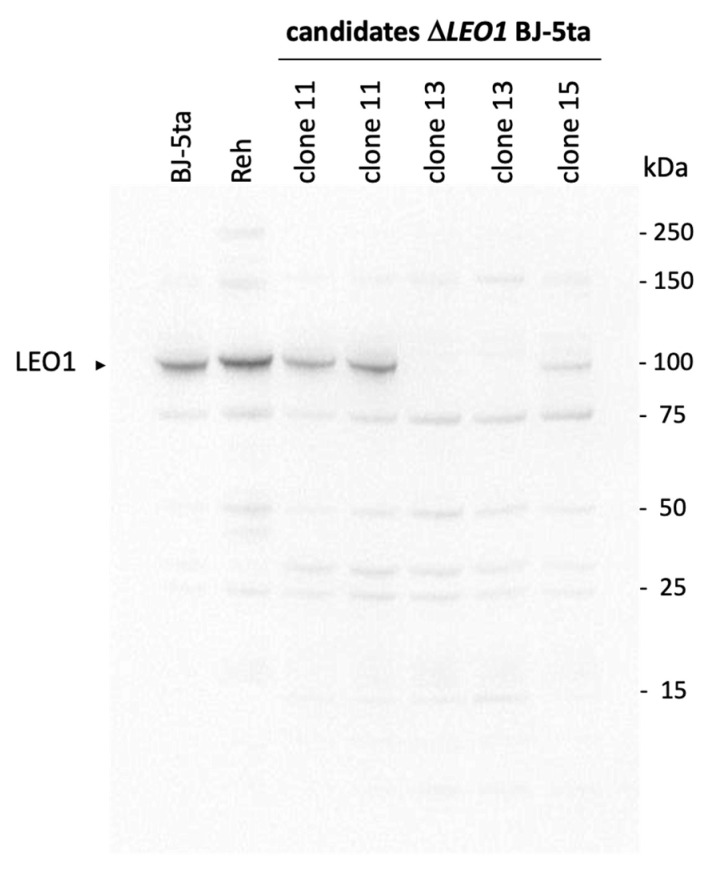
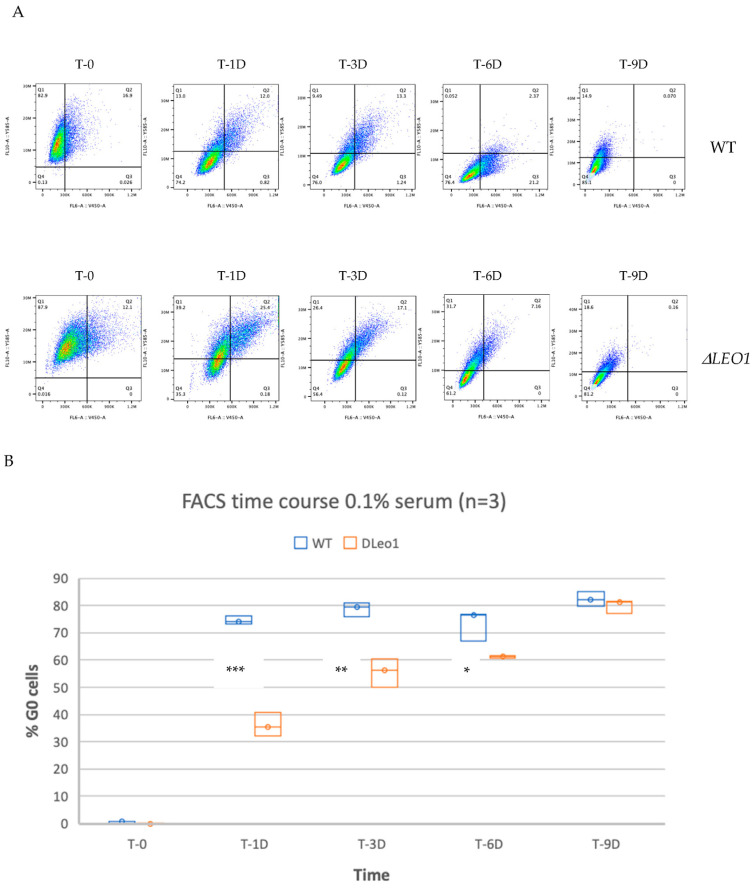
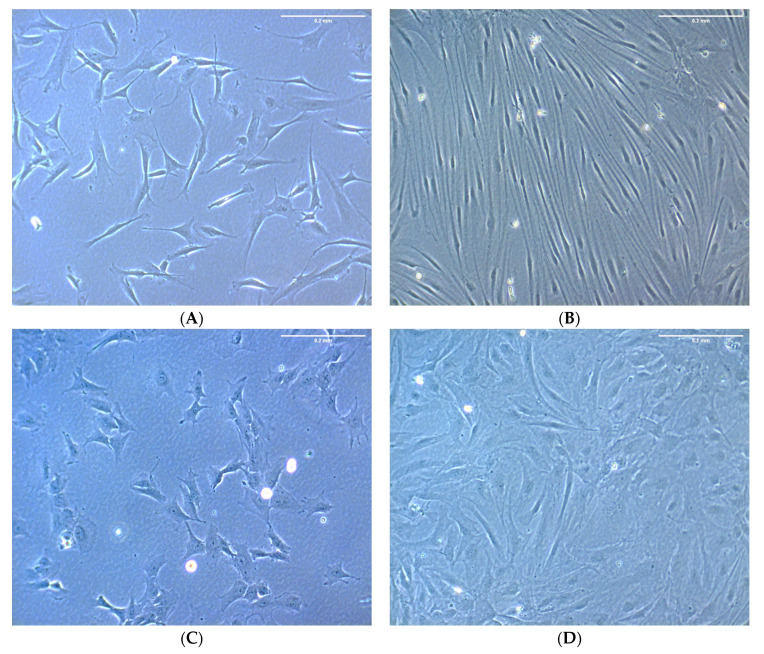
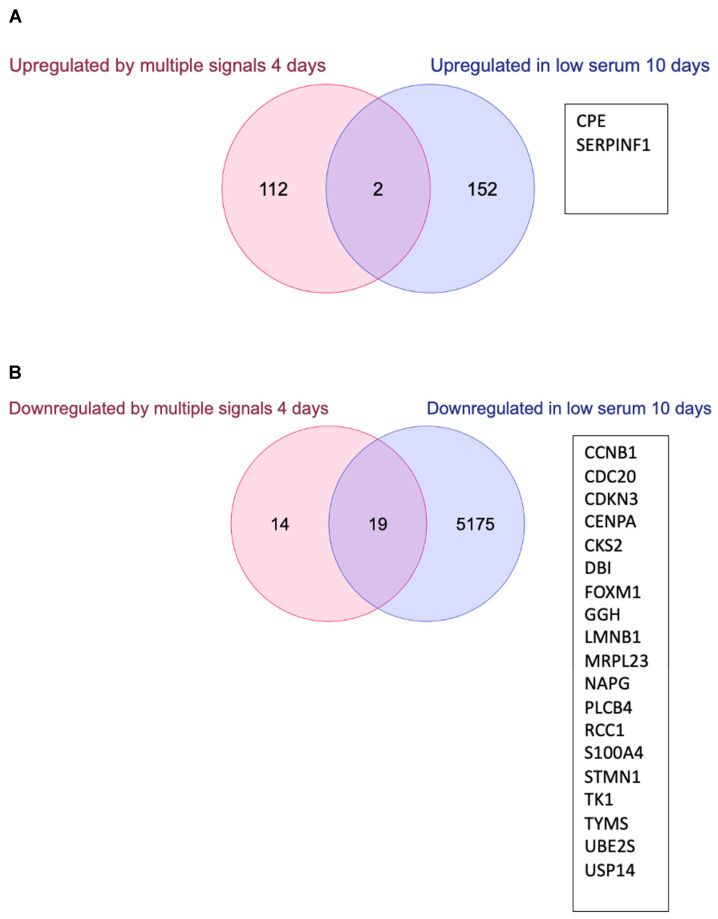
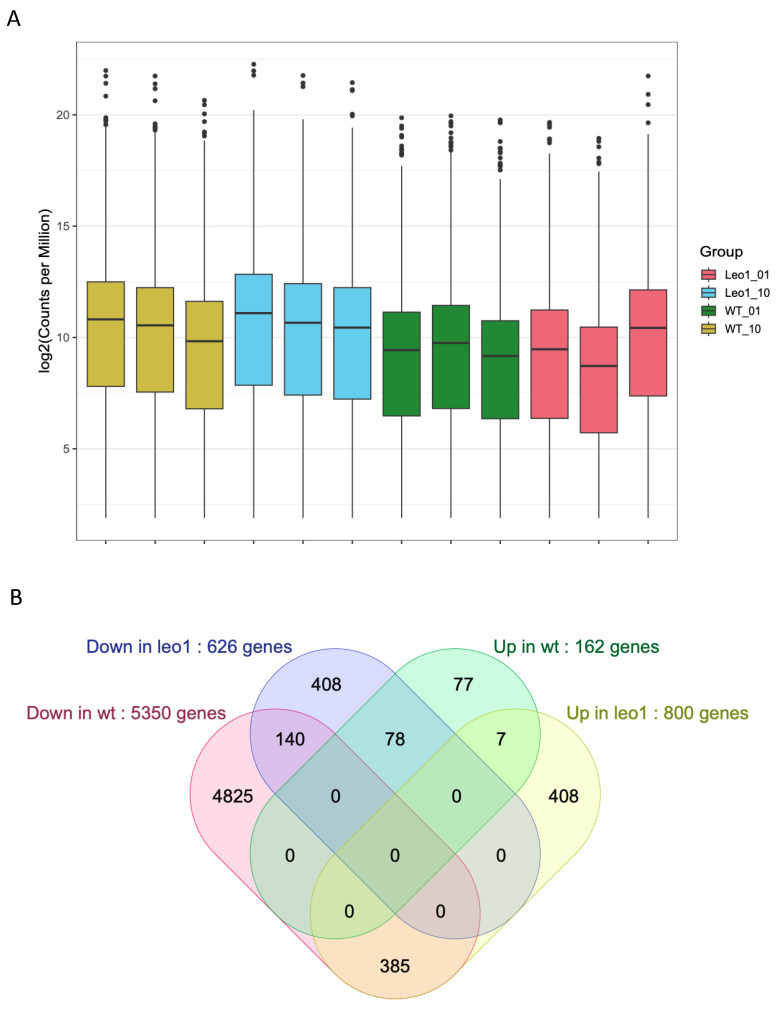
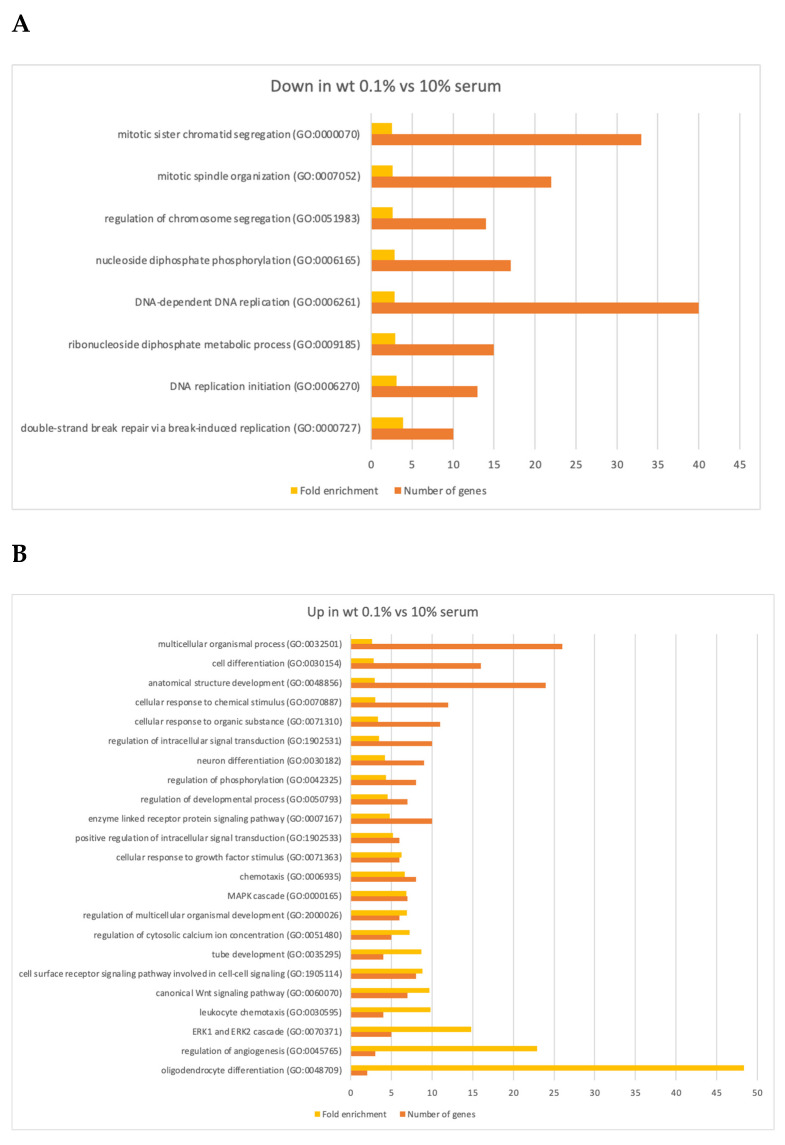
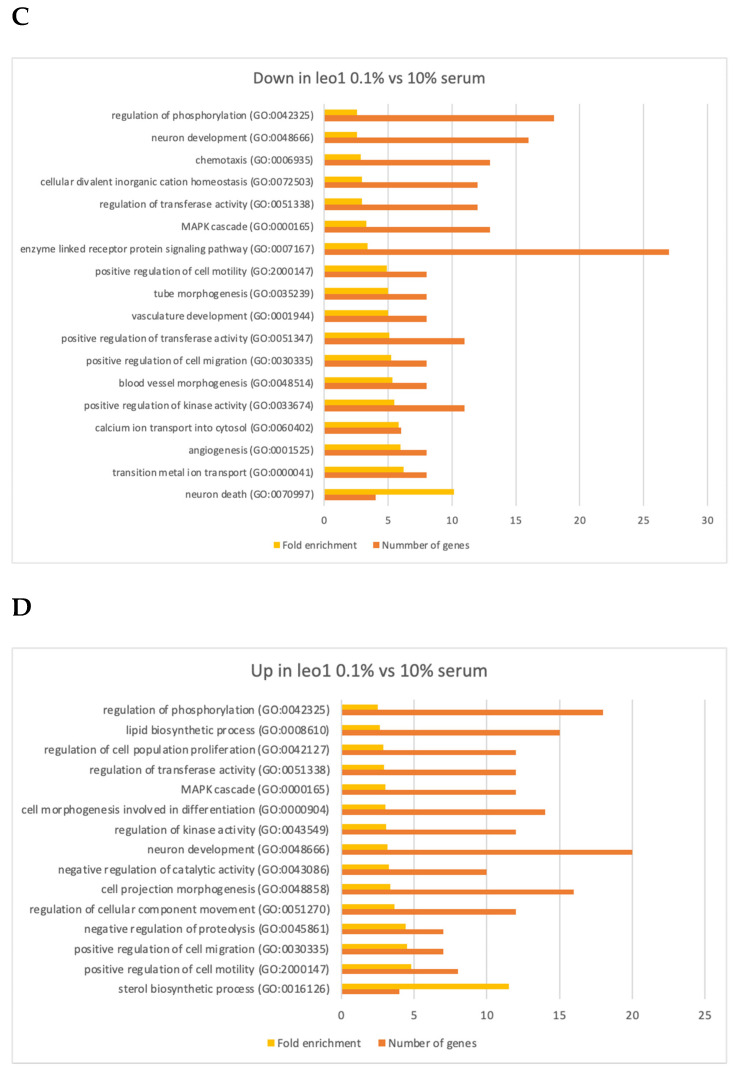
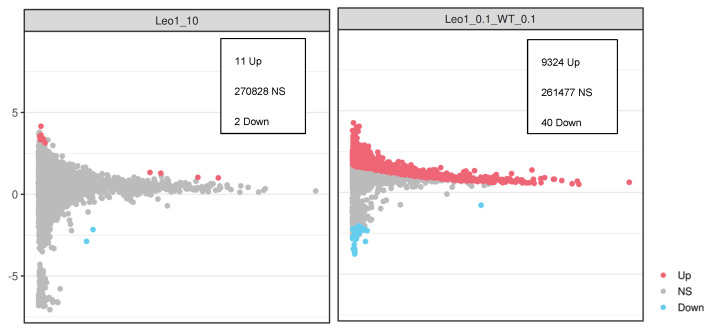
(1) Background: The LEO1 (Left open reading frame 1) protein is a conserved subunit of the PAF1C complex (RNA polymerase II-associated factor 1 complex). PAF1C has well-established mechanistic functions in elongation of transcription and RNA processing. We previously showed, in fission yeast, that LEO1 controls histone H3K9 methylation levels by affecting the turnover of histone H3 in chromatin, and that it is essential for the proper regulation of gene expression during cellular quiescence. Human fibroblasts enter a reversible quiescence state upon serum deprivation in the growth media. Here we investigate the function of LEO1 in human fibroblasts. (2) Methods: We knocked out the LEO1 gene using CRISPR/Cas9 methodology in human fibroblasts and verified that the LEO1 protein was undetectable by Western blot. We characterized the phenotype of the ΔLEO1 knockout cells with FACS analysis and cell growth assays. We used RNA-sequencing using spike-in controls to measure gene expression and spike-in controlled ChIP-sequencing experiments to measure the histone modification H3K9me2 genome-wide. (3) Results: Gene expression levels are altered in quiescent cells, however factors controlling chromatin and gene expression changes in quiescent human cells are largely unknown. The ΔLEO1 knockout fibroblasts are viable but have reduced metabolic activity compared to wild-type cells. ΔLEO1 cells showed a slower entry into quiescence and a different morphology compared to wild-type cells. Gene expression was generally reduced in quiescent wild-type cells. The downregulated genes included genes involved in cell proliferation. A small number of genes were upregulated in quiescent wild-type cells including several genes involved in ERK1/ERK2 and Wnt signaling. In quiescent ΔLEO1 cells, many genes were mis-regulated compared to wild-type cells. This included genes involved in Calcium ion transport and cell morphogenesis. Finally, spike-in controlled ChIP-sequencing experiments demonstrated that the histone modification H3K9me2 levels are globally increased in quiescent ΔLEO1 cells. (4) Conclusions: Thus, LEO1 is important for proper entry into cellular quiescence, control of H3K9me2 levels, and gene expression in human fibroblasts.

Keywords: H3K9me2; LEO1; PAF1C; cellular quiescence; chromatin; fibroblasts; gene expression; histone modification.


Conflict of interest statement

The authors have no conflict of interests and no competing interest.

Figures

Figure 1
Figure 1
Confirmation of CRISPR-Cas9-mediated LEO1 knockout. The LEO1 knockout cell line was generated by CRISPR-Cas9 in Bj-5ta fibroblasts and confirmed by immunoblotting. Three candidates were chosen to validate the knockout and clone 13 was selected for further experiments in this study. The Reh cell line was included as a positive control since it overexpresses LEO1. Original western blot can be found in Figure S1.
Figure 2
Figure 2
Slow entry of ΔLEO1 cells in quiescence. Cells were stained with Hoechst to detect DNA and Pyronin Y to detect RNA. (A) FACS analysis of wild type (top panel) and ΔLEO1 cells (bottom panel). The RNA content is shown on the Y-axis and the DNA content is shown on the X-axis. The G0 arrested cells are scored in the Q4 region of the diagram. (B) Quantitation of quiescent (G0 arrested) cells from the FACS time course experiment represented as a box plot. In each box, the median value is indicated by the horizontal black line inside the box. The top and the bottom of the box are the 75 and 25 percentiles respectively. Significant changes are indicated by * (two-sided t-test; p < 0.02) ** (2-sided t-test; p < 0.01) and *** (two-sided t-test; p < 0.001).
Figure 3
Figure 3
Bj-5ta wild type and ΔLEO1 morphology were examined under a light-inverted microscope. (A,C) Cell morphology was observed after culturing Bj-5ta wild type (A) and ΔLEO1 (C) in a medium with 10% serum (before shift to 0.1% serum). (B,D) Cell morphology was observed after incubating Bj-5ta wild type (B) and ΔLEO1 (D) in a medium with 0.1% serum ten days after the shift. Size bar = 0.2 mm.
Figure 4
Figure 4
Gene expression changes in serum-starved cells (wt cells grown in 0.1% serum for 10 days compared to wt cells grown in 10% serum) and comparison to quiescence genes regulated by multiple signals after 4 days. Venn diagrams comparing previously defined genes upregulated (A) and downregulated (B) in quiescence induced by multiple signals after 4 days and low serum conditions after 10 days identified by this study. Gene names for genes in the intersections are shown.
Figure 5
Figure 5
(A) ERCC spike-in normalized RNA-seq. The box plots show triplicate RNA-seq samples as log2 values of numbers of normalized sequence reads (Y-axis) in wild-type cells and in ΔLEO1 cells cultivated in 10% or 0.1% serum as indicated (Leo1_01; Leo1_10; WT_01; WT_10). In each box, the median value is indicated by the horizontal black line inside the box. The top and the bottom of the box are the 75 and 25 percentiles respectively. The vertical line outside each box indicates the variation of the data and the dots are the outliers. (B) Venn diagrams comparing the list of downregulated (Down) and upregulated (Up) genes in wt (0.1% serum) compared to wt (10% serum) and in ΔLEO1 cells grown in 0.1% serum compared to wt (0.1% serum).
Figure 6
Figure 6
Summarized results from gene ontology analysis (PANTHER GO-Slim) of affected biological processes in RNA-seq experiment with wild-type cells and in ΔLEO1 cells cultivated in 10% or 0.1% serum. (A) Significant GO terms for 5350 genes downregulated in wt (0.1% serum) vs. wt (10% serum). (B) Significant GO terms for 162 genes upregulated in wt (0.1% serum) vs. wt (10% serum). (C) Significant GO terms for 626 genes downregulated in ΔLEO1 (0.1% serum) vs. ΔLEO1 (10% serum). (D) Significant GO terms for 800 genes upregulated in ΔLEO1 (0.1% serum) vs. ΔLEO1 (10% serum). (AD) Redundant GO terms have been omitted. Minimum fold enrichment = 2.5. The complete GO analysis results are shown in Supplementary Data.
Figure 6
Figure 6
Summarized results from gene ontology analysis (PANTHER GO-Slim) of affected biological processes in RNA-seq experiment with wild-type cells and in ΔLEO1 cells cultivated in 10% or 0.1% serum. (A) Significant GO terms for 5350 genes downregulated in wt (0.1% serum) vs. wt (10% serum). (B) Significant GO terms for 162 genes upregulated in wt (0.1% serum) vs. wt (10% serum). (C) Significant GO terms for 626 genes downregulated in ΔLEO1 (0.1% serum) vs. ΔLEO1 (10% serum). (D) Significant GO terms for 800 genes upregulated in ΔLEO1 (0.1% serum) vs. ΔLEO1 (10% serum). (AD) Redundant GO terms have been omitted. Minimum fold enrichment = 2.5. The complete GO analysis results are shown in Supplementary Data.
Figure 7
Figure 7
Chip-seq analysis of H3K9me2 levels in proliferating and quiescent cells. Moving average plots showing the significant changes of H3K9me2 detected in different comparisons. A 200 bp sliding window was used to count the number of reads every 50 bp across the whole genome. Merging windows that are overlapping to a single region. The numbers indicate regions found significant after multiple hypothesis testing (FDR). Regions were judged as significant if the adjusted p-value was under 0.05. The number of regions with increased levels (Up) nonsignificant (NS) or reduced levels (Down) are indicated. The data was normalized using the Drosophila spike-in procedure. The log fold change is shown on the Y axis and the log CPM is shown on the X-axis. (left) Leo1_10 indicates ΔLEO1 cells compared to WT cells both grown in 10% serum; (right) Leo1_0.1_WT_0.1 indicates ΔLEO1 cells compared to WT cells both in 0.1% serum.
Figure 8
Figure 8
Box-plot comparisons of gene expression levels regions with significant H3K9me2 changes in ΔLEO1 vs. WT. Gene expression changes in ΔLEO1 vs. WT both grown in 0.1% serum, are shown on the Y-axis (Log fold change). H3K9me2 ChIP-seq reads were counted at all annotated TSS regions in a +/- 1 kb window. Regions were judged as significant if the adjusted p-value was under 0.05. The data was normalized using the Drosophila spike-in procedure. X-axis: 133 TSS regions had reduced levels (Down; p < 0.05), 198,626 regions were nonsignificant (NS) and 38,942 had increased levels (Up; p < 0.05).

Similar articles

Cited by

  • The Wild West of spike-in normalization.
    Patel LA, Cao Y, Mendenhall EM, Benner C, Goren A. Patel LA, et al. Nat Biotechnol. 2024 Sep;42(9):1343-1349. doi: 10.1038/s41587-024-02377-y. Nat Biotechnol. 2024. PMID: 39271835 Free PMC article.

References

    1. Marescal O., Cheeseman I.M. Cellular Mechanisms and Regulation of Quiescence. Dev. Cell. 2020;55:259–271. doi: 10.1016/j.devcel.2020.09.029. - DOI - PMC - PubMed
    1. Chen W., Dong J., Haiech J., Kilhoffer M.-C., Zeniou M. Cancer Stem Cell Quiescence and Plasticity as Major Challenges in Cancer Therapy. Stem Cells Int. 2016;2016:1740936. doi: 10.1155/2016/1740936. - DOI - PMC - PubMed
    1. Sun S., Gresham D. Cellular Quiescence in Budding Yeast. Yeast. 2020;38:12–29. doi: 10.1002/yea.3545. - DOI - PMC - PubMed
    1. Iyer V.R., Eisen M.B., Ross D.T., Schuler G., Moore T., Lee J.C.F., Trent J.M., Staudt L.M., Hudson J.H., Jr., Boguski M.S., et al. The Transcriptional Program in the Response of Human Fibroblasts to Serum. Science. 1999;283:83–87. doi: 10.1126/science.283.5398.83. - DOI - PubMed
    1. Coller H.A., Sang L., Roberts J.M. A New Description of Cellular Quiescence. PLoS Biol. 2006;4:e83. doi: 10.1371/journal.pbio.0040083. - DOI - PMC - PubMed

Publication types