. 2023 Nov 20;13(11):1672.
doi: 10.3390/biom13111672.

The Molecular Basis for Selectivity of the Cytotoxic Response of Lung Adenocarcinoma Cells to Cold Atmospheric Plasma

Affiliations

The Molecular Basis for Selectivity of the Cytotoxic Response of Lung Adenocarcinoma Cells to Cold Atmospheric Plasma

Mikhail Biryukov et al. Biomolecules. .

Abstract

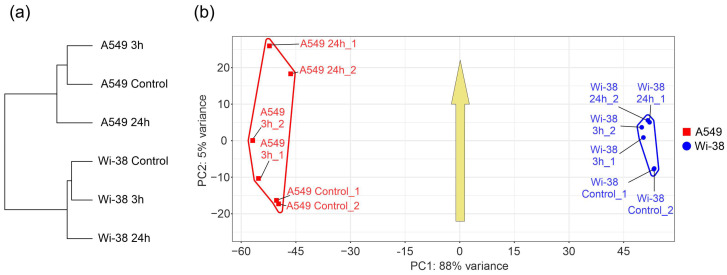
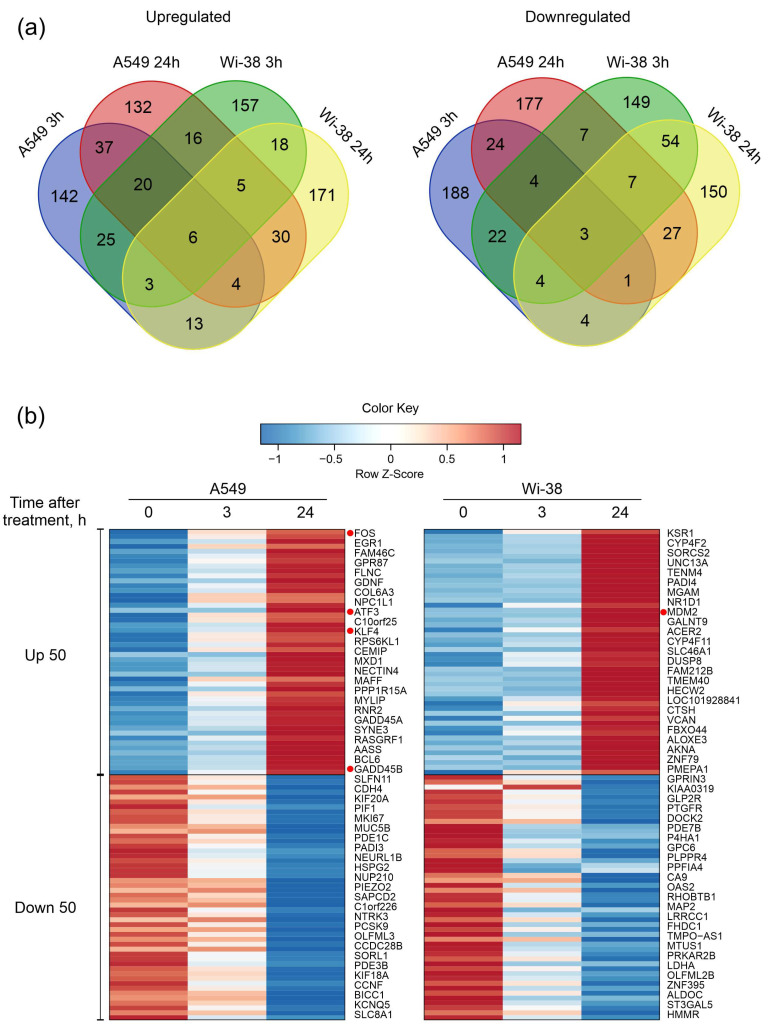
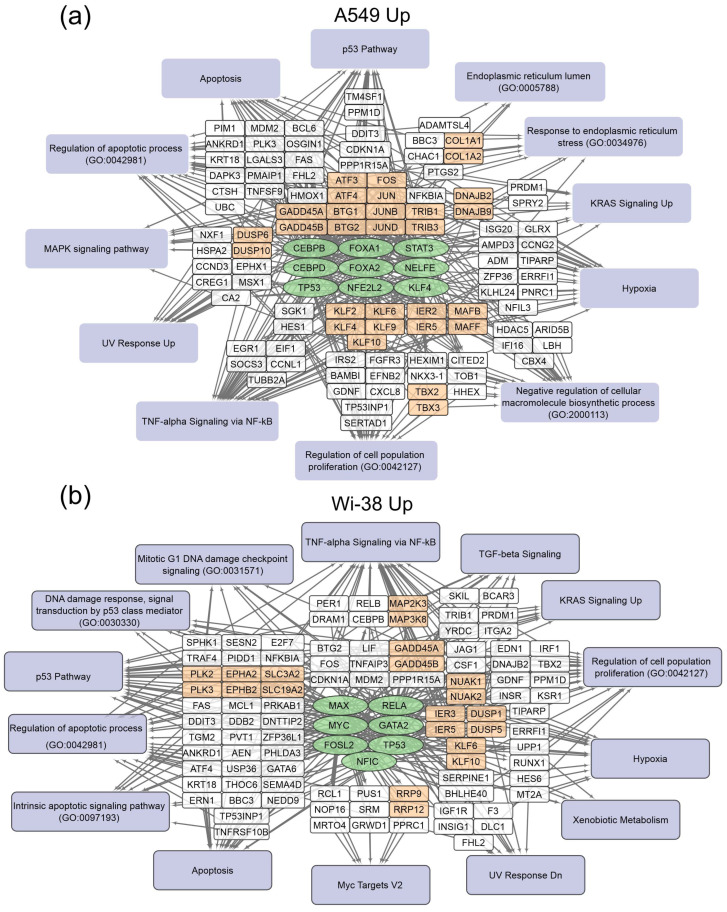
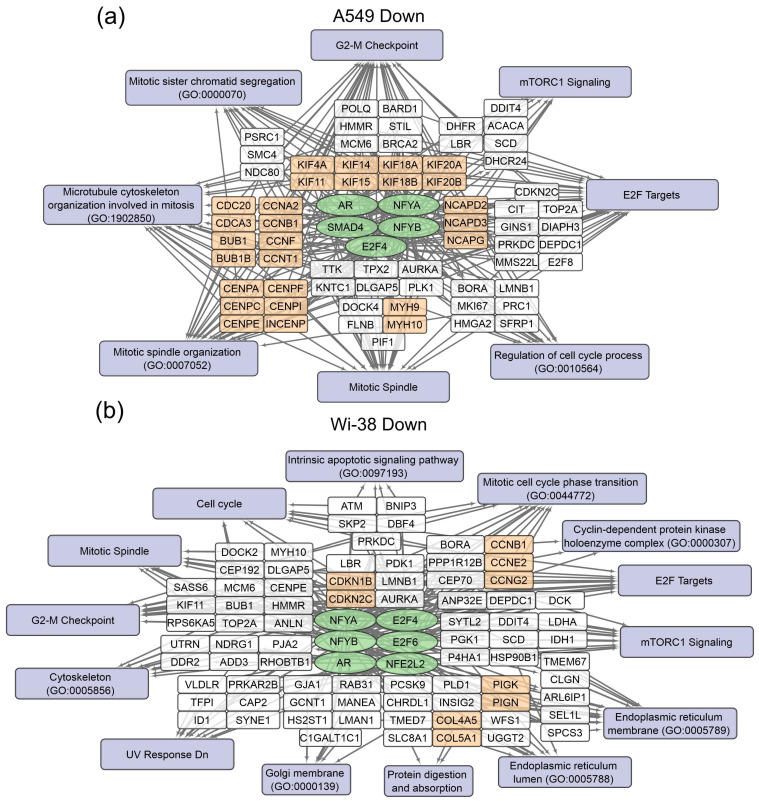
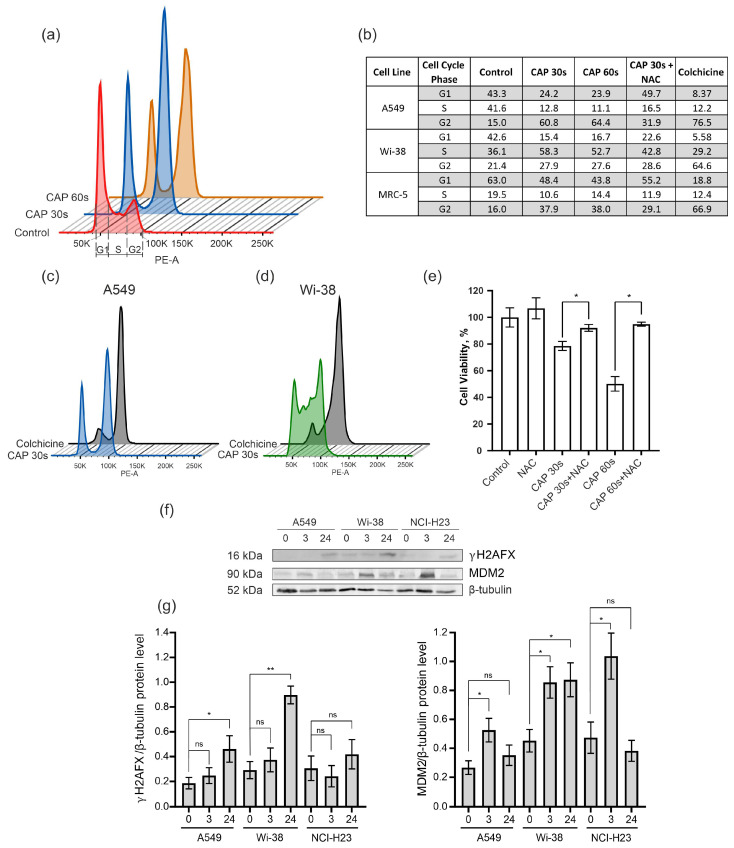
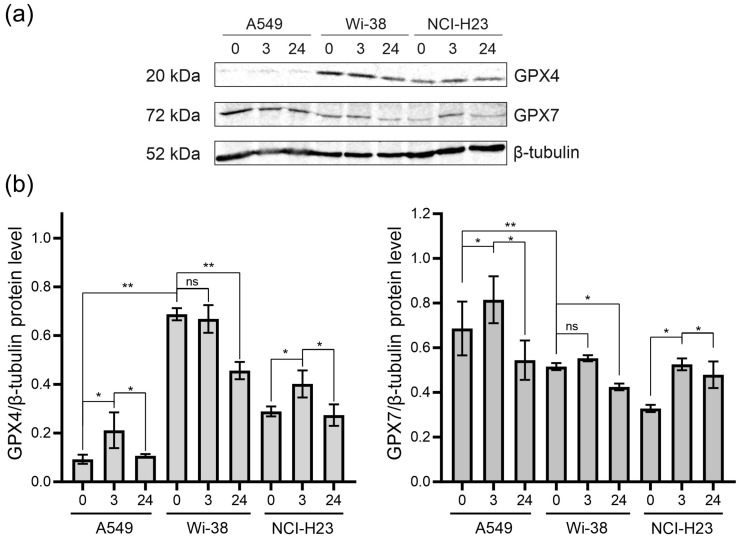
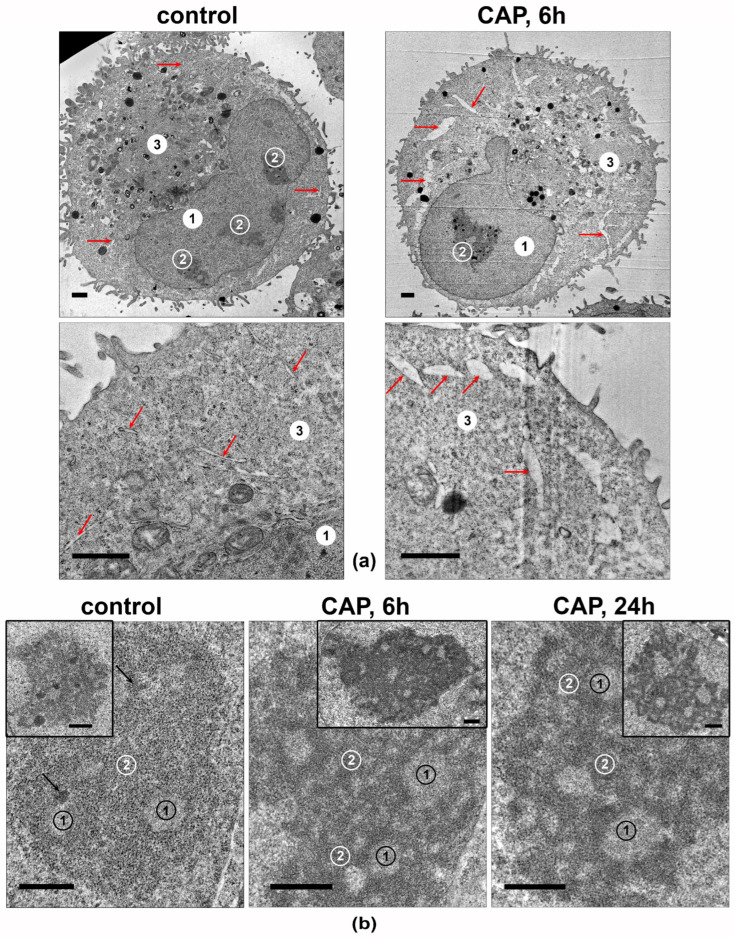
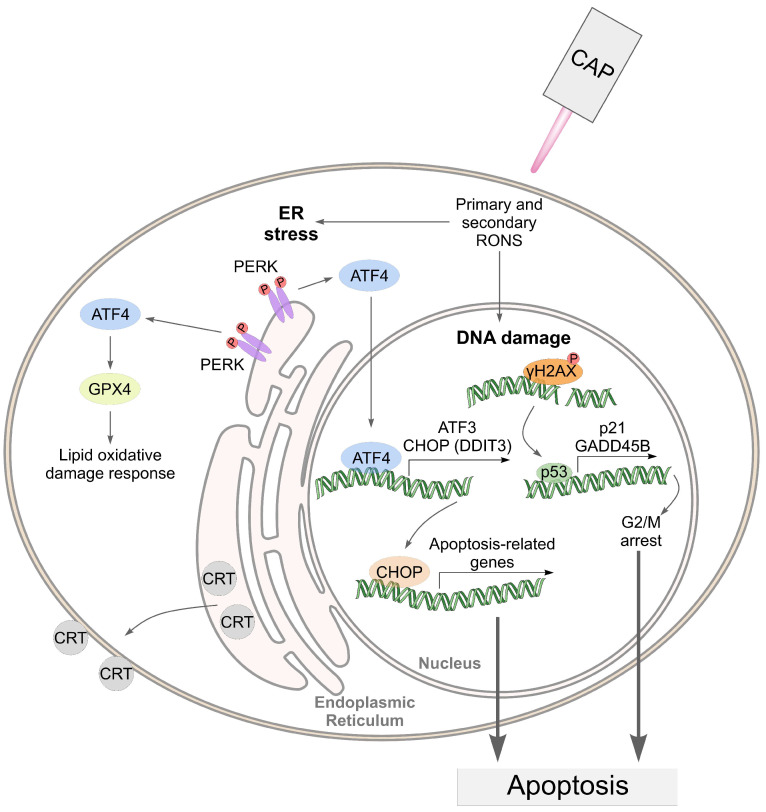
The interaction of cold atmospheric plasma (CAP) with biotargets is accompanied by chemical reactions on their surfaces and insides, and it has great potential as an anticancer approach. This study discovers the molecular mechanisms that may explain the selective death of tumor cells under CAP exposure. To reach this goal, the transcriptional response to CAP treatment was analyzed in A549 lung adenocarcinoma cells and in lung-fibroblast Wi-38 cells. We found that the CAP treatment induced the common trend of response from A549 and Wi-38 cells-the p53 pathway, KRAS signaling, UV response, TNF-alpha signaling, and apoptosis-related processes were up-regulated in both cell lines. However, the amplitude of the response to CAP was more variable in the A549 cells. The CAP-dependent death of A549 cells was accompanied by DNA damage, cell-cycle arrest in G2/M, and the dysfunctional response of glutathione peroxidase 4 (GPx4). The activation of the genes of endoplasmic reticulum stress and ER lumens was detected only in the A549 cells. Transmission-electron microscopy confirmed the alteration of the morphology of the ER lumens in the A549 cells after the CAP exposure. It can be concluded that the responses to nuclear stress and ER stress constitute the main differences in the sensitivity of tumor and healthy cells to CAP exposure.

Keywords: GADD45; GPx4; cell-cycle arrest; cold atmospheric plasma; endoplasmic reticulum stress; p53 pathway; transcriptome analysis.


Conflict of interest statement

The authors declare no conflict of interest.

Figures

Figure 1
Figure 1
Plasma–source design and CAP jet characteristics. (a) Plasma–source design, (b) current (purple) and voltage (green) oscillograms. (c) CAP spectra in helium. The inset shows a part of the spectrum with peaks of OH.
Figure 2
Figure 2
Relationships between individual transcriptomes and groups of transcriptomes of Wi-38 and A549 cells, treated with CAP for 1 min and cultivated for 3 h and 24 h. (a) A tree of Euclidean distances of variance stabilizing transformed (VST) RNA-expression data of Wi-38 and A549 cells. The complete agglomeration method was used for clustering. (b) Principal component analysis of DESeq2-normalized VST-transformed RNA-expression data. Sample-specific PC1:PC2 points are annotated with cell-defined envelopes. The yellow arrow shows the common trend of PC1:PC2 transition from non-treated (control) or treated with CAP and cultivated for 3 h and 24 h.
Figure 3
Figure 3
Characterization of differentially expressed gene (DEG) sets of A549 cancer cells and normal Wi-38 cells. (a) Venn diagrams showing intersections of DEGs sets, separately for RNAs with increased (Up-regulated) or decreased (Down-regulated) levels in CAP-treated compared to the corresponding non-treated cells. (b) Heatmap of the 50 most variable up-regulated and down-regulated differentially expressed genes in Wi38 and A549 cells. Transcripts discussed in the text are highlighted with red dots.
Figure 4
Figure 4
Schemes of the relationship between transcripts, transcription factors, and processes activated in A549 (a) and Wi-38 (b) cells upon treatment with CAP. Activated transcription factors are shown in green ovals; selected activated genes are in white and orange rectangles; signaling pathways, biological processes, and gene annotations are in lilac rectangles. Groups of genes with similar functions are drawn together. Based on the analysis of the top 250 activated genes using Enrichr libraries: “ENCODE and ChEA Consensus TFs from ChIP-X”; “MSigDB Hallmark 2020”; “GO Biologic Process 2021”; “Panther 2016”; and “KEGG 2021 Human”.
Figure 5
Figure 5
Schemes of the relationship between transcripts, transcription factors, and processes down-regulated in A549 (a) and Wi-38 (b) cells upon treatment with CAP. Down-regulated transcription factors are shown in green ovals; selected activated genes are in white and orange rectangles; signaling pathways, biological processes, and gene annotations are in lilac rectangles. Groups of genes with similar functions are drawn together. Based on the analysis of the top 250 activated genes using Enrichr libraries: “ENCODE and ChEA Consensus TFs from ChIP-X”; “MSigDB Hallmark 2020”; “GO Biologic Process 2021”; “Panther 2016”; and “KEGG 2021 Human”.
Figure 6
Figure 6
Analysis of mRNA levels of KLF4, FOS, ATF3, and GADD45B and protein levels of ATF3 and GADD45B in CAP-exposed cells (helium plasma jet, 3.3 kV fU = 52 kHz). (a) RT-PCR data and (b) Western blot data. (c) The quantification of protein band intensities from two independent Western blot experiments. The original Western blot images of (b) can be found in Figure S1. * p < 0.05, ** p < 0.005, ns—non significant.
Figure 7
Figure 7
Effect of CAP treatment on the cell cycle. (ae) The A549, Wi-38, and MRC-5 cells were treated with CAP for 30 s and 60 s (helium plasma jet, 3.3 kV fU = 52 kHz); 24 h later, cells were fixed and stained, as described in Methods. Control—untreated cells. (a) An example analysis of A549 cells with G1, S, and G2. (b) The distribution of cells in a particular phase of the cell cycle. (c,d) Example of analysis of CAP-treated A549 cells and Wi-38 cells compared to colchicine treatment. (e) The influence of NAC on viability of A549 cells 24 h after the CAP treatment. (f) Representative image of Western blot analysis of A549, Wi-38, and H23 cells and (g) quantifications of the signals corresponding to γH2A.X and MDM2. Control—untreated cells. Data are presented as average value ± SD. The differences are significant with * p < 0.05 and ** p < 0.005 between two groups; ns—non-significant. The original Western blot images of (f) can be found in Figure S1.
Figure 8
Figure 8
The GPX4 and GPX7 responses to the CAP treatment. The A549, Wi-38 and H23 cells were treated with CAP for 1 min (helium plasma jet, 3.3 kV fU = 52 kHz); 3 h and 24 h later, cell lysates were prepared and GPX4 and GPX7 were analyzed by Western blot, as described in Methods. Representative image of Western blot analysis (a) and quantifications of the signals corresponding to GPX4 (b) and GPX7. Control—untreated cells. The quantification of protein band intensities from two independent Western blot experiments was performed with Image Lab5.1 (BioRad). The signal intensity was normalized to the loading-control signal (tubulin). Data are presented as average value ± SD. The differences are significant with * p < 0.05 and ** p < 0.005 between two groups; ns—non-significant. The original Western blot images of (a) can be found in Figure S1.
Figure 9
Figure 9
Transmission-electron micrographs showing the ultrastructures of A549 cells. Samples of control and CAP-exposed cells (helium plasma jet, 3.3 kV fU = 50 kHz). (a) Representative images of cells and their fragments. 1—nucleus, 2—nucleolus, 3—cytoplasm; arrows indicate ER lumens. (b) Representative images of nucleoli in CAP-treated A549 cells. The inserts show the full view of the nucleoli. 1—fibrillar center. 2—granular component; arrows indicate electron-dense fibrillar component. Ultrathin sections with scale bar = 1 µm (a) and scale bar = 500 nm (b).
Figure 10
Figure 10
Direct CAP treatment of the growing cells increases the extracellular nitrite-ion levels. The A549 and Wi-38 cells were treated with CAP for 1 min and 2 min (helium plasma jet, 3.3 kV fU = 52 kHz); 30 min–4 h later, culture medium was collected and analyzed in Griess reaction by spectrophotometric method (λ = 570 nm). Control—culture medium of growing cells without treatment. Data are presented as average value of four technical repeats ± SD. The differences are significant with * p < 0.05 between two groups. (+) and (#) p < 0.05 between the same two groups in A549 and Wi-38 cells.
Figure 11
Figure 11
An illustration of the death-related pathways that can be activated by cold atmospheric plasma (CAP) in cancer cells.

Similar articles

Cited by

References

    1. Welz C., Emmert S., Canis M., Becker S., Baumeister P., Shimizu T., Morfill G.E., Harréus U., Zimmermann J.L. Cold Atmospheric Plasma: A Promising Complementary Therapy for Squamous Head and Neck Cancer. PLoS ONE. 2015;10:e0141827. doi: 10.1371/journal.pone.0141827. - DOI - PMC - PubMed
    1. Golubitskaya E.A., Troitskaya O.S., Yelak E.V., Gugin P.P., Richter V.A., Schweigert I.V., Zakrevsky D.E., Koval O.A. Cold Physical Plasma Decreases the Viability of Lung Adenocarcinoma Cells. Acta Nat. 2019;11:16–19. doi: 10.32607/20758251-2019-11-3-16-19. - DOI - PMC - PubMed
    1. Patrakova E., Biryukov M., Troitskaya O., Gugin P., Milakhina E., Semenov D., Poletaeva J., Ryabchikova E., Novak D., Kryachkova N., et al. Chloroquine Enhances Death in Lung Adenocarcinoma A549 Cells Exposed to Cold Atmospheric Plasma Jet. Cells. 2023;12:290. doi: 10.3390/cells12020290. - DOI - PMC - PubMed
    1. Schweigert I., Zakrevsky D., Gugin P., Yelak E., Golubitskaya E., Troitskaya O., Koval O. Interaction of Cold Atmospheric Argon and Helium Plasma Jets with Bio-Target with Grounded Substrate Beneath. Appl. Sci. 2019;9:4528. doi: 10.3390/app9214528. - DOI
    1. Troitskaya O., Golubitskaya E., Biryukov M., Varlamov M., Gugin P., Milakhina E., Richter V., Schweigert I., Zakrevsky D., Koval O. Non-Thermal Plasma Application in Tumor-Bearing Mice Induces Increase of Serum HMGB1. Int. J. Mol. Sci. 2020;21:5128. doi: 10.3390/ijms21145128. - DOI - PMC - PubMed

Publication types