

The Influence of Different Inter-Trial Intervals on the Quantification of Intracortical Facilitation in the Primary Motor Cortex
- PMID: 38002401
- PMCID: PMC10669180
- DOI: 10.3390/bioengineering10111278
The Influence of Different Inter-Trial Intervals on the Quantification of Intracortical Facilitation in the Primary Motor Cortex
Abstract
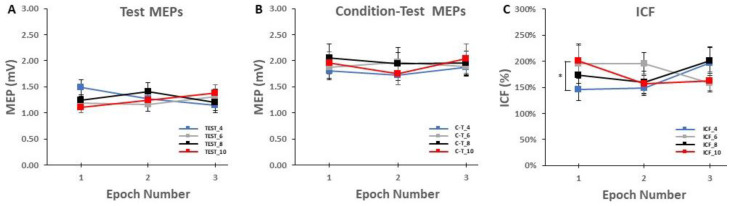
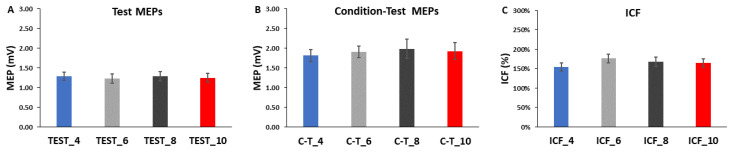
Intracortical facilitation (ICF) is a paired-pulse transcranial magnetic stimulation (TMS) measurement used to quantify interneuron activity in the primary motor cortex (M1) in healthy populations and motor disorders. Due to the prevalence of the technique, most of the stimulation parameters to optimize ICF quantification have been established. However, the underappreciated methodological issue of the time between ICF trials (inter-trial interval; ITI) has been unstandardized, and different ITIs have never been compared in a paired-pulse TMS study. This is important because single-pulse TMS studies have found motor evoked potential (MEP) amplitude reductions over time during TMS trial blocks for short, but not long ITIs. The primary purpose was to determine the influence of different ITIs on the measurement of ICF. Twenty adults completed one experimental session that involved 4 separate ICF trial blocks with each utilizing a different ITI (4, 6, 8, and 10 s). Two-way ANOVAs indicated no significant ITI main effects for test MEP amplitudes, condition-test MEP amplitudes, and therefore ICF. Accordingly, all ITIs studied provided nearly identical ICF values when averaged over entire trial blocks. Therefore, it is recommended that ITIs of 4-6 s be utilized for ICF quantification to optimize participant comfort and experiment time efficiency.
Keywords: electromyography; intracortical facilitation; motor evoked potential; short-interval intracortical inhibition; transcranial magnetic stimulation.
Conflict of interest statement
The authors declare no conflict of interest.
Figures


Similar articles
-
Exploring the Influence of Inter-Trial Interval on the Assessment of Short-Interval Intracortical Inhibition.Bioengineering (Basel). 2024 Jun 25;11(7):645. doi: 10.3390/bioengineering11070645. Bioengineering (Basel). 2024. PMID: 39061727 Free PMC article.
-
Longer Transcranial Magnetic Stimulation Intertrial Interval Increases Size, Reduces Variability, and Improves the Reliability of Motor Evoked Potentials.Brain Connect. 2019 Dec;9(10):770-776. doi: 10.1089/brain.2019.0714. Brain Connect. 2019. PMID: 31744309
-
Modulation of the cortical silent period elicited by single- and paired-pulse transcranial magnetic stimulation.BMC Neurosci. 2013 Apr 2;14:43. doi: 10.1186/1471-2202-14-43. BMC Neurosci. 2013. PMID: 23547559 Free PMC article.
-
Normal parameters for diagnostic transcranial magnetic stimulation using a parabolic coil with biphasic pulse stimulation.BMC Neurol. 2022 Dec 31;22(1):510. doi: 10.1186/s12883-022-02977-8. BMC Neurol. 2022. PMID: 36585660 Free PMC article.
-
Strength-Duration Relationship in Paired-pulse Transcranial Magnetic Stimulation (TMS) and Its Implications for Repetitive TMS.Brain Stimul. 2016 Sep-Oct;9(5):755-761. doi: 10.1016/j.brs.2016.04.019. Epub 2016 Apr 28. Brain Stimul. 2016. PMID: 27234142
Cited by
-
Exploring the Influence of Inter-Trial Interval on the Assessment of Short-Interval Intracortical Inhibition.Bioengineering (Basel). 2024 Jun 25;11(7):645. doi: 10.3390/bioengineering11070645. Bioengineering (Basel). 2024. PMID: 39061727 Free PMC article.
-
Special Issue "Electric, Magnetic, and Electromagnetic Fields in Biology and Medicine: From Mechanisms to Biomedical Applications: 2nd Edition".Bioengineering (Basel). 2025 Jul 7;12(7):739. doi: 10.3390/bioengineering12070739. Bioengineering (Basel). 2025. PMID: 40722431 Free PMC article.
References
LinkOut - more resources
Full Text Sources
