. 2023 Oct 25;13(11):1509.
doi: 10.3390/brainsci13111509.

Gradual Loss of Social Group Support during Competition Activates Anterior TPJ and Insula but Deactivates Default Mode Network

Affiliations

Gradual Loss of Social Group Support during Competition Activates Anterior TPJ and Insula but Deactivates Default Mode Network

Burcu Ozkul et al. Brain Sci. .

Abstract

Group forming behaviors are common in many species to overcome environmental challenges. In humans, bonding, trust, group norms, and a shared past increase consolidation of social groups. Being a part of a social group increases resilience to mental stress; conversely, its loss increases vulnerability to depression. However, our knowledge on how social group support affects brain functions is limited. This study observed that default mode network (DMN) activity reduced with the loss of social group support from real-life friends in a challenging social competition. The loss of support induced anterior temporoparietal activity followed by anterior insula and the dorsal attentional network activity. Being a part of a social group and having support provides an environment for high cognitive functioning of the DMN, while the loss of group support acts as a threat signal and activates the anterior temporoparietal junction (TPJ) and insula regions of salience and attentional networks for individual survival.

Keywords: default mode network; salience network; social group; social support.


Conflict of interest statement

The authors declare no conflict of interest.

Figures

Figure 1
Figure 1
Task Outline. The task begins with a fixed cross for 3 s. Subjects are asked to guess the number of squares in 3 s in a picture with different numbers of various geometrical shapes. After providing their answer, the subjects see an hourglass for 6 s, indicating 10 points being distributed by the referees (anticipating stage). At stage 5, the subjects see both their own and the rivals’ screenshots, and the distribution of the points by the jury. A green checkmark indicates a correct answer, and a red cross indicates a wrong one (the example shows a biased response for the subject even though both competitors had correct answers). The last image shows the distribution of earnings.
Figure 2
Figure 2
Hot and cool colors show increased and decreased BOLD signals during gradual social support loss at the fair (a) and ostracism phases (b) compared to HSP. The reduced activity in the DMN regions (mPFC, PCC, angular gyrus-posterior temporoparietal junction) and middle temporal cortex observed in the fair phase persisted in the ostracism phase. Gradual activity increase was observed in the supramarginal gyrus (anterior temporoparietal junction), dorsal parietal cortex, dlPFC (BA 10), and visual cortical areas with the loss of social support during fair and ostracism phases. Increased caudate/putamen nucleus (ventral striatum) and insula activity was observed during the ostracism phase. All images are neurological conventions. For illustrative purposes statistical maps are displayed with a threshold of p < 0.07 FEW and superimposed on a MNI template.
Figure 3
Figure 3
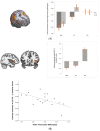
(A). Compared to HSP, we observed increased activity in the bilateral supramarginal gyrus in FP, which might be related to early environmental change in the game. (B). Anterior insula activity increased mainly with the social support loss in OP. Right anterior insula activity was negatively correlated with belonging to a group (r = −0.57 p < 0.05). For illustrative purposes statistical maps are displayed with a threshold of p < 0.07 FEW and superimposed on a MNI template. All images are neurological conventions.

References

    1. Phan T.V., Morris R., Black M.E., Do T.K., Lin K.-C., Nagy K., Sturm J.C., Bos J., Austin R.H. Bacterial Route Finding and Collective Escape in Mazes and Fractals. Phys. Rev. X. 2020;10:31017. doi: 10.1103/PhysRevX.10.031017. - DOI
    1. Müller A.E., Thalmann U. Origin and evolution of primate social organisation: A reconstruction. Biol. Rev. 2000;75:405–435. doi: 10.1017/S0006323100005533. - DOI - PubMed
    1. Shultz S., Opie C., Atkinson Q.D. Stepwise evolution of stable sociality in primates. Nature. 2011;479:219–222. doi: 10.1038/nature10601. - DOI - PubMed
    1. Frank M.G., Gilovich T. The Dark Side of Self- and Social Perception: Black Uniforms and Aggression in Professional Sports. J. Pers. Soc. Psychol. 1988;54:74–85. doi: 10.1037/0022-3514.54.1.74. - DOI - PubMed
    1. Cikara M., Van Bavel J.J. The Neuroscience of Intergroup Relations: An Integrative Review. Perspect. Psychol. Sci. 2014;9:245–274. doi: 10.1177/1745691614527464. - DOI - PubMed

LinkOut - more resources