

The Efficacy of Cognitive Training on Neuropsychological Outcomes in Mild Cognitive Impairment: A Meta-Analysis
- PMID: 38002471
- PMCID: PMC10669748
- DOI: 10.3390/brainsci13111510
The Efficacy of Cognitive Training on Neuropsychological Outcomes in Mild Cognitive Impairment: A Meta-Analysis
Abstract
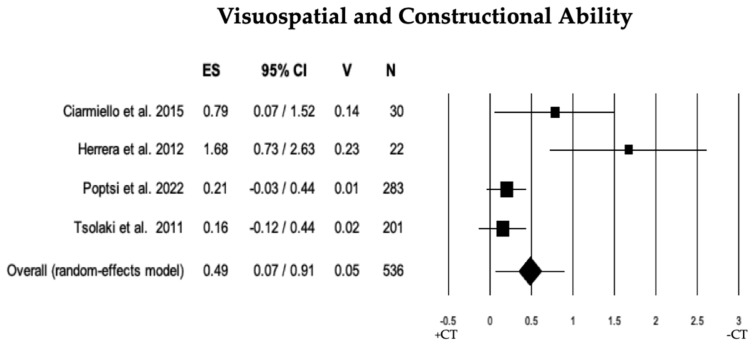
Mild cognitive impairment (MCI) or mild neurocognitive disorder is an intermediate stage of cognitive impairment between normal cognitive aging and dementia. Given the absence of effective pharmacological treatments for MCI, increasing numbers of studies are attempting to understand how cognitive training (CT) could benefit MCI. This meta-analysis aims to update and assess the efficacy of CT on specific neuropsychological test performance (global cognitive functioning, short-term verbal memory, long-term verbal memory, generativity, working memory, and visuospatial abilities) in individuals diagnosed with MCI, as compared to MCI control groups. After searching electronic databases for randomized controlled trials, 31 studies were found including 2496 participants. Results showed that CT significantly improved global cognitive functioning, short-term and long-term verbal memory, generativity, working memory, and visuospatial abilities. However, no significant effects were observed for shifting, abstraction ability/concept formation, processing speed, and language. The mode of CT had a moderating effect on abstraction ability/concept formation. The findings provide specific insights into the cognitive functions influenced by CT and guide the development of tailored interventions for MCI. While CT holds promise, further research is needed to address certain cognitive deficits and assess long-term effects on dementia progression.
Keywords: cognitive functions; cognitive training; meta-analysis; mild cognitive impairment; mild neurocognitive disorder.
Conflict of interest statement
The authors declare no conflict of interest.
Figures


Similar articles
-
The Efficacy of Cognitive Intervention in Mild Cognitive Impairment (MCI): a Meta-Analysis of Outcomes on Neuropsychological Measures.Neuropsychol Rev. 2017 Dec;27(4):440-484. doi: 10.1007/s11065-017-9363-3. Epub 2017 Dec 27. Neuropsychol Rev. 2017. PMID: 29282641 Free PMC article.
-
Neuropsychological Impairments and Their Cognitive Architecture in Mild Cognitive Impairment (MCI) with Lewy Bodies and MCI-Alzheimer's Disease.J Int Neuropsychol Soc. 2022 Oct;28(9):963-973. doi: 10.1017/S1355617721001181. Epub 2021 Oct 20. J Int Neuropsychol Soc. 2022. PMID: 34666864
-
The Neuropsychological Profile of Mild Cognitive Impairment in Lewy Body Dementias.J Int Neuropsychol Soc. 2020 Feb;26(2):210-225. doi: 10.1017/S1355617719001103. Epub 2019 Dec 12. J Int Neuropsychol Soc. 2020. PMID: 31826772
-
Effects of multi-component non-pharmacological interventions on cognition in participants with mild cognitive impairment: A systematic review and meta-analysis.Arch Gerontol Geriatr. 2022 Nov-Dec;103:104751. doi: 10.1016/j.archger.2022.104751. Epub 2022 Jun 18. Arch Gerontol Geriatr. 2022. PMID: 35839574 Review.
-
Cognitive performances and mild cognitive impairment in idiopathic rapid eye movement sleep behavior disorder: results of a longitudinal follow-up study.Sleep. 2013 Oct 1;36(10):1527-32. doi: 10.5665/sleep.3050. Sleep. 2013. PMID: 24082312 Free PMC article.
Cited by
-
Thinking About the Future of Cognitive Remediation Therapy Revisited: What Is Left to Solve Before Patients Have Access?Schizophr Bull. 2024 Aug 27;50(5):993-1005. doi: 10.1093/schbul/sbae075. Schizophr Bull. 2024. PMID: 38780191 Free PMC article.
-
The Effectiveness of VR-Based Cognitive Training Program for Mild Cognitive Impairment: A Pilot Study.Dement Neurocogn Disord. 2025 Jul;24(3):174-186. doi: 10.12779/dnd.2025.24.3.174. Epub 2025 May 21. Dement Neurocogn Disord. 2025. PMID: 40746338 Free PMC article.
-
Plastic but not progressive changes in cognitive function and hippocampal volume in an adolescent with bipolar disorder: a case report.Front Psychiatry. 2025 Jan 7;15:1507333. doi: 10.3389/fpsyt.2024.1507333. eCollection 2024. Front Psychiatry. 2025. PMID: 39839126 Free PMC article.
-
A meta-analysis of the effects of transcranial direct current stimulation combined with cognitive training on working memory in healthy older adults.Front Aging Neurosci. 2024 Sep 23;16:1454755. doi: 10.3389/fnagi.2024.1454755. eCollection 2024. Front Aging Neurosci. 2024. PMID: 39376507 Free PMC article.
-
EEG-Based Engagement Monitoring in Cognitive Games.Sensors (Basel). 2025 Mar 26;25(7):2072. doi: 10.3390/s25072072. Sensors (Basel). 2025. PMID: 40218585 Free PMC article.
References
-
- American Psychiatric Association . Diagnostic and Statistical Manual of Mental Disorders. 5th ed. American Psychiatric Publishing, Inc.; Arlington, VA, USA: 2013.
-
- Alves J., Magalhaes R., Thomas R.E., Goncalves O.F., Petrosyan A., Sampaio A. Is there evidence for cognitive intervention in Alzheimer disease? A systematic review of efficacy, feasibility, and cost-effectiveness. Alzheimer Dis. Assoc. Disord. 2013;27:195–203. doi: 10.1097/WAD.0b013e31827bda55. - DOI - PubMed
-
- Cai Z., Abrahamson K. Cognitive interventions for individuals with mild cognitive impairment: A systematic review. Int. J. Nurs. Sci. 2016;3:180–195. doi: 10.1016/j.ijnss.2016.04.012. - DOI
Publication types
Grants and funding
LinkOut - more resources
Full Text Sources
