

High Variability Periods in the EEG Distinguish Cognitive Brain States
- PMID: 38002488
- PMCID: PMC10669877
- DOI: 10.3390/brainsci13111528
High Variability Periods in the EEG Distinguish Cognitive Brain States
Abstract
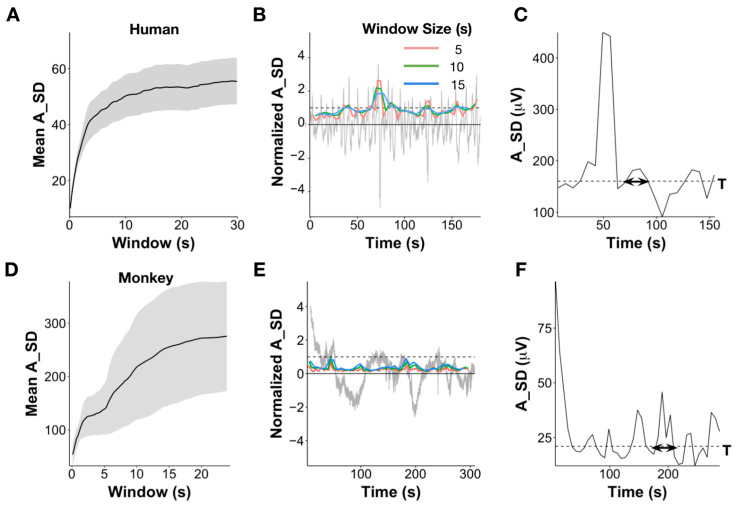
Objective: To describe a novel measure of EEG signal variability that distinguishes cognitive brain states.
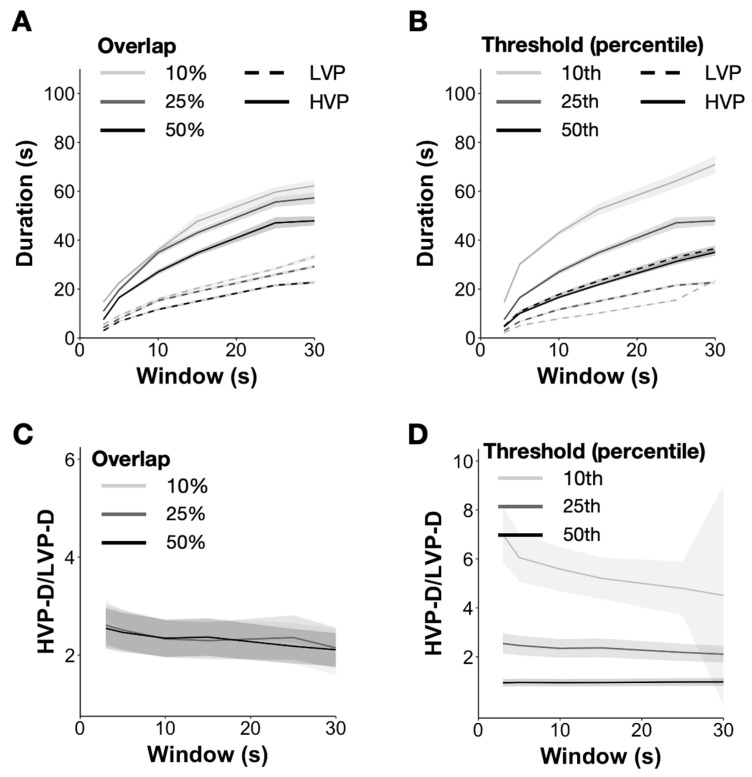
Method: We describe a novel characterization of amplitude variability in the EEG signal termed "High Variability Periods" or "HVPs", defined as segments when the standard deviation of a moving window is continuously higher than the quartile cutoff. We characterize the parameter space of the metric in terms of window size, overlap, and threshold to suggest ideal parameter choice and compare its performance as a discriminator of brain state to alternate single channel measures of variability such as entropy, complexity, harmonic regression fit, and spectral measures.
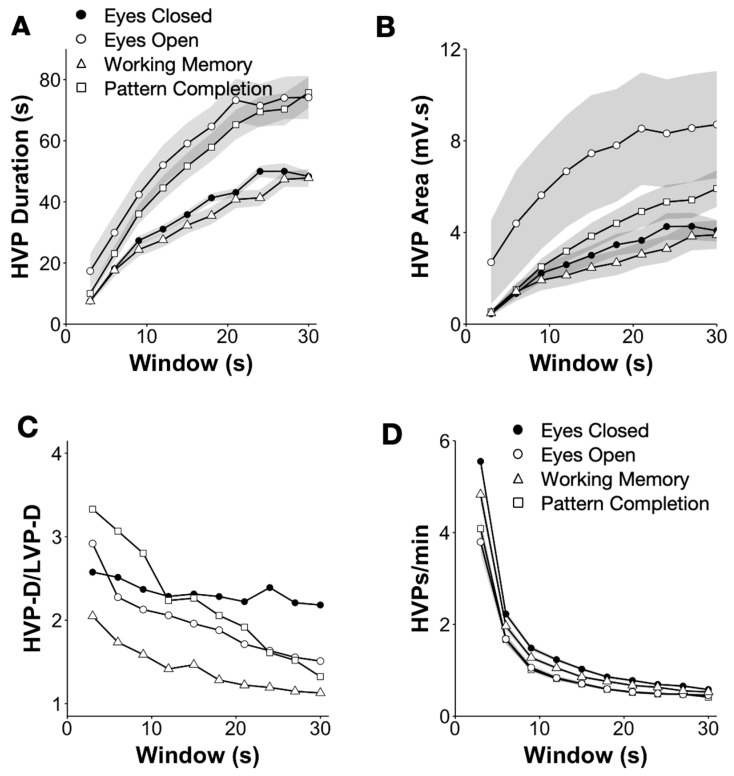
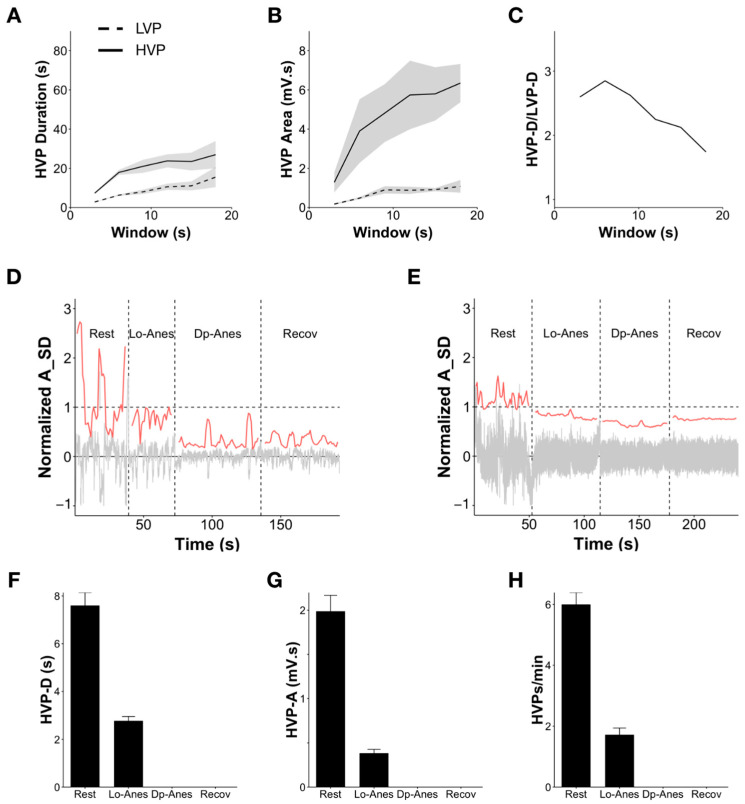
Results: We show that the average HVP duration provides a substantially distinct view of the signal relative to alternate metrics of variability and, when used in combination with these metrics, significantly enhances the ability to predict whether an individual has their eyes open or closed and is performing a working memory and Raven's pattern completion task. In addition, HVPs disappear under anesthesia and do not reappear in early periods of recovery.
Conclusions: HVP metrics enhance the discrimination of various brain states and are fast to estimate.
Significance: HVP metrics can provide an additional view of signal variability that has potential clinical application in the rapid discrimination of brain states.
Keywords: anesthesia; brain states; electroencephalography (EEG); entropy; working memory.
Conflict of interest statement
The authors declare no conflict of interest.
Figures
Similar articles
-
Waveform complexity: A new metric for EEG analysis.J Neurosci Methods. 2019 Sep 1;325:108313. doi: 10.1016/j.jneumeth.2019.108313. Epub 2019 Jul 3. J Neurosci Methods. 2019. PMID: 31278972
-
Increased signal diversity/complexity of spontaneous EEG, but not evoked EEG responses, in ketamine-induced psychedelic state in humans.PLoS One. 2020 Nov 23;15(11):e0242056. doi: 10.1371/journal.pone.0242056. eCollection 2020. PLoS One. 2020. PMID: 33226992 Free PMC article.
-
Brain variability in dynamic resting-state networks identified by fuzzy entropy: a scalp EEG study.J Neural Eng. 2021 Jul 5;18(4). doi: 10.1088/1741-2552/ac0d41. J Neural Eng. 2021. PMID: 34153948
-
The spatial metric of brain underlying the temporal metric of EEG and thought.Gegenbaurs Morphol Jahrb. 1990;136(1):79-87. Gegenbaurs Morphol Jahrb. 1990. PMID: 2180782 Review.
-
Integrative neuroscience: the role of a standardized database.Clin EEG Neurosci. 2005 Apr;36(2):64-75. doi: 10.1177/155005940503600205. Clin EEG Neurosci. 2005. PMID: 15999901 Review.
Cited by
-
Information-Theoretical Analysis of the Cycle of Creation of Knowledge and Meaning in Brains under Multiple Cognitive Modalities.Sensors (Basel). 2024 Feb 29;24(5):1605. doi: 10.3390/s24051605. Sensors (Basel). 2024. PMID: 38475141 Free PMC article.
-
A novel method for estimating functional connectivity from EEG coherence potentials.Sci Rep. 2025 Mar 28;15(1):10723. doi: 10.1038/s41598-025-94076-0. Sci Rep. 2025. PMID: 40155425 Free PMC article.
-
Resting state EEG classifies developmental status in three-year-old children.Dev Cogn Neurosci. 2025 Aug;74:101575. doi: 10.1016/j.dcn.2025.101575. Epub 2025 May 31. Dev Cogn Neurosci. 2025. PMID: 40479750 Free PMC article.
-
EEG Data Quality in Large-Scale Field Studies in India and Tanzania.eNeuro. 2025 Jul 25;12(7):ENEURO.0006-25.2025. doi: 10.1523/ENEURO.0006-25.2025. Print 2025 Jul. eNeuro. 2025. PMID: 40691075 Free PMC article.
References
-
- Santarnecchi E., Khanna A.R., Musaeus C.S., Benwell C.S.Y., Davila P., Farzan F., Matham S., Pascual-Leone A., Shafi M.M., Honeywell SHARP Team EEG Microstate Correlates of Fluid Intelligence and Response to Cognitive Training. Brain Topogr. 2017;30:502–520. doi: 10.1007/s10548-017-0565-z. - DOI - PubMed
LinkOut - more resources
Full Text Sources
