. 2023 Nov 13;10(11):1804.
doi: 10.3390/children10111804.

Femoral Occlusion during Neonatal Cardiopulmonary Resuscitation Improves Outcomes in an Ovine Model of Perinatal Cardiac Arrest

Affiliations

Femoral Occlusion during Neonatal Cardiopulmonary Resuscitation Improves Outcomes in an Ovine Model of Perinatal Cardiac Arrest

Munmun Rawat et al. Children (Basel). .

Abstract

Background: The goal of chest compressions during neonatal resuscitation is to increase cerebral and coronary blood flow leading to the return of spontaneous circulation (ROSC). During chest compressions, bilateral femoral occlusion may increase afterload and promote carotid and coronary flow, an effect similar to epinephrine. Our objectives were to determine the impact of bilateral femoral occlusion during chest compressions on the incidence and timing of ROSC and hemodynamics.

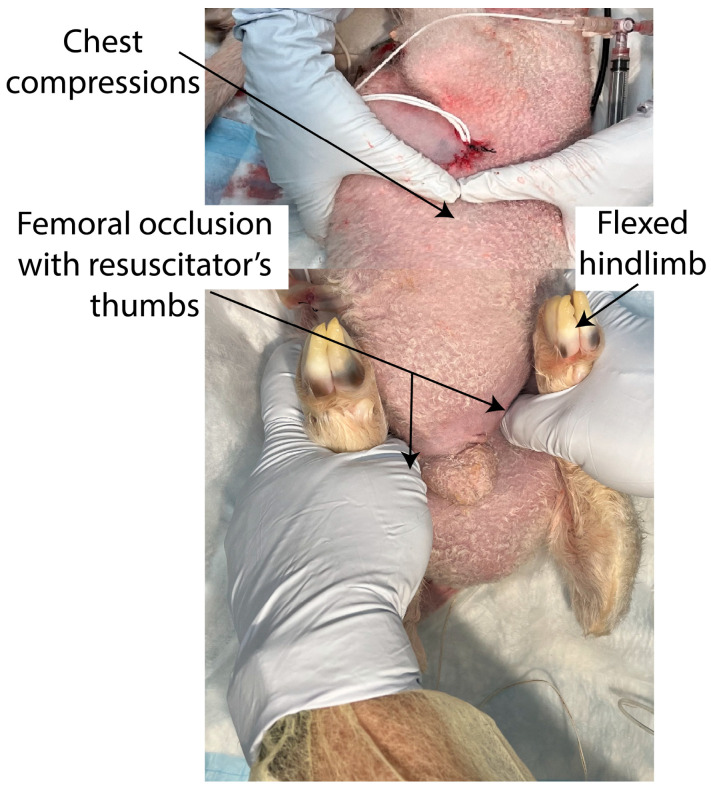
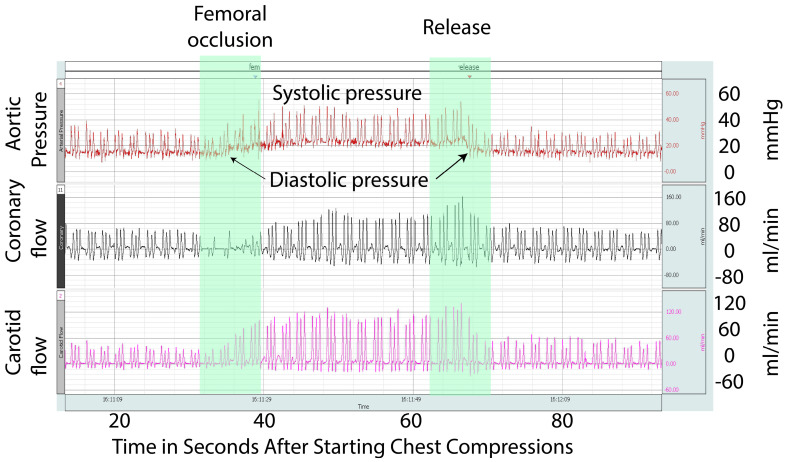
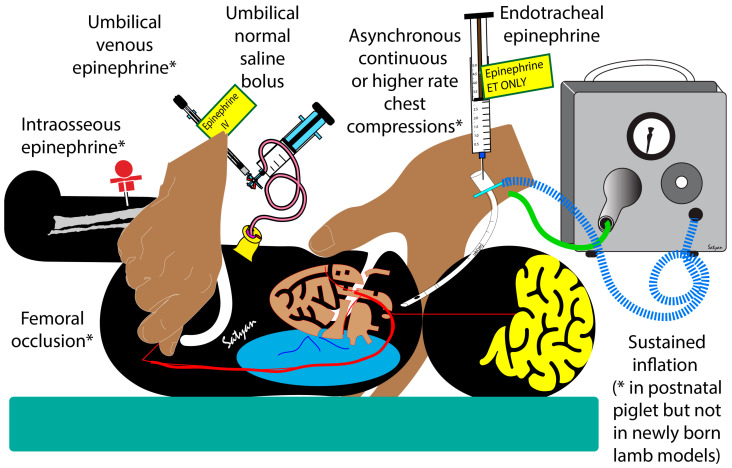
Methodology: In this randomized study, 19 term fetal lambs in cardiac arrest were resuscitated based on the Neonatal Resuscitation Program guidelines and randomized into two groups: femoral occlusion or controls. Bilateral femoral arteries were occluded by applying pressure using two fingers during chest compressions.

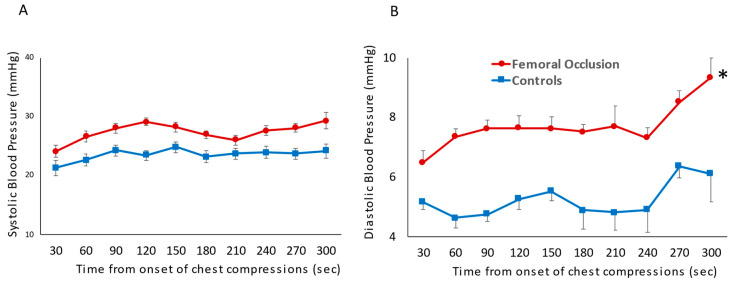
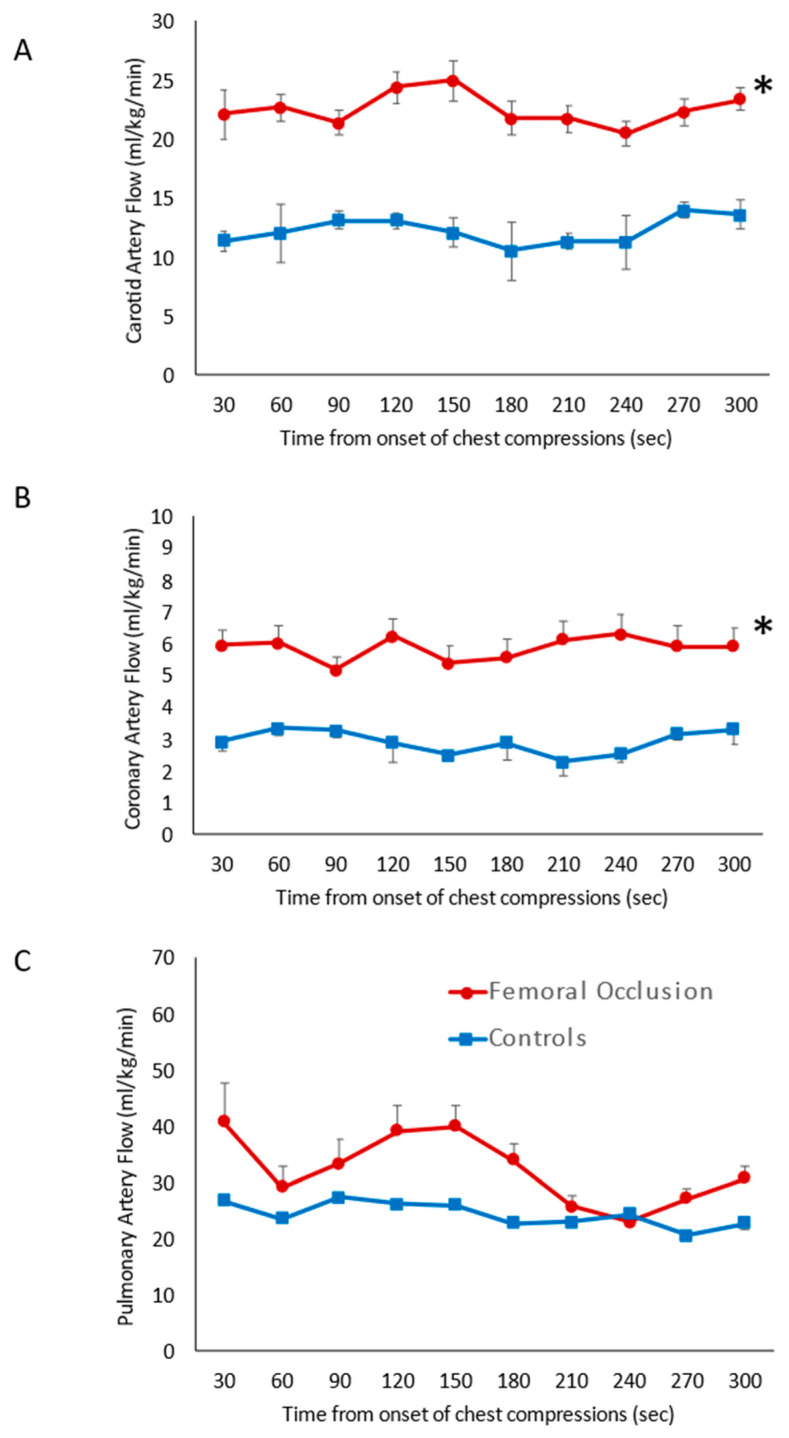
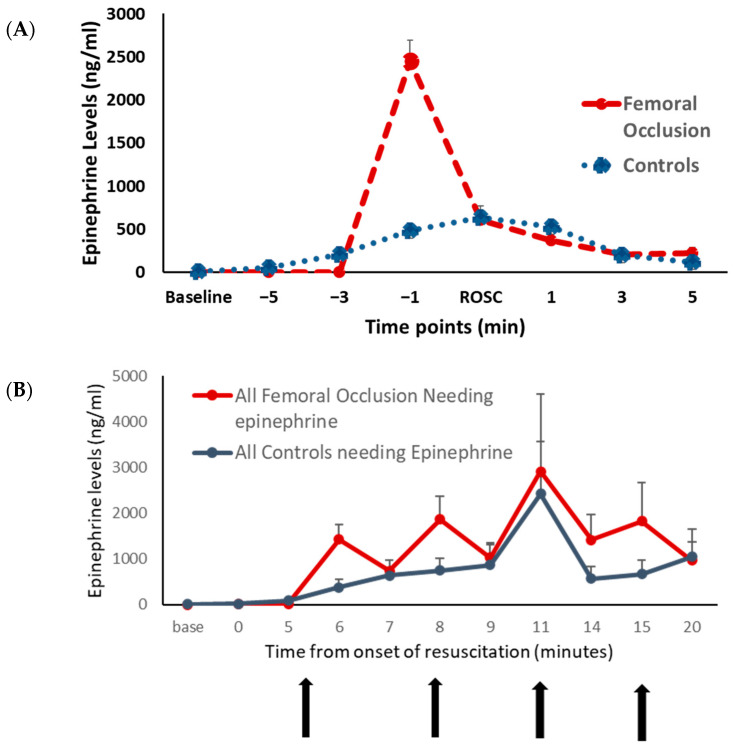
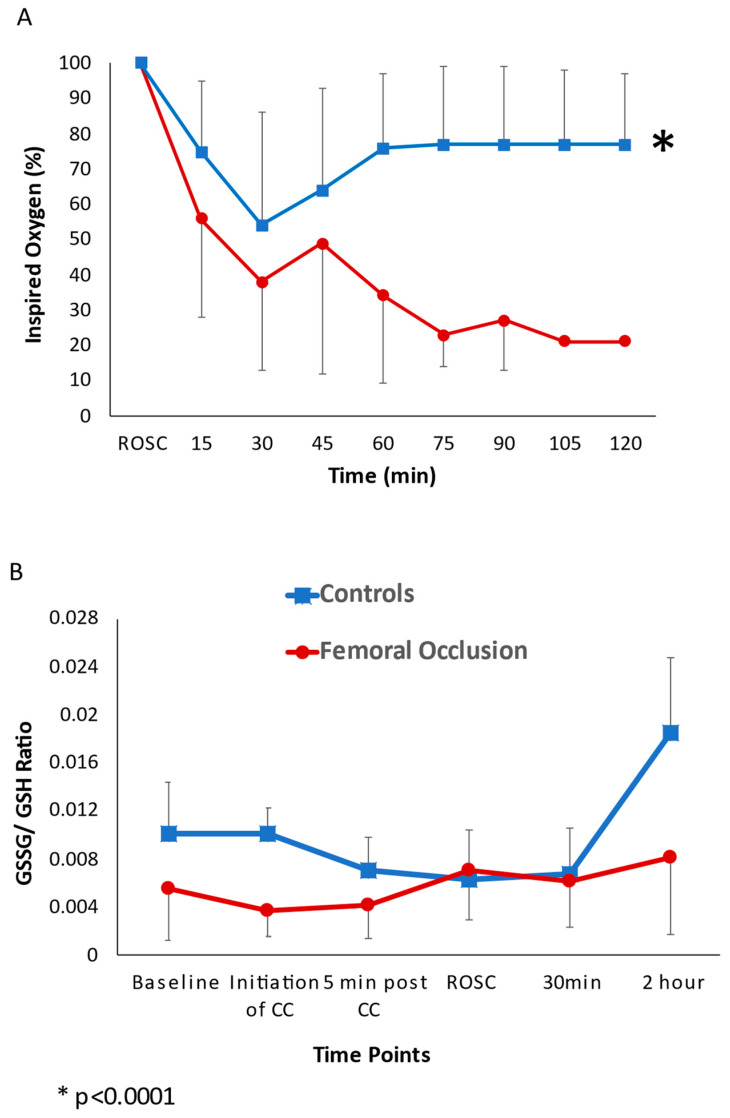
Results: Seventy percent (7/10) of the lambs in the femoral occlusion group achieved ROSC in 5 ± 2 min and three lambs (30%) did not receive epinephrine. ROSC was achieved in 44% (4/9) of the controls in 13 ± 6 min and all lambs received epinephrine. The femoral occlusion group had higher diastolic blood pressures, carotid and coronary blood flow.

Conclusion: Femoral occlusion resulted in faster and higher incidence of ROSC, most likely due to attaining increased diastolic pressures, coronary and carotid flow. This is a low-tech intervention that can be easily adapted in resource limited settings, with the potential to improve survival and neurodevelopmental outcomes.

Keywords: chest compression; femoral occlusion; neonatal resuscitation.


Conflict of interest statement

The authors declare no conflict of interest. Dr. Satyan Lakshminrusimha was a member of the AAP-NRP steering committee during this study period. The views expressed in this presentation are those of the authors and do not represent the official position of AAP or NRP.

Figures

Figure 1
Figure 1
In the femoral occlusion group, during positive pressure ventilation and chest compressions, bilateral femoral arteries were continuously occluded by the resuscitator’s thumbs and flexion of hip joint until the return of spontaneous circulation or 20 min of cardiopulmonary resuscitation.
Figure 2
Figure 2
The following line graphs show blood pressures on the y-axis and time in seconds from the onset of chest compressions for the first 5 min prior to epinephrine administration on the x-axis. The red circles represent the femoral occlusion group and the blue squares represent the controls. Blood pressure measured invasively via pressure probe in the ascending aorta. Systolic blood pressure (A) and diastolic blood pressure (B) are shown at the time points prior to achieving ROSC and receiving the first dose of epinephrine (nine lambs in the controls at all time points, ten lambs in the study group 0–180 s, eight lambs in the study group at 210 and 240 s as two lambs achieved ROSC, and seven lambs at 270 and 300 s as a total of three lambs achieved ROSC prior to those time points) (* p < 0.05 using ANOVA repeated measures).
Figure 3
Figure 3
Systemic hemodynamics: the line graphs show blood flow on the y-axis and time in seconds from the onset of chest compressions for the first 5 min prior to epinephrine administration on the x-axis. The red circles represent the femoral occlusion group and the blue squares represent the controls. Data are represented as the average and standard error of the mean. (A) Maximal carotid blood flow (obtained from the left carotid artery); (B) maximal coronary artery flow (from left circumflex artery); and (C) maximal pulmonary blood flow (left pulmonary artery). The graphs represent data from nine lambs in the controls at all time points, ten lambs in the study group 0–180 s, eight lambs in the study group at 210 and 240 s as two lambs achieved ROSC, and seven lambs at 270 and 300 s as a total of three lambs achieved ROSC prior to those time points. * p < 0.05 using ANOVA repeated measures compared to the controls.
Figure 4
Figure 4
Plasma epinephrine level: the graphs show the plasma epinephrine levels at various time points. The plasma epinephrine levels in ng/mL are shown on the y-axis. The red circles represent the femoral occlusion group and the blue squares represent the controls. (A) Lambs that achieved ROSC are included. The x-axis shows time points in minutes prior to the return of spontaneous circulation (ROSC) and after ROSC. Femoral occlusion resulted in higher plasma epinephrine levels right before the ROSC. (B) All the lambs that received epinephrine are included. x-axis shows the time in minutes from the onset of resuscitation. Vertical arrows show the time points at which epinephrine was administered.
Figure 5
Figure 5
Oxygen exposure and oxidative stress: the line graphs show the inspired oxygen requirements and oxidative stress. The red circles represent the femoral occlusion group and the blue squares represent the controls. (A) Inspired oxygen requirements to maintain saturations as per the Neonatal Resuscitation Program guidelines. The y-axis shows the inspired oxygen (%) and x-axis shows the time in minutes post the return of spontaneous circulation. (B) Reduced glutathione (GSH) to oxidized glutathione (GSSG) ratio in plasma. Baseline GSSG/GSH ratios and ratios during chest compressions were similar between the two groups. At the completion of the study after 2 h, the GSSG/GSH ratio in the femoral occlusion group was 0.008 ± 0.006 and in the control lambs it was 0.016 ± 0.011, (p = 0.067).
Figure 6
Figure 6
This is a Biopac® recording snapshot from an asphyxiated lamb in asystole during chest compressions and PPV. This snapshot shows the aortic pressure, coronary artery flow, and carotid artery flow. Initiation of femoral occlusion is depicted by the green arrow and release by the red arrow. The picture shows an increase in the systemic pressures, including diastolic pressures, coronary artery blood flow, and carotid artery blood flow, from the baseline during the period of femoral occlusion.
Figure 7
Figure 7
Strategies to increase diastolic pressure or cardiac output during chest compressions. * Indicates interventions that are effective in animal models (either newly born lambs or piglets). Umbilical venous or intraosseous epinephrine, femoral occlusion, and a higher rate of chest compressions are effective in increasing diastolic pressure or carotid flow. Sustained inflation increases diastolic flow in postnatal piglets, but not in newly born lambs.

Similar articles

References

    1. Harrington D.J., Redmon C.W., Moulden M., Greenwood C.E. The long-term outcome in surviving infants with Apgar zero at 10 minutes: A systematic review of the literature and hospital-based cohort. Am. J. Obstet. Gynecol. 2007;196:463.e1–463.e5. doi: 10.1016/j.ajog.2006.10.877. - DOI - PubMed
    1. Wyckoff M.H., Salhab W.A., Heyne R.J., Kendrick D.E., Stoll B.J., Laptook A.R., National Institute of Child Health and Human Development Neonatal Research Network Outcome of extremely low birth weight infants who received delivery room cardiopulmonary resuscitation. J. Pediatr. 2012;160:239–244.e2. doi: 10.1016/j.jpeds.2011.07.041. - DOI - PMC - PubMed
    1. Hayakawa K., Tasaki O., Hamasaki T., Sakai T., Shiozaki T., Nakagawa Y., Ogura H., Kuwagata Y., Kajino K., Iwami T., et al. Prognostic indicators and outcome prediction model for patients with return of spontaneous circulation from cardiopulmonary arrest: The Utstein Osaka Project. Resuscitation. 2011;82:874–880. doi: 10.1016/j.resuscitation.2011.02.045. - DOI - PubMed
    1. Vali P., Chandrasekharan P., Rawat M., Gugino S., Koenigsknecht C., Helman J., Mathew B., Berkelhamer S., Nair J., Wyckoff M., et al. Hemodynamics and gas exchange during chest compressions in neonatal resuscitation. PLoS ONE. 2017;12:e0176478. doi: 10.1371/journal.pone.0176478. - DOI - PMC - PubMed
    1. Carveth S. Standards for cardiopulmonary resuscitation and emergency cardiac care. JAMA. 1974;227:796–797. doi: 10.1001/jama.1974.03230200054012. - DOI - PubMed

LinkOut - more resources