Machine Learning Suggests That Small Size Helps Broaden Plasmid Host Range
- PMID: 38002987
- PMCID: PMC10670969
- DOI: 10.3390/genes14112044
Machine Learning Suggests That Small Size Helps Broaden Plasmid Host Range
Abstract
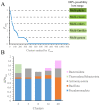
Plasmids mediate gene exchange across taxonomic barriers through conjugation, shaping bacterial evolution for billions of years. While plasmid mobility can be harnessed for genetic engineering and drug-delivery applications, rapid plasmid-mediated spread of resistance genes has rendered most clinical antibiotics useless. To solve this urgent and growing problem, we must understand how plasmids spread across bacterial communities. Here, we applied machine-learning models to identify features that are important for extending the plasmid host range. We assembled an up-to-date dataset of more than thirty thousand bacterial plasmids, separated them into 1125 clusters, and assigned each cluster a distribution possibility score, taking into account the host distribution of each taxonomic rank and the sampling bias of the existing sequencing data. Using this score and an optimized plasmid feature pool, we built a model stack consisting of DecisionTreeRegressor, EvoTreeRegressor, and LGBMRegressor as base models and LinearRegressor as a meta-learner. Our mathematical modeling revealed that sequence brevity is the most important determinant for plasmid spread, followed by P-loop NTPases, mobility factors, and β-lactamases. Ours and other recent results suggest that small plasmids may broaden their range by evading host defenses and using alternative modes of transfer instead of autonomous conjugation.
Keywords: antibiotic resistance genes; clustering; conjugation; horizontal gene transfer; machine learning; plasmid host range; small-size plasmid.
Conflict of interest statement
The authors declare no conflict of interest.
Figures


Similar articles
-
Universal whole-sequence-based plasmid typing and its utility to prediction of host range and epidemiological surveillance.Microb Genom. 2020 Oct;6(10):mgen000435. doi: 10.1099/mgen.0.000435. Microb Genom. 2020. PMID: 32969786 Free PMC article.
-
Tracking of Antibiotic Resistance Transfer and Rapid Plasmid Evolution in a Hospital Setting by Nanopore Sequencing.mSphere. 2020 Aug 19;5(4):e00525-20. doi: 10.1128/mSphere.00525-20. mSphere. 2020. PMID: 32817379 Free PMC article.
-
MOSTPLAS: a self-correction multi-label learning model for plasmid host range prediction.Bioinformatics. 2025 Mar 4;41(3):btaf075. doi: 10.1093/bioinformatics/btaf075. Bioinformatics. 2025. PMID: 39960880 Free PMC article.
-
pCTX-M3-Structure, Function, and Evolution of a Multi-Resistance Conjugative Plasmid of a Broad Recipient Range.Int J Mol Sci. 2021 Apr 27;22(9):4606. doi: 10.3390/ijms22094606. Int J Mol Sci. 2021. PMID: 33925677 Free PMC article. Review.
-
Properties affecting transfer and expression of degradative plasmids for the purpose of bioremediation.Biodegradation. 2021 Aug;32(4):361-375. doi: 10.1007/s10532-021-09950-1. Epub 2021 May 27. Biodegradation. 2021. PMID: 34046775 Free PMC article. Review.
Cited by
-
High-Risk Lineages of Hybrid Plasmids Carrying Virulence and Carbapenemase Genes.Antibiotics (Basel). 2024 Dec 17;13(12):1224. doi: 10.3390/antibiotics13121224. Antibiotics (Basel). 2024. PMID: 39766615 Free PMC article.
-
Comparative analysis of Legionella lytica genome identifies specific metabolic traits and virulence factors.Sci Rep. 2025 Feb 14;15(1):5554. doi: 10.1038/s41598-025-90154-5. Sci Rep. 2025. PMID: 39952999 Free PMC article.
References
Publication types
MeSH terms
Substances
Grants and funding
LinkOut - more resources
Full Text Sources

