

Genome-Wide Identification and Characterization of CLAVATA3/EMBRYO SURROUNDING REGION (CLE) Gene Family in Foxtail Millet (Setaria italica L.)
- PMID: 38002989
- PMCID: PMC10671770
- DOI: 10.3390/genes14112046
Genome-Wide Identification and Characterization of CLAVATA3/EMBRYO SURROUNDING REGION (CLE) Gene Family in Foxtail Millet (Setaria italica L.)
Abstract
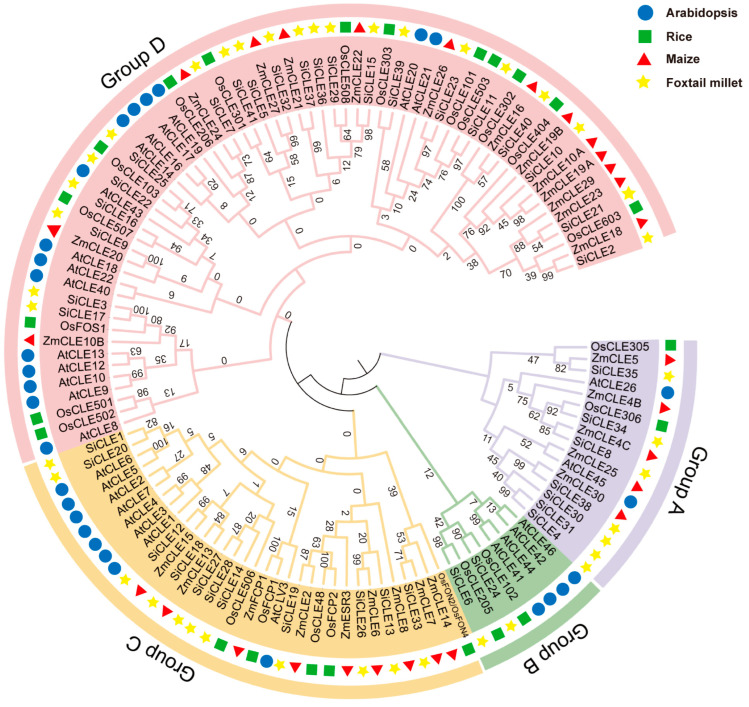
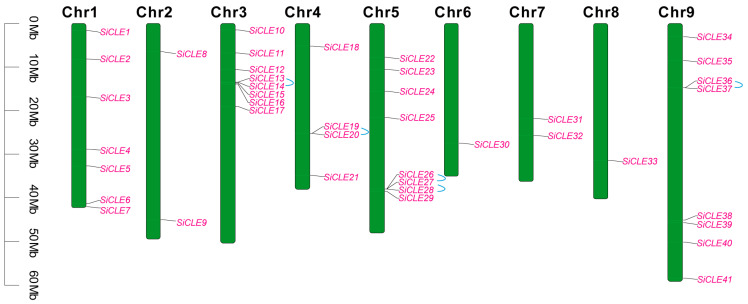
The CLAVATA3/EMBRYO-SURROUNDING REGION (CLE) genes encode signaling peptides that play important roles in various developmental and physiological processes. However, the systematic identification and characterization of CLE genes in foxtail millet (Setaria italica L.) remain limited. In this study, we identified and characterized 41 SiCLE genes in the foxtail millet genome. These genes were distributed across nine chromosomes and classified into four groups, with five pairs resulting from gene duplication events. SiCLE genes within the same phylogenetic group shared similar gene structure and motif patterns, while 34 genes were found to be single-exon genes. All SiCLE peptides harbored the conserved C-terminal CLE domain, with highly conserved positions in the CLE core sequences shared among foxtail millet, Arabidopsis, rice, and maize. The SiCLE genes contained various cis-elements, including five plant hormone-responsive elements. Notably, 34 SiCLE genes possessed more than three types of phytohormone-responsive elements on their promoters. Comparative analysis revealed higher collinearity between CLE genes in maize and foxtail millet, which may be because they are both C4 plants. Tissue-specific expression patterns were observed, with genes within the same group exhibiting similar and specific expression profiles. SiCLE32 and SiCLE41, classified in Group D, displayed relatively high expression levels in all tissues except panicles. Most SiCLE genes exhibited low expression levels in young panicles, while SiCLE6, SiCLE24, SiCLE25, and SiCLE34 showed higher expression in young panicles, with SiCLE24 down-regulated during later panicle development. Greater numbers of SiCLE genes exhibited higher expression in roots, with SiCLE7, SiCLE22, and SiCLE36 showing the highest levels and SiCLE36 significantly down-regulated after abscisic acid (ABA) treatment. Following treatments with ABA, 6-benzylaminopurine (6-BA), and gibberellic acid 3 (GA3), most SiCLE genes displayed down-regulation followed by subsequent recovery, while jasmonic acid (JA) and indole-3-acetic acid (IAA) treatments led to upregulation at 30 min in leaves. Moreover, identical hormone treatments elicited different expression patterns of the same genes in leaves and stems. This comprehensive study enhances our understanding of the SiCLE gene family and provides a foundation for further investigations into the functions and evolution of SiCLE genes in foxtail millet.
Keywords: CLE gene family; expression pattern; foxtail millet; plant hormone.
Conflict of interest statement
The authors declare no conflict of interest.
Figures


Similar articles
-
Identification and molecular characterization of MYB Transcription Factor Superfamily in C4 model plant foxtail millet (Setaria italica L.).PLoS One. 2014 Oct 3;9(10):e109920. doi: 10.1371/journal.pone.0109920. eCollection 2014. PLoS One. 2014. PMID: 25279462 Free PMC article.
-
Genome-wide identification of the adaptor protein complexes and its expression patterns analysis in foxtail millet (Setaria italica L.).BMC Plant Biol. 2025 Jan 2;25(1):7. doi: 10.1186/s12870-024-05959-9. BMC Plant Biol. 2025. PMID: 39748285 Free PMC article.
-
Genome-wide analysis of autophagy-associated genes in foxtail millet (Setaria italica L.) and characterization of the function of SiATG8a in conferring tolerance to nitrogen starvation in rice.BMC Genomics. 2016 Oct 12;17(1):797. doi: 10.1186/s12864-016-3113-4. BMC Genomics. 2016. PMID: 27733118 Free PMC article.
-
Domestication and Improvement in the Model C4 Grass, Setaria.Front Plant Sci. 2018 May 29;9:719. doi: 10.3389/fpls.2018.00719. eCollection 2018. Front Plant Sci. 2018. PMID: 29896214 Free PMC article. Review.
-
Foxtail millet research in supporting climate change resilience efforts: Bibliometric analysis and focused literature review.Heliyon. 2025 Jan 28;11(3):e42348. doi: 10.1016/j.heliyon.2025.e42348. eCollection 2025 Feb 15. Heliyon. 2025. PMID: 39968133 Free PMC article. Review.
Cited by
-
Peptide hormones in plants.Mol Hortic. 2025 Jan 23;5(1):7. doi: 10.1186/s43897-024-00134-y. Mol Hortic. 2025. PMID: 39849641 Free PMC article. Review.
-
Identification and Expression Analysis of the WOX Transcription Factor Family in Foxtail Millet (Setaria italica L.).Genes (Basel). 2024 Apr 10;15(4):476. doi: 10.3390/genes15040476. Genes (Basel). 2024. PMID: 38674410 Free PMC article.
References
-
- Fletcher J.C. Recent Advances in Arabidopsis CLE Peptide Signaling. Trends Plant Sci. 2020;25:1005–1016. - PubMed
-
- Rodriguez-Garcia A., Smertenko A. CLE peptides: Emerging players in plant development and stress responses. J. Exp. Bot. 2022;73:3509–3524.
Publication types
MeSH terms
Substances
Grants and funding
- 32001515/National Natural Science Foundation of China
- 201901D211363/the Youth Fund Project on Application of Basic Research Project of Shanxi Province
- 2018YJ32/the Scientific and Technological Innovation Programs of Shanxi Agricultural University
- 2021BQ112/the Scientific and Technological Innovation Programs of Shanxi Agricultural University
- SXBYKY2022059/the Excellent doctors come to Shanxi to reward scientific research projects
LinkOut - more resources
Full Text Sources
Miscellaneous
