. 2023 Nov 8;13(22):3450.
doi: 10.3390/ani13223450.

Study of Transcriptomic Analysis of Yak (Bos grunniens) and Cattle (Bos taurus) Pulmonary Artery Smooth Muscle Cells under Oxygen Concentration Gradients and Differences in Their Lung Histology and Expression of Pyruvate Dehydrogenase Kinase 1-Related Factors

Affiliations

Study of Transcriptomic Analysis of Yak (Bos grunniens) and Cattle (Bos taurus) Pulmonary Artery Smooth Muscle Cells under Oxygen Concentration Gradients and Differences in Their Lung Histology and Expression of Pyruvate Dehydrogenase Kinase 1-Related Factors

Yiyang Zhang et al. Animals (Basel). .

Abstract

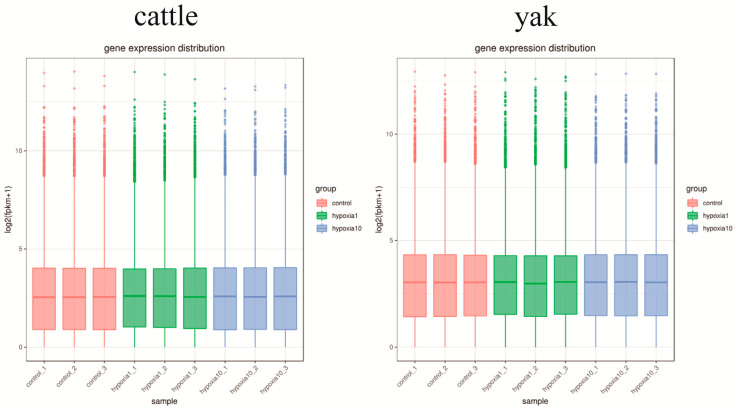
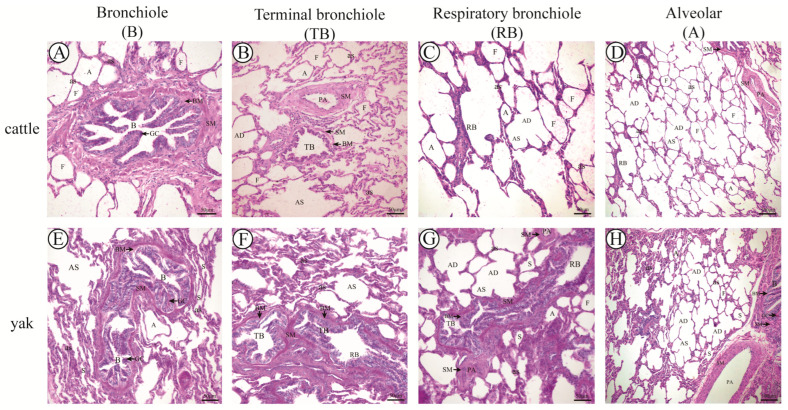
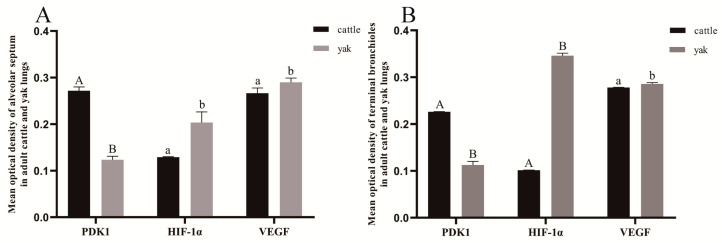
The aim of this study was to investigate the molecular mechanisms by which hypoxia affects the biological behavior of yak PASMCs, the changes in the histological structure of yak and cattle lungs, and the relationships and regulatory roles that exist regarding the differences in the distribution and expression of PDK1 and its hypoxia-associated factors screened for their role in the adaptation of yak lungs to the plateau hypoxic environment. The results showed that, at the level of transcriptome sequencing, the molecular regulatory mechanisms of the HIF-1 signaling pathway, glucose metabolism pathway, and related factors (HK2/PGK1/ENO1/ENO3/ALDOC/ALDOA) may be closely related to the adaptation of yaks to the hypoxic environment of the plateau; at the tissue level, the presence of filled alveoli and semi-filled alveoli, thicker alveolar septa and basement membranes, a large number of erythrocytes, capillary distribution, and collagen fibers accounted for all levels of fine bronchioles in the lungs of yaks as compared to cattle. A higher percentage of goblet cells was found in the fine bronchioles of yaks, and PDK1, HIF-1α, and VEGF were predominantly distributed and expressed in the monolayers of ciliated columnar epithelium in the branches of the terminal fine bronchioles of yak and cattle lungs, with a small amount of it distributed in the alveolar septa; at the molecular level, the differences in PDK1 mRNA relative expression in the lungs of adult yaks and cattle were not significant (p > 0.05), the differences in HIF-1α and VEGF mRNA relative expression were significant (p < 0.05), and the expression of PDK1 and HIF-1α proteins in adult yaks was stronger than that in adult cattle. PDK1 and HIF-1α proteins were more strongly expressed in adult yaks than in adult cattle, and the difference was highly significant (p < 0.01); the relative expression of VEGF proteins was not significantly different between adult yaks and cattle (p > 0.05). The possible regulatory relationship between the above results and the adaptation of yak lungs to the plateau hypoxic environment paves the way for the regulatory mechanisms of PDK1, HIF-1α, and VEGF, and provides basic information for studying the mechanism of hypoxic adaptation of yaks in the plateau. At the same time, it provides a reference for human hypoxia adaptation and a target for the prevention and treatment of plateau diseases in humans and plateau animals.

Keywords: PASMCs; cattle; different oxygen concentrations; expression distribution; hypoxic differential factor; lung histology; transcriptomic analysis; yak.


Conflict of interest statement

The authors declare no conflict of interest.

Figures

Figure 1
Figure 1
The flow of sequencing and database construction.
Figure 2
Figure 2
Box diagram of gene expression level distribution in samples. In the figure, the abscissa is the sample name, and the ordinate is log2 (FPKM + 1). Groupings in the figure are as follows: control refers to 20% O2 concentration; hypoxia 1 refers to 1% O2 concentration; hypoxia 10 refers to 10% O2 concentration; FPKM indicates fragments per thousand transcribed bases per million mapped reads.
Figure 3
Figure 3
Heat map of correlation between samples. Groupings in the figure are as follows: control refers to 20% O2 concentration; hypoxia 1 refers to 1% O2 concentration; hypoxia 10 refers to 10% O2 concentration. The _1, _2, and _3 tails were named for each of the three samples in each group.
Figure 4
Figure 4
Principal component analysis (PCA). Groupings in the figure are as follows: control refers to 20% O2 concentration; hypoxia 1 refers to 1% O2 concentration; hypoxia 10 refers to 10% O2 concentration; the _1, _2, and _3 tails were named for each of the three samples in each group.
Figure 5
Figure 5
Transcriptome analysis of yak and cattle PASMCs under different oxygen concentration conditions. (A) Statistical histogram of the number of differential genes in the differential comparison combinations; blue and gray indicate the upregulated and downregulated differential genes, respectively, and the numbers on the bars indicate the number of differential genes; (B) Wayne diagram of the differential genes; (C) heat map of the clustering of the differentially expressed genes; the horizontal coordinate is the name of the samples, and the vertical coordinate is the normalized FPKM value of the differential genes.
Figure 6
Figure 6
Expression patterns of differentially expressed genes. (A) Transcriptome sequencing was verified by RT-qPCR in cattle PASMCs; (B) transcriptome sequencing was verified by RT-qPCR in yak PASMCs; (C) correlation between RNA-Seq and RT-qPCR in cattle PASMCs; (D) correlation between RNA-Seq and RT-qPCR in yak PASMCs; (E) expression patterns of differentially expressed genes by RT-qPCR and RNA-Seq in cattle PASMCs; (F) expression patterns of differentially expressed genes by RT-qPCR and RNA-Seq in yak PASMCs. Groupings in the figure: control refers to 20% O2 concentration; hypoxia 1 refers to 1% O2 concentration; hypoxia 10 refers to 10% O2 concentration.
Figure 7
Figure 7
Scatterplot of GO enrichment analysis under gradient oxygen concentration. The horizontal coordinate of the graph is the ratio of the number of differential genes annotated with the GO term to the total number of differential genes, and the vertical coordinate is the GO term. (AC) Scatterplot of GO enrichment analysis of cattle PASMCs under hypoxia 1 vs. control, hypoxia 10 vs. control, and hypoxia 10 vs. hypoxia 1; (DF) scatterplot of GO enrichment analysis of yak PASMCs under hypoxia 1 vs. control, hypoxia 10 vs. control, and hypoxia 10 vs. hypoxia 1. The omitted part of the figure is: hydrolase activity, acting on acid anhydrides, in phosphorus-containing anhydrides; purine ribonucleoside diphosphate metabolic process; purine ribonucleoside diphosphate metabolic process; oxidoreductase activity, acting on single donors with incorporation of molecular oxygen; hydrolase activity, acting on acid anhydrides.
Figure 7
Figure 7
Scatterplot of GO enrichment analysis under gradient oxygen concentration. The horizontal coordinate of the graph is the ratio of the number of differential genes annotated with the GO term to the total number of differential genes, and the vertical coordinate is the GO term. (AC) Scatterplot of GO enrichment analysis of cattle PASMCs under hypoxia 1 vs. control, hypoxia 10 vs. control, and hypoxia 10 vs. hypoxia 1; (DF) scatterplot of GO enrichment analysis of yak PASMCs under hypoxia 1 vs. control, hypoxia 10 vs. control, and hypoxia 10 vs. hypoxia 1. The omitted part of the figure is: hydrolase activity, acting on acid anhydrides, in phosphorus-containing anhydrides; purine ribonucleoside diphosphate metabolic process; purine ribonucleoside diphosphate metabolic process; oxidoreductase activity, acting on single donors with incorporation of molecular oxygen; hydrolase activity, acting on acid anhydrides.
Figure 8
Figure 8
Histogram of GO enrichment analysis under gradient oxygen concentration. The horizontal coordinate of the graph is the number of genes enriched by GO term, and the vertical coordinate is the number of GO terms (BP: biological process, MF: molecular function, CC: cellular component). Groupings in the figure are as follows: control refers to 20% O2 concentration; hypoxia 1 refers to 1% O2 concentration; hypoxia 10 refers to 10% O2 concentration. (A) Histogram of GO enrichment analysis of cattle PASMCs under hypoxia 1 vs. control, hypoxia 10 vs. control, and hypoxia 10 vs. hypoxia 1; (B) histogram of GO enrichment analysis of yak PASMCs under hypoxia 1 vs. control, hypoxia 10 vs. control, and hypoxia 10 vs. hypoxia 1.
Figure 9
Figure 9
Bar graph of KEGG enrichment analysis. The horizontal coordinate of the graph is the KEGG pathway and the vertical coordinate is the significance level of the pathway enrichment. Groupings in the figure are as follows: control refers to 20% O2 concentration; hypoxia 1 refers to 1% O2 concentration; hypoxia 10 refers to 10% O2 concentration. (AC) Bar graph of KEGG enrichment analysis of cattle PASMCs under hypoxia 1 vs. control, hypoxia 10 vs. control, and hypoxia 10 vs. hypoxia 1; (DF) bar graph of KEGG enrichment analysis of yak PASMCs under hypoxia 1 vs. control, hypoxia 10 vs. control, and hypoxia 10 vs. hypoxia 1. The omitted part of the figure is: Viral protein interaction with cytokine and cytokine receptor; Signaling pathways regulating pluripotency of stem cells.
Figure 10
Figure 10
H&E staining of adult cattle and yak lung tissue. (AD), respectively, correspond to PAS staining of lung bronchioles (B), terminal bronchioles (TB), respiratory bronchioles (RB), and alveoli (A) in adult cattle, 200×; (EH), respectively, correspond to H&E staining of lung bronchioles (B), terminal bronchioles (TB), respiratory bronchioles (RB), and alveoli (A) in adult yaks, 200×. B: bronchiole; TB: terminal bronchiole; RB: respiratory bronchiole; PA: pulmonary artery; A: alveoli; F: filled alveoli; S: semi−filled alveoli; AD: alveolar duct; AS: alveolar sac; as: alveolar septa; Ep: epithelium cell; and SM: smooth muscle.
Figure 11
Figure 11
Analysis of data from H&E measurements of fine bronchioles at all levels of the lungs in adult cattle and yaks. (A) The proportion of alveolar septa in H&E staining of various levels of pulmonary bronchioles in adult cattle and yaks; (B) the average thickness of the accompanying pulmonary artery tunica medial at various levels of the pulmonary bronchioles in adult cattle and yaks. Different letters indicate significant differences, capital letters indicate extremely significant differences (p < 0.01), lowercase letters indicate significant differences (p < 0.05), and the same letters indicate no significant difference (p > 0.05); n = 3.
Figure 12
Figure 12
Masson staining of adult cattle and yak lung tissue. (AC), respectively, correspond to Masson staining of lung bronchioles (B), terminal bronchioles (TB), and respiratory bronchioles (RB) in adult cattle, 200×; (EG), respectively, corresponding to Masson staining of lung bronchioles (B), terminal bronchioles (TB), and respiratory bronchioles (RB) in adult yaks, 200×; (D,H), respectively, correspond to Masson staining of alveoli (A) in adult cattle and yak, 100×. B: bronchiole; TB: terminal bronchiole; RB: respiratory bronchiole; PA: pulmonary artery; A: alveoli; F: filled alveoli; S: semi−filled alveoli; AD: alveolar duct; AS: alveolar sac; as: alveolar septa; Ep: epithelium cell; GC: goblet cell; SM: smooth muscle; and BM: basement membrane.
Figure 13
Figure 13
Analysis of data from Masson measurements of fine bronchioles at all levels of the lungs in adult cattle and yaks. (A) The proportion of alveolar septa in Masson staining of various levels of pulmonary bronchioles in adult cattle and yaks; (B) the average thickness of smooth muscle in various levels of pulmonary bronchioles in adult cattle and yaks; (C) the proportion of collagen fibers in various levels of pulmonary bronchioles in adult cattle and yaks. Different letters indicate significant differences, capital letters indicate extremely significant differences (p < 0.01), lowercase letters indicate significant differences (p < 0.05), and the same letters indicate no significant difference (p > 0.05); n = 3.
Figure 13
Figure 13
Analysis of data from Masson measurements of fine bronchioles at all levels of the lungs in adult cattle and yaks. (A) The proportion of alveolar septa in Masson staining of various levels of pulmonary bronchioles in adult cattle and yaks; (B) the average thickness of smooth muscle in various levels of pulmonary bronchioles in adult cattle and yaks; (C) the proportion of collagen fibers in various levels of pulmonary bronchioles in adult cattle and yaks. Different letters indicate significant differences, capital letters indicate extremely significant differences (p < 0.01), lowercase letters indicate significant differences (p < 0.05), and the same letters indicate no significant difference (p > 0.05); n = 3.
Figure 14
Figure 14
PAS staining of adult cattle and yak lung tissue. (AC), respectively, correspond to PAS staining of lung bronchioles (B), terminal bronchioles (TB), and respiratory bronchioles (RB) in adult cattle, 200×; (EG), respectively, corresponding to PAS staining of lung bronchioles (B), terminal bronchioles (TB), and respiratory bronchioles (RB) in adult yaks, 200×; (D,H), respectively, correspond to PAS staining of alveoli (A) in adult cattle and yaks, 100×. B: bronchiole; TB: terminal bronchiole; RB: respiratory bronchiole; PA: pulmonary artery; A: alveoli; F: filled alveoli; S: semi−filled alveoli; AD: alveolar duct; AS: alveolar sac; as: alveolar septa; Ep: epithelium cell; GC: goblet cell; SM: smooth muscle; and BM: basement membrane.
Figure 15
Figure 15
Analysis of data from PAS measurements of fine bronchioles at all levels of the lungs in adult cattle and yaks. (A) The proportion of alveolar septa in PAS staining of various levels of pulmonary bronchioles in adult cattle and yaks; (B) the thickness of basement membrane in various levels of pulmonary bronchioles in adult cattle and yaks; (C) the proportion of goblet cells in pulmonary bronchioles of adult cattle and yaks. Different letters indicate significant differences, capital letters indicate extremely significant differences (p < 0.01), lowercase letters indicate significant differences (p < 0.05), and the same letters indicate no significant difference (p > 0.05); n = 3.
Figure 16
Figure 16
Distribution of PDK1, HIF-1α, and VEGF in adult cattle and yak lung tissue. (AC), respectively, correspond to the immunohistochemistry of adult cattle lung tissue PDK1, HIF-1α, and VEGF; (EG) correspond to the immunohistochemistry of adult yak lung tissue PDK1, HIF-1α, and VEGF, respectively; (DH), respectively, correspond to the negative control of adult cattle and yak lung tissue; 400×. TB: terminal bronchiole; PA: pulmonary artery; AS: alveolar sac; as: alveolar septa; Ep: simple columnar epithelium; and SM: smooth muscle.
Figure 17
Figure 17
Mean optical density values of PDK1, HIF-1α, and VEGF in adult cattle and yak lung tissue. (A) The mean optical density value of PDK1 and its related factors in the terminal bronchioles of adult cattle and yaks; (B) the mean optical density of PDK1 and its related factors in the alveolar septa of adult cattle and yaks. Different letters indicate significant differences, capital letters indicate extremely significant differences (p < 0.01), lowercase letters indicate significant differences (p < 0.05), and the same letters indicate no significant difference (p > 0.05); n = 3.
Figure 18
Figure 18
mRNA expression of PDK1, HIF-1α, and VEGF in adult cattle and yak lung tissue. (AC) The relative expression levels of PDK1, HIF-1α, and VEGF mRNA in adult cattle and yak lungs, respectively. Different letters indicated significant difference (p < 0.05), same letters indicate no significant difference (p > 0.05), capital letters indicate extremely significant differences (p < 0.01), lowercase letters indicate significant differences (p < 0.05), and the same letters indicate no significant difference (p > 0.05); n = 3.
Figure 19
Figure 19
Protein expression of PDK1, HIF-1α, and VEGF in adult yak and cattle lungs. (A) The expressions of PDK1, HIF-1α, and VEGF proteins in the lungs of adult cattle and yaks. (BD) Relative expression of PDK1, HIF-1α, and VEGF protein. Different letters indicate significant differences, capital letters indicate extremely significant differences (p < 0.01), lowercase letters indicate significant differences (p < 0.05), and the same letters indicate no significant difference (p > 0.05).

Similar articles

Cited by

References

    1. Chen S.Y., Li C., Luo Z., Li X., Jia X., Lai S.J. Favoring Expression of Yak Alleles in Interspecies F1 Hybrids of Cattle and Yak Under High-Altitude Environments. Front. Vet. Sci. 2022;9:892663. doi: 10.3389/fvets.2022.892663. - DOI - PMC - PubMed
    1. Honda T., Hirakawa Y., Nangaku M. The role of oxidative stress and hypoxia in renal disease. Kidney Res. Clin. Pract. 2019;38:414–426. doi: 10.23876/j.krcp.19.063. - DOI - PMC - PubMed
    1. Qi X., Zhang Q., He Y., Yang L., Zhang X., Shi P., Yang L., Liu Z., Zhang F., Liu F., et al. The Transcriptomic Landscape of Yaks Reveals Molecular Pathways for High Altitude Adaptation. Genome Biol. Evol. 2019;11:72–85. doi: 10.1093/gbe/evy264. - DOI - PMC - PubMed
    1. Lan D., Xiong X., Ji W., Li J., Mipam T.D., Ai Y., Chai Z. Transcriptome profile and unique genetic evolution of positively selected genes in yak lungs. Genetica. 2018;146:151–160. doi: 10.1007/s10709-017-0005-8. - DOI - PubMed
    1. Xin J.W., Chai Z.X., Zhang C.F., Zhang Q., Zhu Y., Cao H.W., Yangji C., Chen X.Y., Jiang H., Zhong J.C., et al. Differences in proteomic profiles between yak and three cattle strains provide insights into molecular mechanisms underlying high-altitude adaptation. J. Anim. Physiol. Anim. Nutr. 2022;106:485–493. doi: 10.1111/jpn.13629. - DOI - PubMed

LinkOut - more resources