. 2023 Nov 9;13(22):3461.
doi: 10.3390/ani13223461.

Multi-Omics Analysis of the Mechanism of Mentha Haplocalyx Briq on the Growth and Metabolic Regulation of Fattening Sheep

Affiliations

Multi-Omics Analysis of the Mechanism of Mentha Haplocalyx Briq on the Growth and Metabolic Regulation of Fattening Sheep

Mingliang Yi et al. Animals (Basel). .

Abstract

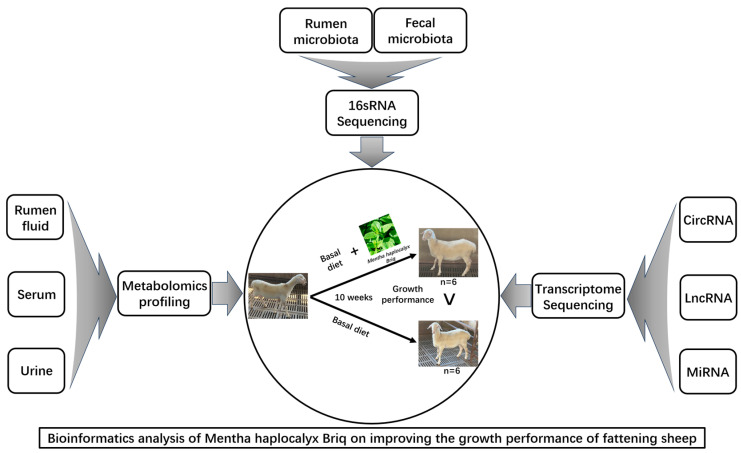
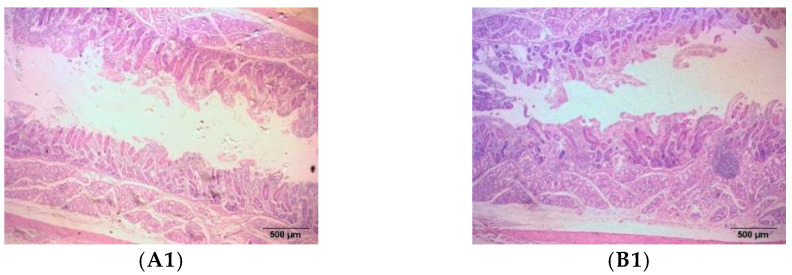
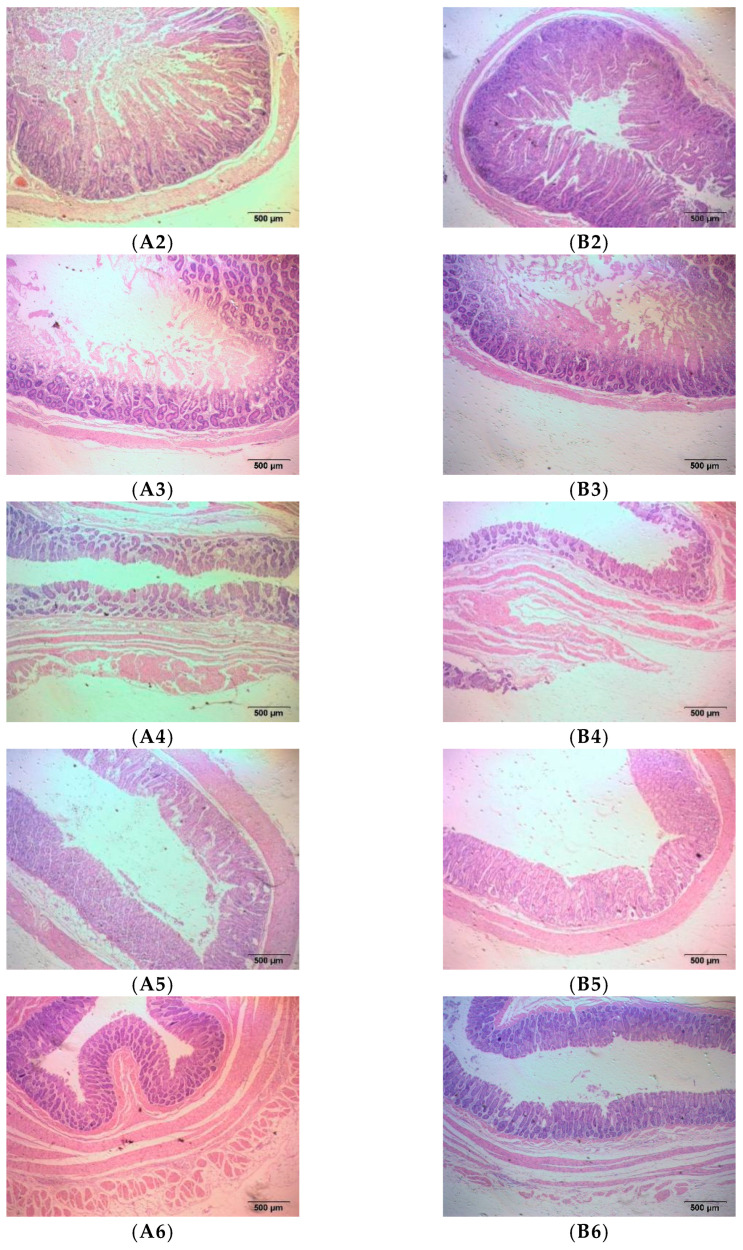
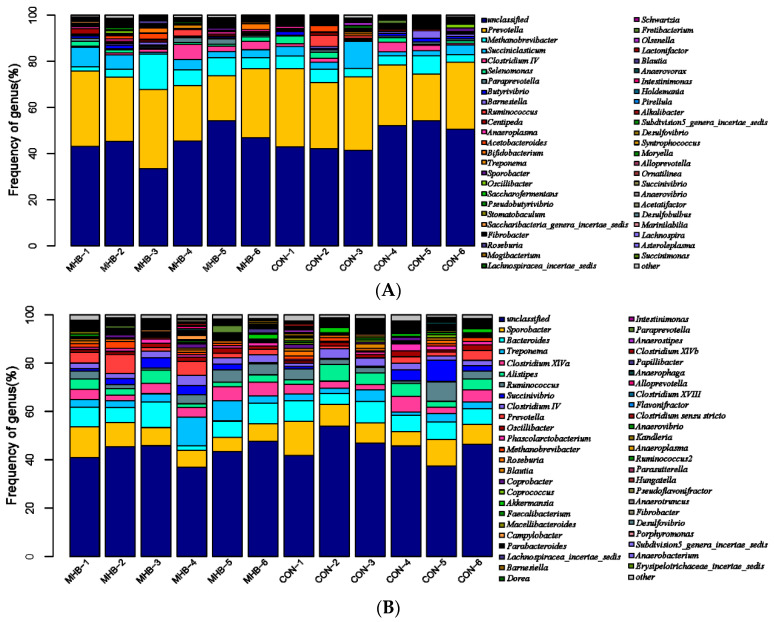
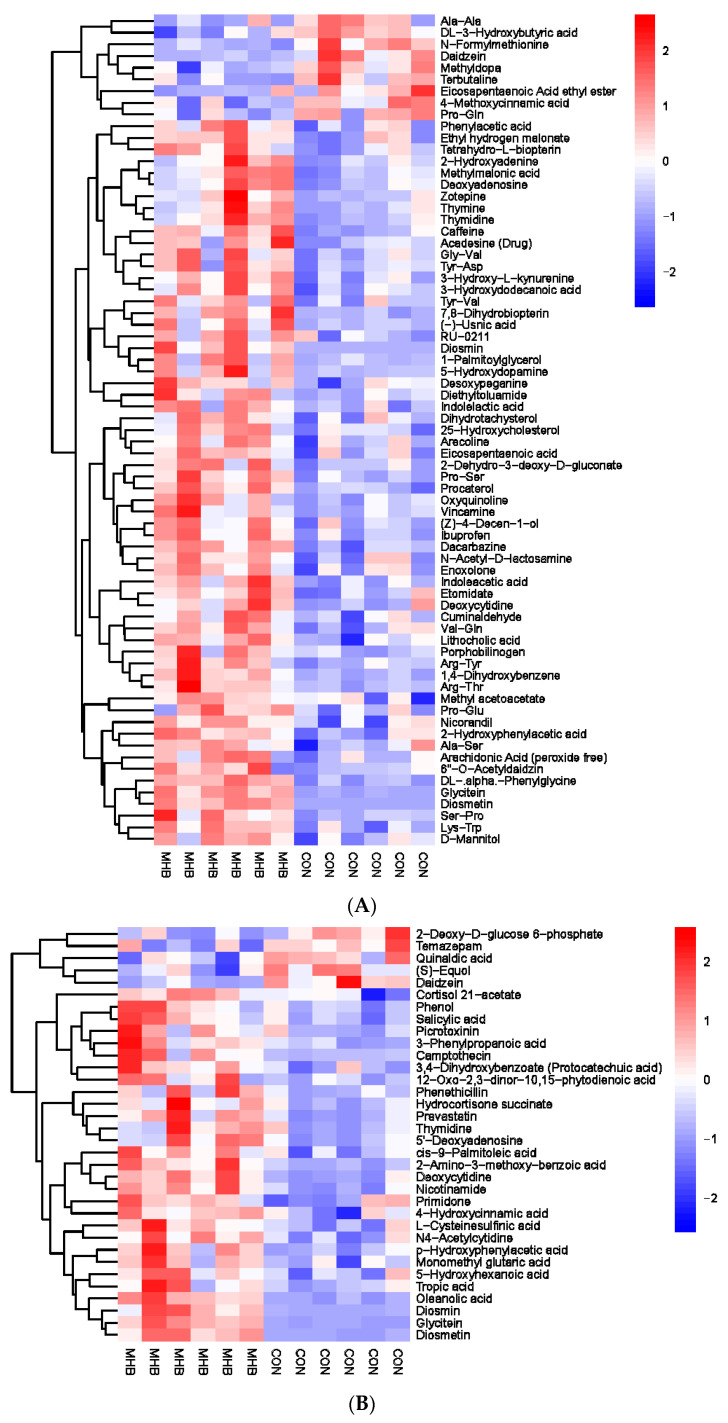
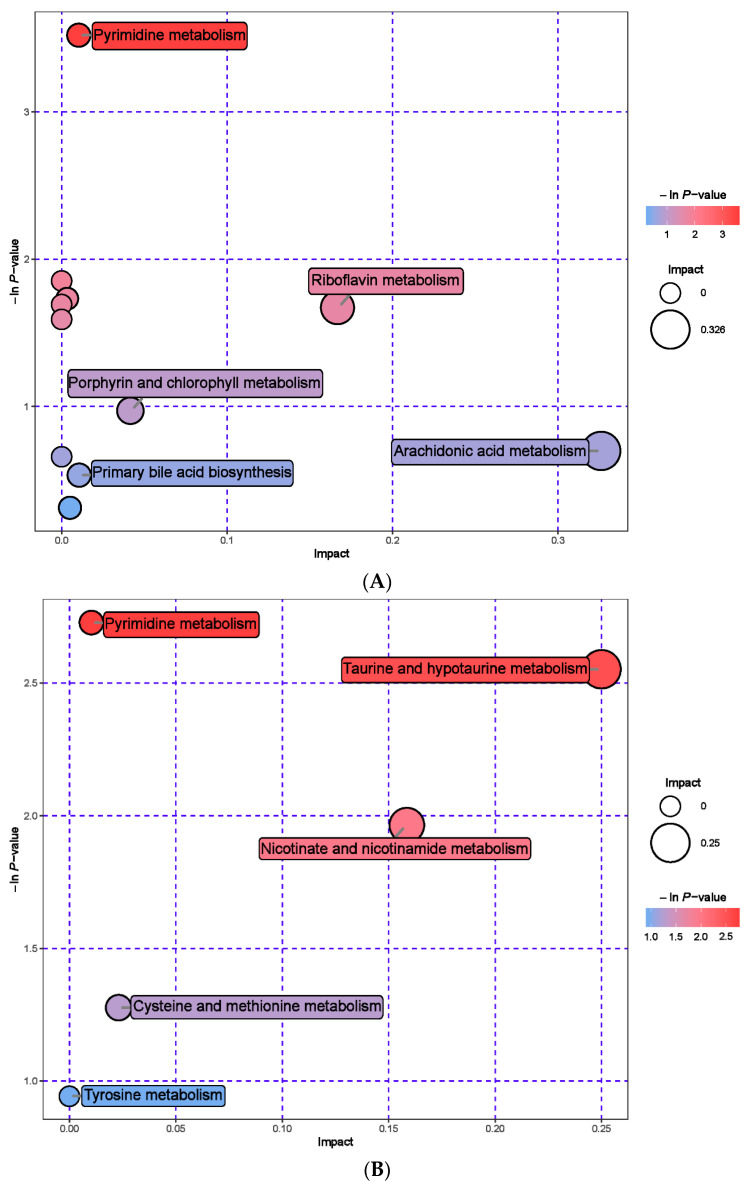
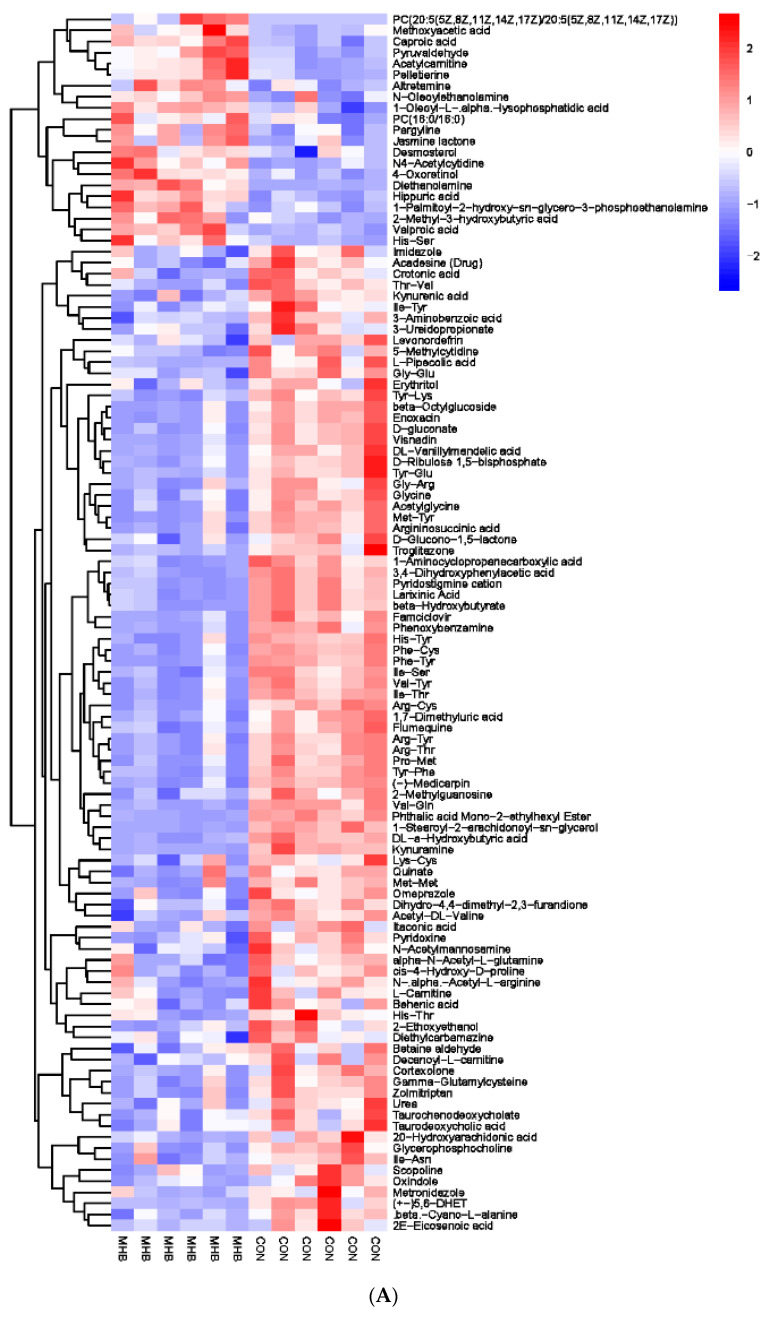
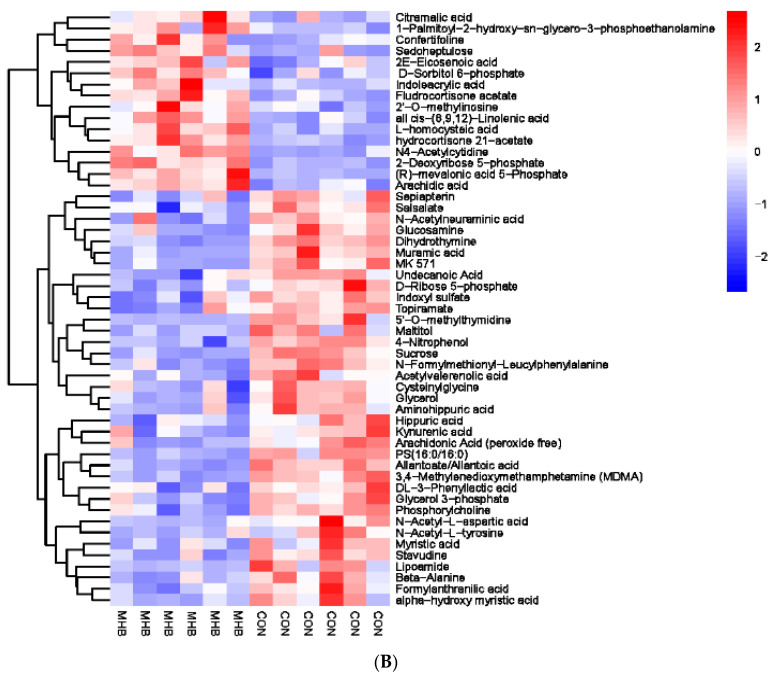
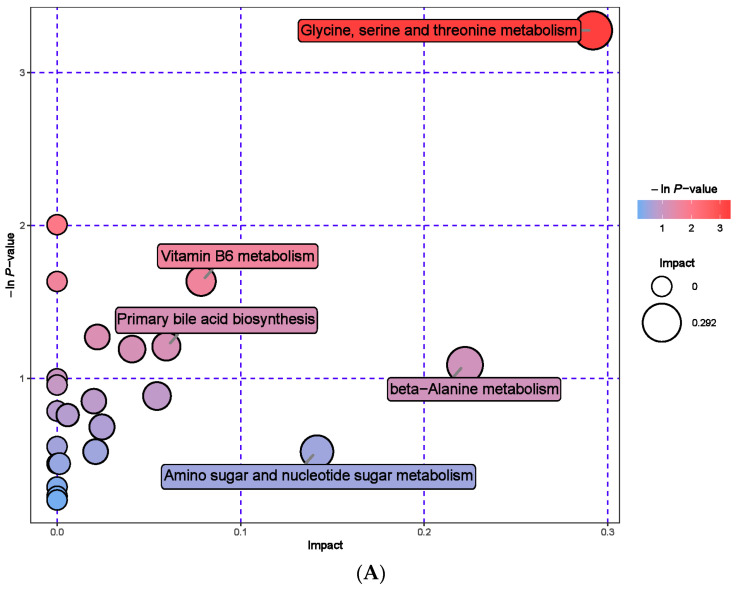
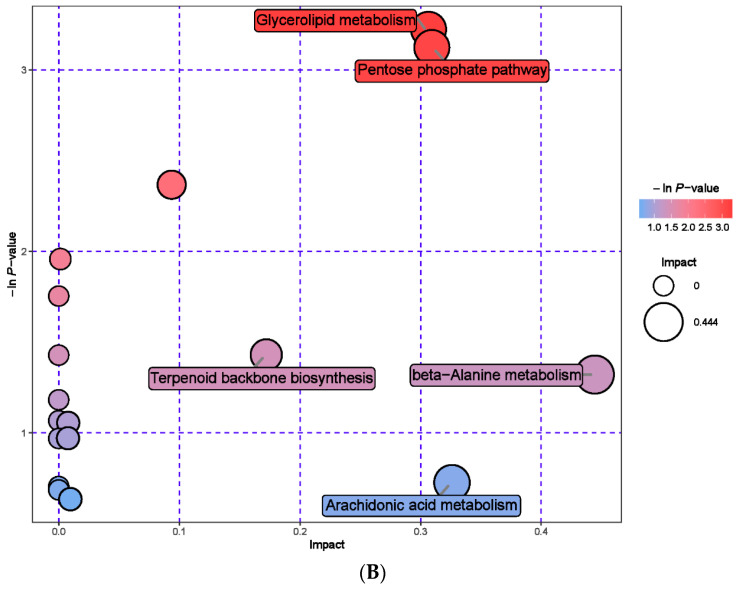
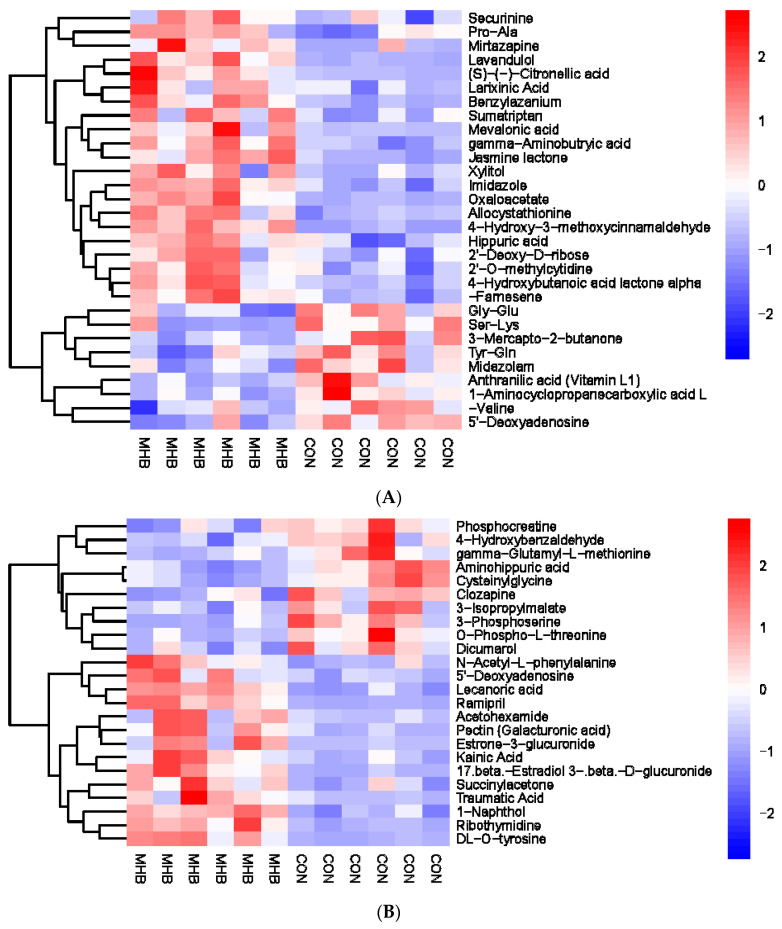
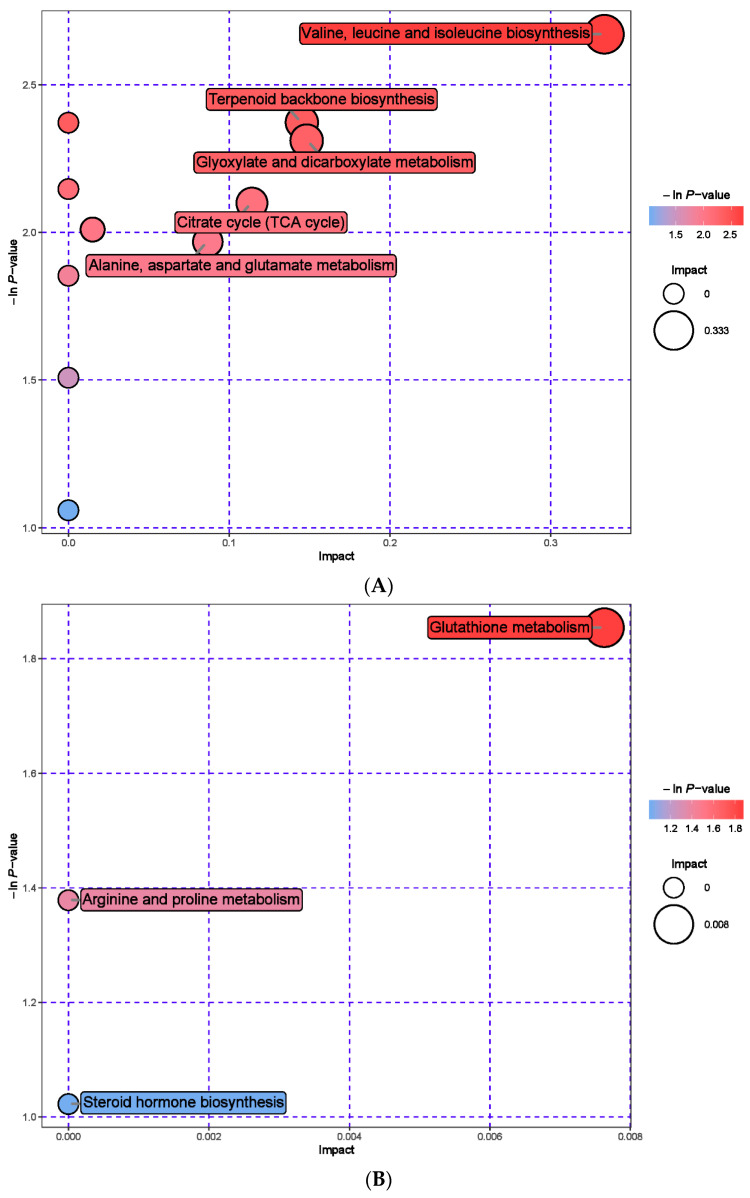
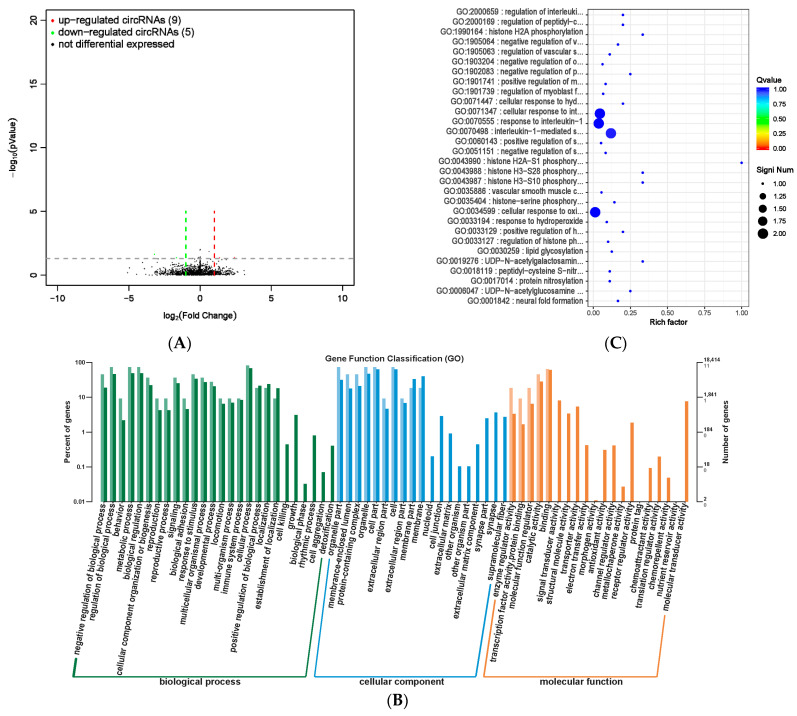
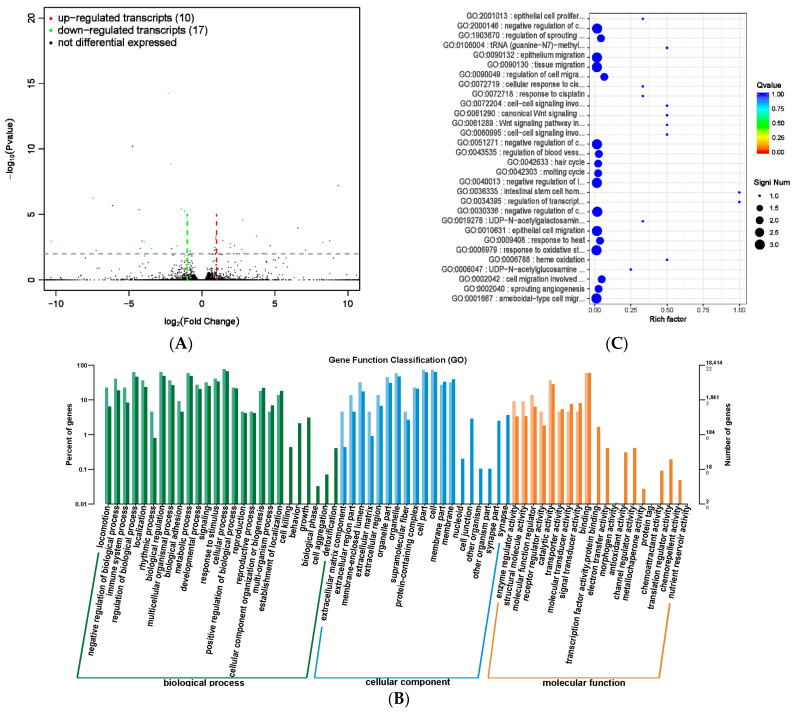
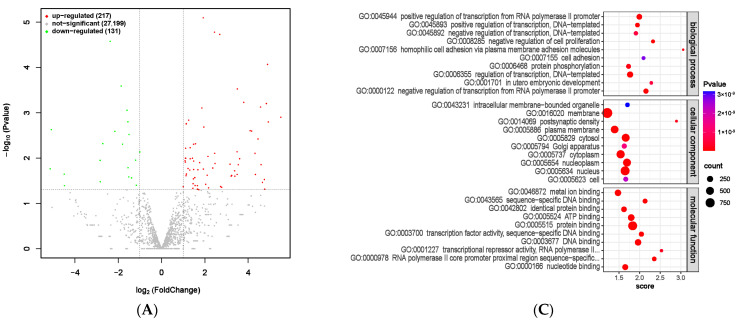
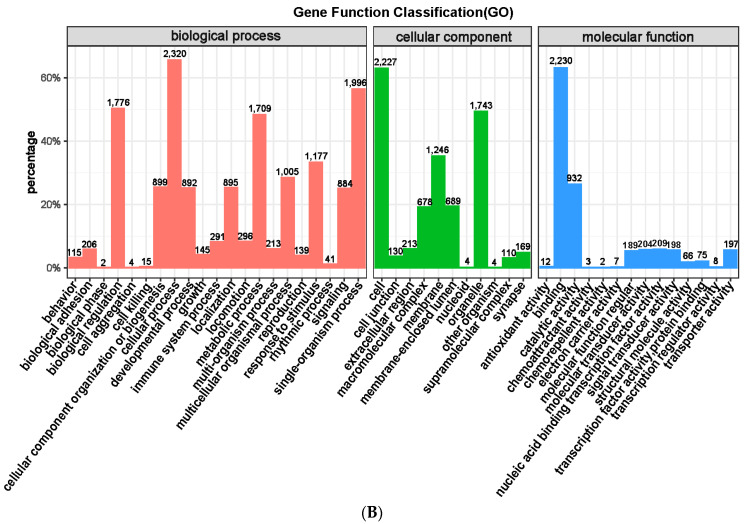
Mentha haplocalyx Briq (MHB) and its components have been proven to improve the growth performance of livestock and poultry. The aim of this experiment was to investigate the effects of MHB addition on growth performance, rumen and fecal microbiota, rumen fluid, serum and urine metabolism, and transcriptomics of rumen epithelial cells in meat sheep. Twelve Hu sheep were selected for the experiment and fed with basic diet (CON) and a basal diet supplemented with 80 g/kg DM of Mentha haplocalyx Briq (MHB). The experimental period was 10 weeks with the first 2 weeks as the pre-trial period. The results showed that compared with the CON group, the average daily weight gain of meat sheep in the MHB group increased by 20.1%; the total volatile fatty acid (VFA) concentration significantly increased (p < 0.05); The thickness of the cecal mucosal layer was significantly reduced (p < 0.01), while the thickness of the colonic mucosal layer was significantly increased (p < 0.05), the length of ileal villi significantly increased (p < 0.01), the thickness of colonic mucosal layer and rectal mucosal muscle layer significantly increased (p < 0.05), and the thickness of cecal mucosal layer significantly decreased (p < 0.05); The serum antioxidant capacity has increased. At the genus level, the addition of MHB changed the composition of rumen and fecal microbiota, increased the relative abundance of Paraprevotella, Alloprevotella, Marinilabilia, Saccharibacteria_genera_incertae_sedis, Subdivision5_genera_incertae_sedis and Ornatilinea in rumen microbiota, and decreased the relative abundance of Blautia (p < 0.05). The relative abundance of Prevotella, Clostridium XlVb and Parasutterella increased in fecal microbiota, while the relative abundance of Blautia and Coprococcus decreased (p < 0.05). There were significant differences in the concentrations of 105, 163, and 54 metabolites in the rumen, serum, and urine between the MHB group and the CON group (p < 0.05). The main metabolic pathways of the differences were pyrimidine metabolism, taurine and taurine metabolism, glyceride metabolism, and pentose phosphate pathway (p < 0.05), which had a significant impact on protein synthesis and energy metabolism. The transcriptome sequencing results showed that differentially expressed genes were mainly enriched in immune regulation, energy metabolism, and protein modification. Therefore, adding MHB improved the growth performance of lambs by altering rumen and intestinal microbiota, rumen, serum and urine metabolomics, and transcriptome.

Keywords: MHB; growth performance; metabolites; microorganisms; transcriptome.


Conflict of interest statement

The authors declare no conflict of interest.

Figures

Figure 1
Figure 1
Experimental design and workflow of feeding fattening sheep with mint diet. Including rumen and fecal microbiome, rumen fluid, serum and urine metabolome, and transcriptome sequencing of rumen epithelial cells. Twelve Hu sheep were randomly assigned to a basal diet (CON), or a basal diet supplemented with 80 g/kg peppermint DM (MHB).
Figure 2
Figure 2
Histomorphology of intestinal segments in fattening sheep fed with MHB diet. (A) CON, (B) MHB; (1) Duodenum, (2) Jejunum, (3) Ileum, (4) Cecum, (5) Colon, (6) Rectum.
Figure 2
Figure 2
Histomorphology of intestinal segments in fattening sheep fed with MHB diet. (A) CON, (B) MHB; (1) Duodenum, (2) Jejunum, (3) Ileum, (4) Cecum, (5) Colon, (6) Rectum.
Figure 3
Figure 3
Distribution characteristics of horizontal microbiota in the MHB group. (A) Distribution of rumen microbiota, (B) distribution of fecal microbiota.
Figure 4
Figure 4
Hierarchical cluster analysis of rumen metabolites in fattening sheep. (A) Hierarchical clustering analysis of MHB groups in cationic mode, (B) hierarchical cluster analysis of MHB Group in anionic mode. Note: The horizontal axis represents different experimental groups, the vertical axis represents the differential metabolites compared in the group, the blue color block represents the relative expression level of the corresponding position metabolites is down regulated, and the red color block represents the up regulation.
Figure 5
Figure 5
Pathway analysis of rumen metabolomics in fattening sheep. (A) Pathway analysis of MHB group in cationic mode, (B) pathway analysis of MHB group in anionic mode. Note: The color and size of bubbles indicate the impact of mint treatment on sample metabolism, while larger red bubbles indicate a greater impact on the pathway.
Figure 6
Figure 6
Hierarchical cluster analysis of serum metabolites in fattening sheep. (A) Hierarchical cluster analysis of MHB group serum in cationic mode, (B) hierarchical cluster analysis of MHB Group serum in anionic mode.
Figure 6
Figure 6
Hierarchical cluster analysis of serum metabolites in fattening sheep. (A) Hierarchical cluster analysis of MHB group serum in cationic mode, (B) hierarchical cluster analysis of MHB Group serum in anionic mode.
Figure 7
Figure 7
Pathway analysis of serum metabolomics. (A) Pathway analysis of MHB group serum in cationic mode, (B) pathway analysis of MHB group serum under anionic mode.
Figure 7
Figure 7
Pathway analysis of serum metabolomics. (A) Pathway analysis of MHB group serum in cationic mode, (B) pathway analysis of MHB group serum under anionic mode.
Figure 8
Figure 8
Hierarchical cluster analysis of urine metabolites in fattening sheep. (A) Hierarchical cluster analysis of MHB group urine in cationic mode, (B) hierarchical cluster analysis of MHB group urine in anionic mode.
Figure 9
Figure 9
Pathway analysis of urine metabolomics. (A) Pathway analysis of MHB group urine in cationic mode, (B) pathway analysis of MHB group urine under anionic mode.
Figure 10
Figure 10
Differential expression analysis of circRNA between MHB group and CON group. (A) Volcano map of circRNA expression differences between MHB group and CON group. The horizontal axis represents the fold change (log (B/A)) value of the transcript expression difference between different groups, while the vertical axis represents the p-value of the transcript expression change. The smaller the p-value, the greater the −log (p-value), and the more significant the difference. Red represents upregulated transcripts, green represents downregulated transcripts, and black represents non differential transcripts, (B) histogram of host gene functional annotation classification for differentially expressed circRNA between MHB and CON groups. The horizontal axis represents the functional classification, while the vertical axis represents the number of genes within the classification (right) and their percentage in the total number of annotated genes (left). Light colors represent host genes, while dark colors represent all genes, (C) the top 30 functional scatter plots show significant enrichment of circRNA between the MHB group and the CON group. The vertical axis represents functional annotation information, while the horizontal axis represents the Rich factor corresponding to the function. The size of the Qvalue is represented by the color of the dot. The smaller the Qvalue, the closer the color is to red. The number of differentially expressed circRNA host genes is represented by the size of the dot.
Figure 11
Figure 11
Differential expression analysis of transcriptome between MHB group and CON group. (A) Volcano map of transcript expression differences between MHB group and CON group, (B) histogram of functional annotation classification of genes corresponding to MHB and CON differential transcripts, (C) the top 30 functional scatter plots show significant enrichment of differentially expressed transcripts in the MHB and CON groups.
Figure 12
Figure 12
Differential expression analysis of miRNA between MHB group and CON group. (A) Volcano map of miRNA expression differences between MHB group and CON group. (B) MHB group and CON group differentially expressed miRNA GO annotation classification histogram. (C) The functional scatter plot shows a significant difference in miRNA enrichment between the MHB group and the CON group, with a top 10 × 3 degree (biological process, cellular component, and molecular function each with a top 10 degree).
Figure 12
Figure 12
Differential expression analysis of miRNA between MHB group and CON group. (A) Volcano map of miRNA expression differences between MHB group and CON group. (B) MHB group and CON group differentially expressed miRNA GO annotation classification histogram. (C) The functional scatter plot shows a significant difference in miRNA enrichment between the MHB group and the CON group, with a top 10 × 3 degree (biological process, cellular component, and molecular function each with a top 10 degree).

Similar articles

Cited by

References

    1. Jian Z., Zeng L., Xu T., Sun S., Yan S., Yang L., Huang Y., Jia J., Dou T. Antibiotic resistance genes in bacteria: Occurrence, spread, and control. J. Basic Microbiol. 2021;61:1049–1070. doi: 10.1002/jobm.202100201. - DOI - PubMed
    1. Seidavi A., Tavakoli M., Asroosh F., Scanes C.G., Abd El-Hack M.E., Naiel M.A.E., Taha A.E., Aleya L., El-Tarabily K.A., Swelum A.A. Antioxidant and antimicrobial activities of phytonutrients as antibiotic substitutes in poultry feed. Environ. Sci. Pollut. Res. Int. 2022;29:5006–5031. doi: 10.1007/s11356-021-17401-w. - DOI - PubMed
    1. Schwartz B., Vetvicka V. Review: β-glucans as Effective Antibiotic Alternatives in Poultry. Molecules. 2021;26:3560. doi: 10.3390/molecules26123560. - DOI - PMC - PubMed
    1. Barton M.D. Antibiotic use in animal feed and its impact on human healt. Nutr. Res. Rev. 2000;13:279–299. doi: 10.1079/095442200108729106. - DOI - PubMed
    1. Mahendran G., Verma S.K., Rahman L.U. The traditional uses, phytochemistry and pharmacology of spearmint (Mentha spicata L.): A review. J. Ethnopharmacol. 2021;278:114266. doi: 10.1016/j.jep.2021.114266. - DOI - PubMed

LinkOut - more resources