

Prostate-Specific Membrane Antigen (PSMA) Expression Predicts Need for Early Treatment in Prostate Cancer Patients Managed with Active Surveillance
- PMID: 38003213
- PMCID: PMC10671119
- DOI: 10.3390/ijms242216022
Prostate-Specific Membrane Antigen (PSMA) Expression Predicts Need for Early Treatment in Prostate Cancer Patients Managed with Active Surveillance
Abstract
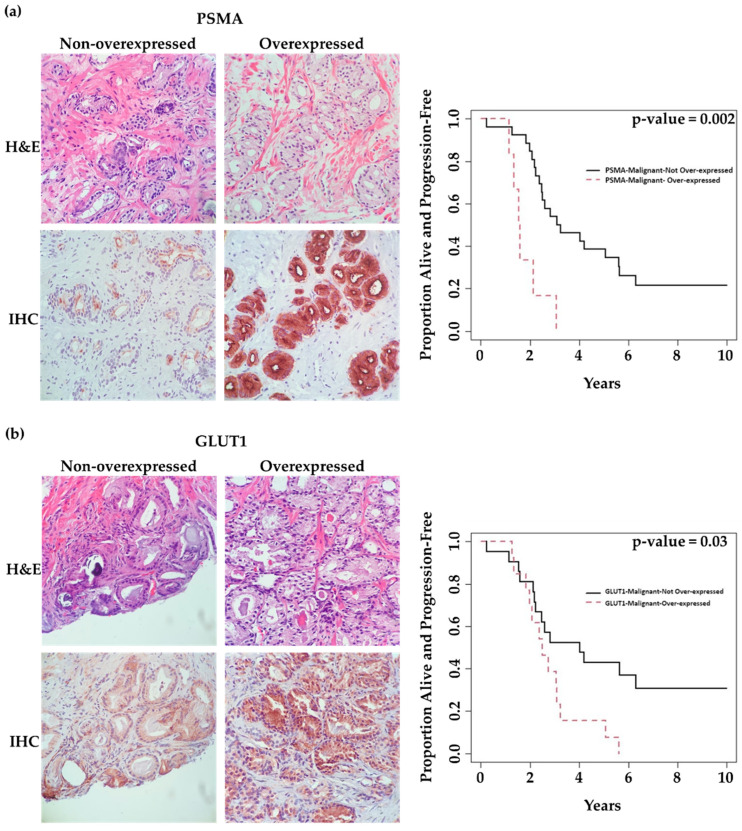
Metabolic dysregulation is an early event in carcinogenesis. Here, we examined the expression of enzymes involved in de novo lipogenesis (ATP-citrate lyase: ACLY), glucose uptake (Glucose Transporter 1: GLUT1), and folate-glutamate metabolism (Prostate-Specific Membrane Antigen: PSMA) as potential biomarkers of risk for early prostate cancer progression. Patients who were managed initially on active surveillance with a Gleason score of 6 or a low-volume Gleason score of 7 (3 + 4) were accrued from a prostate cancer diagnostic assessment program. Patients were asked to donate their baseline diagnostic biopsy tissues and permit access to their clinical data. PSMA, GLUT1, and ACLY expression were examined with immunohistochemistry (IHC) in baseline biopsies, quantitated by Histologic Score for expression in benign and malignant glands, and compared with patient time remaining on active surveillance (time-on-AS). All three markers showed trends for elevated expression in malignant compared to benign glands, which was statistically significant for ACLY. On univariate analysis, increased PSMA and GLUT1 expression in malignant glands was associated with shorter time-on-AS (HR: 5.06, [CI 95%: 1.83-13.94] and HR: 2.44, [CI 95%: 1.10-5.44], respectively). Malignant ACLY and benign gland PSMA and GLUT1 expression showed non-significant trends for such association. On multivariate analysis, overexpression of PSMA in malignant glands was an independent predictor of early PC progression (p = 0.006). This work suggests that the expression of metabolic enzymes determined by IHC on baseline diagnostic prostate biopsies may have value as biomarkers of risk for rapid PC progression. PSMA may be an independent predictor of risk for progression and should be investigated further in systematic studies.
Keywords: ACLY; GLUT1; PSMA; active surveillance; progression; prostate cancer.
Conflict of interest statement
The authors declare no conflict of interest. The funders had no role in the design of the study; in the collection, analyses, or interpretation of data; in the writing of the manuscript; or in the decision to publish the results.
Figures


Similar articles
-
More advantages in detecting bone and soft tissue metastases from prostate cancer using 18F-PSMA PET/CT.Hell J Nucl Med. 2019 Jan-Apr;22(1):6-9. doi: 10.1967/s002449910952. Epub 2019 Mar 7. Hell J Nucl Med. 2019. PMID: 30843003
-
High GLUT1 membrane expression and low PSMA membrane expression in Ductal Adenocarcinoma and Intraductal Carcinoma of the prostate.Prostate Cancer Prostatic Dis. 2024 Dec;27(4):720-727. doi: 10.1038/s41391-023-00759-y. Epub 2023 Nov 25. Prostate Cancer Prostatic Dis. 2024. PMID: 38007533
-
Performance of a Prostate-Specific Membrane Antigen Positron Emission Tomography/Computed Tomography-Derived Risk-Stratification Tool for High-risk and Very High-risk Prostate Cancer.JAMA Netw Open. 2021 Dec 1;4(12):e2138550. doi: 10.1001/jamanetworkopen.2021.38550. JAMA Netw Open. 2021. PMID: 34902034 Free PMC article.
-
68Ga-Labeled Prostate-specific Membrane Antigen Ligand Positron Emission Tomography/Computed Tomography for Prostate Cancer: A Systematic Review and Meta-analysis.Eur Urol Focus. 2018 Sep;4(5):686-693. doi: 10.1016/j.euf.2016.11.002. Epub 2016 Nov 15. Eur Urol Focus. 2018. PMID: 28753806
-
Correlation between PSA kinetics and PSMA-PET in prostate cancer restaging: A meta-analysis.Eur J Clin Invest. 2019 Mar;49(3):e13063. doi: 10.1111/eci.13063. Epub 2019 Jan 11. Eur J Clin Invest. 2019. PMID: 30580449
Cited by
-
LINC01559: roles, mechanisms, and clinical implications in human cancers.Hum Cell. 2025 Apr 9;38(3):83. doi: 10.1007/s13577-025-01218-7. Hum Cell. 2025. PMID: 40205068 Review.
-
Special Issue: "Novel Researches and Perspectives on Prostate Cancer".Int J Mol Sci. 2024 Feb 8;25(4):2054. doi: 10.3390/ijms25042054. Int J Mol Sci. 2024. PMID: 38396731 Free PMC article.
References
MeSH terms
Substances
Grants and funding
LinkOut - more resources
Full Text Sources
Medical
Research Materials
Miscellaneous
