

Impaired Angiogenic Function of Fetal Endothelial Progenitor Cells via PCDH10 in Gestational Diabetes Mellitus
- PMID: 38003275
- PMCID: PMC10671254
- DOI: 10.3390/ijms242216082
Impaired Angiogenic Function of Fetal Endothelial Progenitor Cells via PCDH10 in Gestational Diabetes Mellitus
Abstract
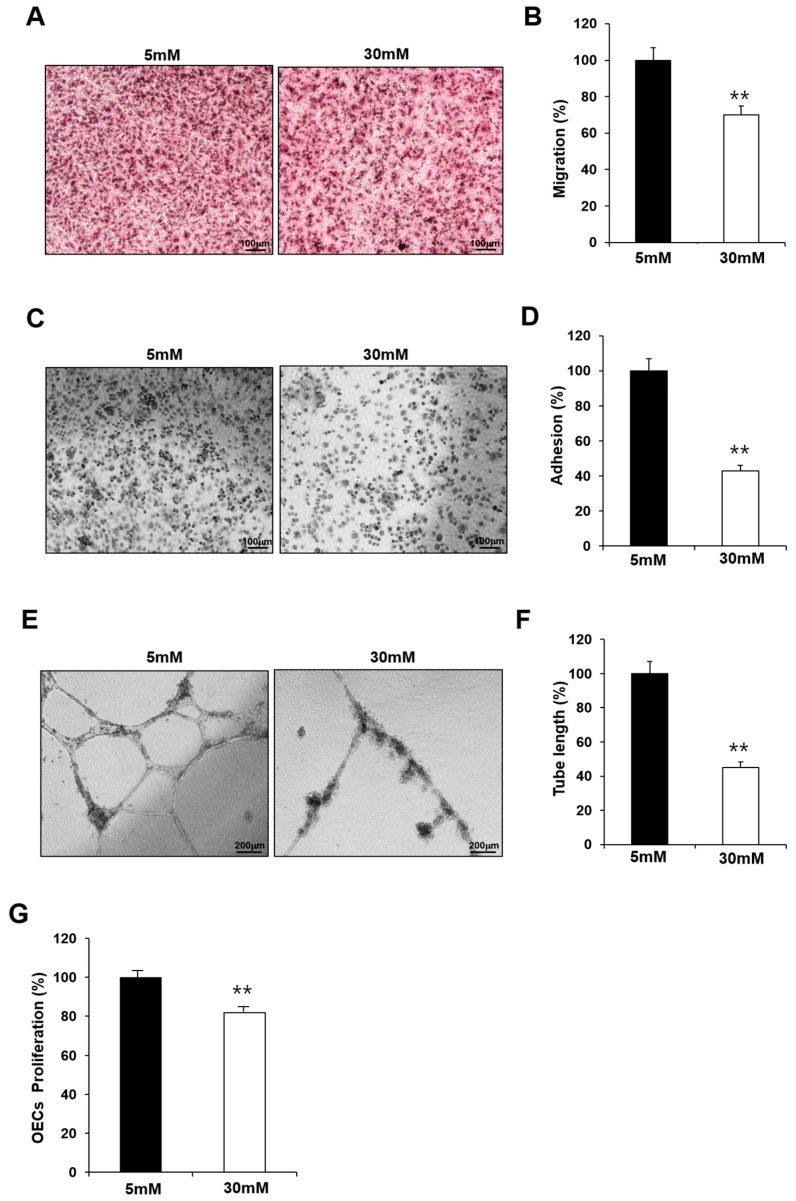
Maternal hyperglycemia, induced by gestational diabetes mellitus (GDM), has detrimental effects on fetal vascular development, ultimately increasing the risk of cardiovascular diseases in offspring. The potential underlying mechanisms through which these complications occur are due to functional impairment and epigenetic changes in fetal endothelial progenitor cells (EPCs), which remain less defined. We confirm that intrauterine hyperglycemia leads to the impaired angiogenic function of fetal EPCs, as observed through functional assays of outgrowth endothelial cells (OECs) derived from fetal EPCs of GDM pregnancies (GDM-EPCs). Notably, PCDH10 expression is increased in OECs derived from GDM-EPCs, which is associated with the inhibition of angiogenic function in fetal EPCs. Additionally, increased PCDH10 expression is correlated with the hypomethylation of the PCDH10 promoter. Our findings demonstrate that in utero exposure to GDM can induce angiogenic dysfunction in fetal EPCs through altered gene expression and epigenetic changes, consequently increasing the susceptibility to cardiovascular diseases in the offspring of GDM mothers.
Keywords: PCDH10; angiogenesis; endothelial progenitor cells; epigenetic changes; gestational diabetes mellitus.
Conflict of interest statement
The authors declare no conflict of interest.
Figures


Similar articles
-
Human Cord Blood Endothelial Progenitor Cells and Pregnancy Complications (Preeclampsia, Gestational Diabetes Mellitus, and Fetal Growth Restriction).Int J Mol Sci. 2024 Apr 18;25(8):4444. doi: 10.3390/ijms25084444. Int J Mol Sci. 2024. PMID: 38674031 Free PMC article. Review.
-
CD133+/C-kit+Lin- endothelial progenitor cells in fetal circulation demonstrate impaired differentiation potency in severe preeclampsia.Pregnancy Hypertens. 2019 Jan;15:146-153. doi: 10.1016/j.preghy.2018.12.005. Epub 2018 Dec 31. Pregnancy Hypertens. 2019. PMID: 30825912
-
Human fetoplacental arterial and venous endothelial cells are differentially programmed by gestational diabetes mellitus, resulting in cell-specific barrier function changes.Diabetologia. 2018 Nov;61(11):2398-2411. doi: 10.1007/s00125-018-4699-7. Epub 2018 Aug 8. Diabetologia. 2018. PMID: 30091044 Free PMC article.
-
Vitamin D rescues dysfunction of fetal endothelial colony forming cells from individuals with gestational diabetes.Placenta. 2015 Apr;36(4):410-8. doi: 10.1016/j.placenta.2015.01.195. Epub 2015 Feb 7. Placenta. 2015. PMID: 25684656
-
Altered maternal metabolism during mild gestational hyperglycemia as a predictor of adverse perinatal outcomes: A comprehensive analysis.Biochim Biophys Acta Mol Basis Dis. 2020 Feb 1;1866(2):165478. doi: 10.1016/j.bbadis.2019.05.014. Epub 2019 May 30. Biochim Biophys Acta Mol Basis Dis. 2020. PMID: 31152867 Review.
Cited by
-
Enhancing endothelial colony-forming cells for treating diabetic vascular complications: challenges and clinical prospects.Front Endocrinol (Lausanne). 2024 Jul 15;15:1396794. doi: 10.3389/fendo.2024.1396794. eCollection 2024. Front Endocrinol (Lausanne). 2024. PMID: 39076517 Free PMC article. Review.
-
Human Cord Blood Endothelial Progenitor Cells and Pregnancy Complications (Preeclampsia, Gestational Diabetes Mellitus, and Fetal Growth Restriction).Int J Mol Sci. 2024 Apr 18;25(8):4444. doi: 10.3390/ijms25084444. Int J Mol Sci. 2024. PMID: 38674031 Free PMC article. Review.
-
Restoration of NOX4 signalling reverses endothelial colony-forming cell angiogenic dysfunction associated with experimental and clinical diabetes.Stem Cell Res Ther. 2025 Jun 2;16(1):275. doi: 10.1186/s13287-025-04393-4. Stem Cell Res Ther. 2025. PMID: 40457435 Free PMC article.
References
-
- Metzger B.E., Buchanan T.A., Coustan D.R., de Leiva A., Dunger D.B., Hadden D.R., Hod M., Kitzmiller J.L., Kjos S.L., Oats J.N., et al. Summary and recommendations of the fifth international workshop-conference on gestational diabetes mellitus. Diabetes Care. 2007;30((Suppl. S2)):S251–S260. doi: 10.2337/dc07-s225. - DOI - PubMed
MeSH terms
Substances
Grants and funding
LinkOut - more resources
Full Text Sources
Medical
