

Exploring Reliable and Efficient Plasmonic Nanopatterning for Surface- and Tip-Enhanced Raman Spectroscopies
- PMID: 38003354
- PMCID: PMC10671507
- DOI: 10.3390/ijms242216164
Exploring Reliable and Efficient Plasmonic Nanopatterning for Surface- and Tip-Enhanced Raman Spectroscopies
Abstract
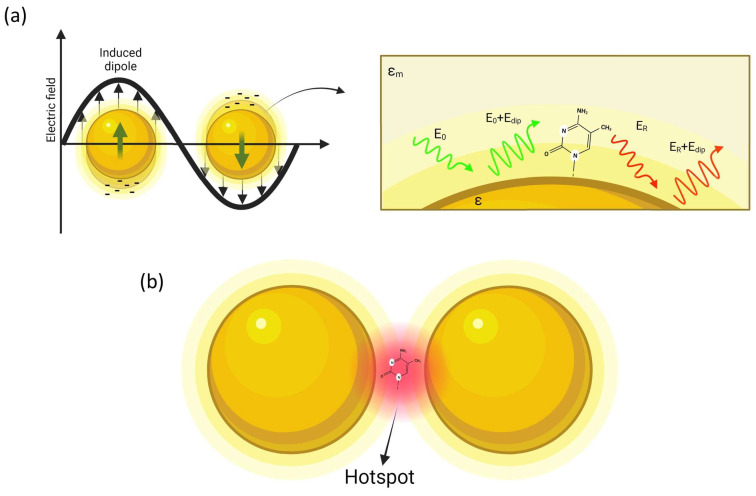
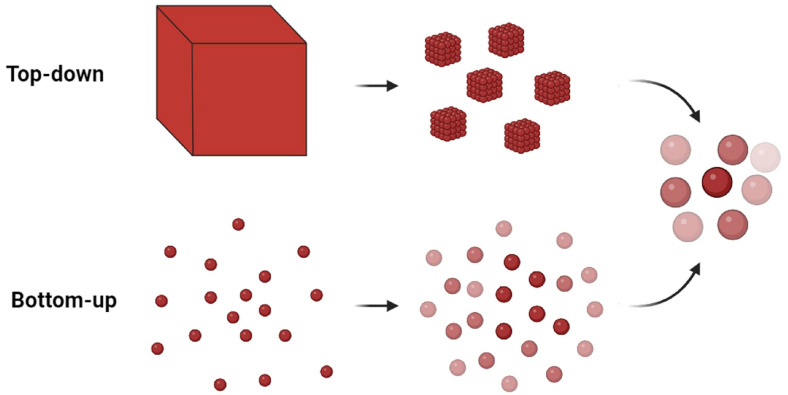
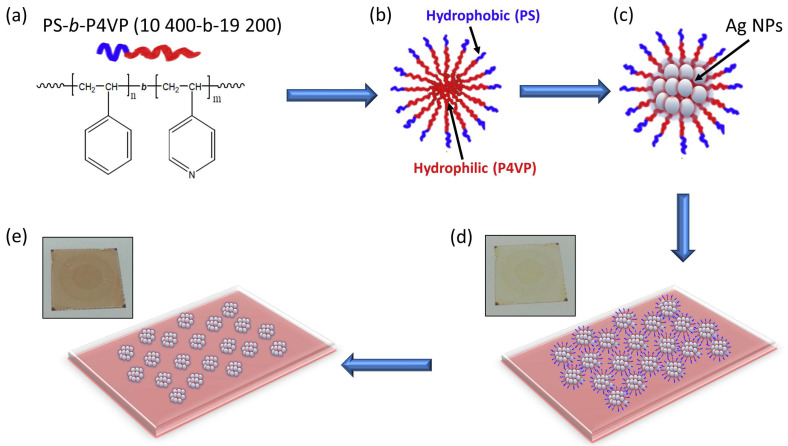
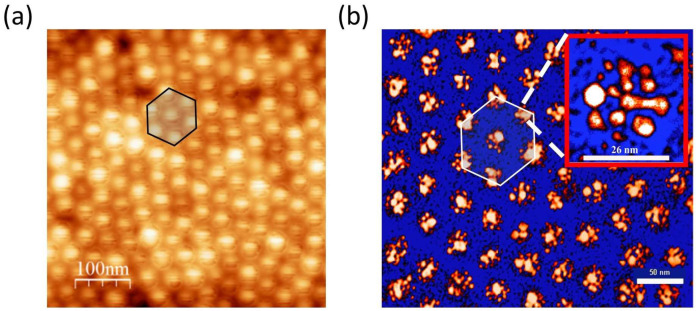
Surface-enhanced Raman scattering (SERS) is of growing interest for a wide range of applications, especially for biomedical analysis, thanks to its sensitivity, specificity, and multiplexing capabilities. A crucial role for successful applications of SERS is played by the development of reproducible, efficient, and facile procedures for the fabrication of metal nanostructures (SERS substrates). Even more challenging is to extend the fabrication techniques of plasmonic nano-textures to atomic force microscope (AFM) probes to carry out tip-enhanced Raman spectroscopy (TERS) experiments, in which spatial resolution below the diffraction limit is added to the peculiarities of SERS. In this short review, we describe recent studies performed by our group during the last ten years in which novel nanofabrication techniques have been successfully applied to SERS and TERS experiments for studying bio-systems and molecular species of environmental interest.
Keywords: Raman spectroscopy; biophotonics; surface- and tip-enhanced Raman scattering.
Conflict of interest statement
The authors declare no conflict of interest.
Figures
Similar articles
-
Surface- and Tip-Enhanced Raman Scattering by CdSe Nanocrystals on Plasmonic Substrates.Nanomaterials (Basel). 2022 Jun 26;12(13):2197. doi: 10.3390/nano12132197. Nanomaterials (Basel). 2022. PMID: 35808032 Free PMC article. Review.
-
Nanoscale chemical imaging using tip-enhanced Raman spectroscopy: a critical review.Angew Chem Int Ed Engl. 2013 Jun 3;52(23):5940-54. doi: 10.1002/anie.201203849. Epub 2013 Apr 22. Angew Chem Int Ed Engl. 2013. PMID: 23610002 Review.
-
Hot spots in different metal nanostructures for plasmon-enhanced Raman spectroscopy.Nanoscale. 2013 Nov 21;5(22):10794-805. doi: 10.1039/c3nr02924g. Epub 2013 Oct 11. Nanoscale. 2013. PMID: 24113688
-
Optimization of tip-enhanced Raman spectroscopy for probing the chemical structure of DNA.Spectrochim Acta A Mol Biomol Spectrosc. 2022 Nov 15;281:121595. doi: 10.1016/j.saa.2022.121595. Epub 2022 Jul 4. Spectrochim Acta A Mol Biomol Spectrosc. 2022. PMID: 35843060
-
Fabrication of a Biocompatible Mica/Gold Surface for Tip-Enhanced Raman Spectroscopy.Chemphyschem. 2020 Feb 4;21(3):188-193. doi: 10.1002/cphc.201901002. Epub 2020 Jan 8. Chemphyschem. 2020. PMID: 31912640 Free PMC article.
Cited by
-
SERS-Based Local Field Enhancement in Biosensing Applications.Molecules. 2024 Dec 30;30(1):105. doi: 10.3390/molecules30010105. Molecules. 2024. PMID: 39795162 Free PMC article. Review.
-
Raman analysis of lipids in cells: Current applications and future prospects.J Pharm Anal. 2025 Apr;15(4):101136. doi: 10.1016/j.jpha.2024.101136. Epub 2024 Nov 1. J Pharm Anal. 2025. PMID: 40242217 Free PMC article. Review.
References
-
- Keiser G. Biophotonics Concept and Applications. 1st ed. Springer; Singapore: 2016.
-
- Prasad P.N. Introduction to Biophotonics. Wiley; Hoboken, NJ, USA: 2003.
-
- Tsia K. Understanding Biophotonics: Fundamentals, Advances, and Applications. 1st ed. CRC Press; Boca Raton, FL, USA: 2015.
-
- Pavesi L., Fauchet P. Biophotonics. Springer-Verlag; Berlin/Heidelberg, Germany: 2008.
-
- Meglinski I. Biophotonics for Medical Applications. 1st ed. Woodhead Publishing; Sawston, UK: 2015.
Publication types
MeSH terms
Substances
LinkOut - more resources
Full Text Sources
Miscellaneous
