. 2023 Nov 14;24(22):16285.
doi: 10.3390/ijms242216285.

IK Channel-Independent Effects of Clotrimazole and Senicapoc on Cancer Cells Viability and Migration

Affiliations

IK Channel-Independent Effects of Clotrimazole and Senicapoc on Cancer Cells Viability and Migration

Paolo Zuccolini et al. Int J Mol Sci. .

Abstract

Many studies highlighted the importance of the IK channel for the proliferation and the migration of different types of cancer cells, showing how IK blockers could slow down cancer growth. Based on these data, we wanted to characterize the effects of IK blockers on melanoma metastatic cells and to understand if such effects were exclusively IK-dependent. For this purpose, we employed two different blockers, namely clotrimazole and senicapoc, and two cell lines: metastatic melanoma WM266-4 and pancreatic cancer Panc-1, which is reported to have little or no IK expression. Clotrimazole and senicapoc induced a decrease in viability and the migration of both WM266-4 and Panc-1 cells irrespective of IK expression levels. Patch-clamp experiments on WM266-4 cells revealed Ca2+-dependent, IK-like, clotrimazole- and senicapoc-sensitive currents, which could not be detected in Panc-1 cells. Neither clotrimazole nor senicapoc altered the intracellular Ca2+ concentration. These results suggest that the effects of IK blockers on cancer cells are not strictly dependent on a robust presence of the channel in the plasma membrane, but they might be due to off-target effects on other cellular targets or to the blockade of IK channels localized in intracellular organelles.

Keywords: IK; KCNN4; KCa3.1; blockers; cancer; clotrimazole; melanoma; pancreatic duct adenocarcinoma (PDAC); senicapoc.


Conflict of interest statement

The authors declare no conflict of interest.

Figures

Figure 1
Figure 1
IK blockers affect WM266−4 and Panc−1 viability regardless of IK channel expression. (A) Relative KCNN4 expression from RT-qPCR showing the difference in KCNN4 mRNA levels between WM266-4 and Panc-1 (N = 3). (B) Results from MTT viability assays after 72 h of exposure to 30 µM clotrimazole, 30 µM senicapoc or the corresponding amount of DMSO (N = 4 for all). Data are reported as absorbance (570 nm) ratio drug-/DMSO-treated cells (color code reported in the legend). (C) Exemplary pictures from experiments in (B): WM266-4 and Panc-1 cells treated for 72 h with 30 µM clotrimazole, 30 µM senicapoc or the corresponding amount of DMSO. Significance level is indicated by two asterisks (p < 0.01).
Figure 2
Figure 2
Clotrimazole and senicapoc decrease the migration of WM266-4 and Panc-1. (A) Migration rate from trans-well migration assays of cells exposed to 30 µM clotrimazole or 30 µM senicapoc with respect to DMSO-treated cells (N = 4 for all). Different cell lines and treatments are color coded as reported in the legend. (B) Relative increases of cell-covered areas at t = 24 h with respect to t = 0 from the same petri dish for WM266-4 (DMSO N = 9, clotrimazole N = 9, senicapoc N = 8) and Panc-1 (DMSO N = 6, clotrimazole N = 6, senicapoc N = 5). Data are significantly different from control for WM266-4, clotrimazole (p = 0.0128), WM266-4, senicapoc (p = 0.001), and Panc-1, senicapoc (p = 0.0246). Significance level is indicated by an asterisk (p < 0.05).
Figure 3
Figure 3
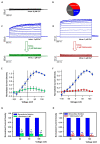
Ca2+−evoked whole-cell currents of WM266−4 cells. (A) Exemplary current traces of WM266-4 whole-cell currents when the patch pipette was filled with the Ca2+-free intracellular solution. (B) Distribution of current amplitudes in WM266-4 cells measured at 100 mV with 1 µM Ca2+ in the pipette solution. (C) Exemplary WM266-4 current traces from recordings with 1 µM Ca2+ in the intracellular solution; cells were perfused with standard bath solution (top) or with the same solution + 1 µM senicapoc (bottom). (D) Exemplary Panc-1 current traces from recordings with 1 µM Ca2+ in the intracellular solution; cells were perfused with standard bath solution (top) or with the same solution + 1µM clotrimazole (bottom). (E) Average normalized IVs of WM266-4 cells before (blue circles) and after (green circles) application of 1 µM senicapoc (N = 4 cells). Currents are normalized to the value at 100 mV. (F) Average normalized IVs of WM266-4 cells before (blue circles) and after (red circles) application of 1 µM clotrimazole (N = 4). Currents are normalized to the value at 100 mV. (G) Background-subtracted currents (background was calculated from the mean of 4 cells measured in Ca2+-free conditions) in the presence/absence of senicapoc normalized to the currents measured in standard bath solution at the same voltage in the same cells (mean ± SE, N = 4). (H) Background-subtracted currents in the presence/absence of clotrimazole normalized for the currents measured in standard bath solution at the same voltage in the same cells (mean ± SE, N = 4). Significance level is indicated by two asterisks (p < 0.01).
Figure 4
Figure 4
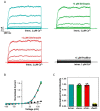
Panc−1 cells lack functional IK channels. (A) Current traces measured from a typical Panc-1 cell with 1 µM Ca2+ in the patch pipette in standard extracellular solution (top left), during perfusion with 1 µM senicapoc (top right), with 1 µM clotrimazole (bottom left) or 1 µM paxilline (bottom right). (B) Average normalized current voltage relationship in control conditions (turquoise symbols), in 1 µM senicapoc (green symbols, N = 7), 1 µM clotrimazole (red symbols, N = 7) and 1 µM paxilline (black symbols, N = 7) (currents are normalized to those measured in control conditions at 100 mV; error bars indicate SEM). (C) Average current density normalized to that measured in control conditions at 100 mV in the indicated conditions.
Figure 5
Figure 5
Senicapoc and clotrimazole do not alter the intracellular Ca2+ concentration. (A) [Ca2+]i over time from 32 WM266-4 cells (color code in the legend). (B) Mean Δ[Ca2+]i from (A) with respect to bath solution (color-coded as in (A), N = 32). (C) Mean [Ca2+]i over time from 32 Panc-1 cells (color-coded as in (A)). (D) mean Δ[Ca2+]i from (C) with respect to bath solution (color-coded as in (C), N = 32).
Figure 6
Figure 6
Effect of IK blockers on F-actin organization. WM266-4 (A) and Panc-1 (B) cells incubated for 24 h in vehicle alone or with 30 µM clotrimazole, 30 µM senicapoc or the corresponding volume of DMSO, which have subsequently been labeled with phalloidin (red) and DAPI (blue) and processed for fluorescence microscopy (see Section 4).
Figure 7
Figure 7
Effect of BA6b9 on IK−currents in WM266−4 cells and on viability in WM266−4 and Panc−1 cells. (A) Example currents measured from WM266-4 cells with 1 µM Ca2+ in the patch pipette in standard extracellular solution (top) and during perfusion with 20 µM (left) or 60 µM (right) BA69B. (B) Average normalized current voltage relationship in control conditions (blue symbols), in 20 µM BA6b9 (magenta circles), and 60 µM BA6b9 (magenta triangles) (currents are normalized to those measured in control conditions at 100 mV; N = 4 each, error bars indicate SEM). (C) Results from MTT viability assays after 72 h of exposure to DMSO (control) and the indicated concentrations of BA6b9 (N ≥ 4). Data are reported as absorbance (570 nm) ratio drug-/DMSO-treated cells (color-code reported in the legend. Significance level is indicated by an asterisk (p < 0.05).

Similar articles

Cited by

References

    1. Anderson K.J., Cormier R.T., Scott P.M. Role of ion channels in gastrointestinal cancer. World J. Gastroenterol. 2019;25:5732–5772. doi: 10.3748/wjg.v25.i38.5732. - DOI - PMC - PubMed
    1. Lastraioli E., Iorio J., Arcangeli A. Ion channel expression as promising cancer biomarker. Biochim. Biophys. Acta. 2015;1848:2685–2702. doi: 10.1016/j.bbamem.2014.12.016. - DOI - PubMed
    1. Huang X., Jan L.Y. Targeting potassium channels in cancer. J. Cell Biol. 2014;206:151–162. doi: 10.1083/jcb.201404136. - DOI - PMC - PubMed
    1. D’Amico M., Gasparoli L., Arcangeli A. Potassium channels: Novel emerging biomarkers and targets for therapy in cancer. Recent Pat. Anti-Cancer Drug Discov. 2013;8:53–65. doi: 10.2174/1574892811308010053. - DOI - PubMed
    1. Abdul Kadir L., Stacey M., Barrett-Jolley R. Emerging Roles of the Membrane Potential: Action Beyond the Action Potential. Front. Physiol. 2018;9:1661. doi: 10.3389/fphys.2018.01661. - DOI - PMC - PubMed