. 2023 Nov 14;24(22):16289.
doi: 10.3390/ijms242216289.

Nanoscale Bilirubin Analysis in Translational Research and Precision Medicine by the Recombinant Protein HUG

Affiliations

Nanoscale Bilirubin Analysis in Translational Research and Precision Medicine by the Recombinant Protein HUG

Paola Sist et al. Int J Mol Sci. .

Abstract

Bilirubin is a toxicological biomarker for hemolysis and liver diseases. The current automated diazo method used in clinical chemistry has limited applicability in rodent models and cannot be used in small animals relevant to toxicology, microphysiological systems, cell cultures, and kinetic studies. Here, we present a versatile fluorometric method for nanoscale analysis of bilirubin based on its highly specific binding to the recombinant bifunctional protein HELP-UnaG (HUG). The assay is sensitive (LoQ = 1.1 nM), accurate (4.5% relative standard error), and remarkably robust, allowing analysis at pH 7.4-9.5, T = 25-37 °C, in various buffers, and in the presence of 0.4-4 mg × L-1 serum albumin or 30% DMSO. It allows repeated measurements of bilirubinemia in murine models and small animals, fostering the 3Rs principle. The assay determines bilirubin in human plasma with a relative standard error of 6.7% at values that correlate and agree with the standard diazo method. Furthermore, it detects differences in human bilirubinemia related to sex and UGT1A1 polymorphisms, thus demonstrating its suitability for the uniform assessment of bilirubin at the nanoscale in translational and precision medicine.

Keywords: bilirubin; biomarker; biomedical diagnostics; calibration; fluorescent method; high-throughput assay.


Conflict of interest statement

The authors declare no conflict of interest.

Figures

Figure A1
Figure A1
Stability of bilirubin in DMSO solutions. Aliquots of a 5 mM BR in DMSO were thawed, diluted to 10 µM in PBS, and immediately analyzed (T = 25 °C) at increasing storage times.
Figure A2
Figure A2
Effect of HUG concentration on bilirubin-dependent fluorescence emission. Fluorescence intensity was recorded at different bilirubin concentrations in PBS, in the presence of different HUG concentrations. T = 25 °C, reaction time 1 h.
Figure A3
Figure A3
Experimental setup to evaluate the fluorometric signal stability of bilirubin in different solvents. The first calibration curve was prepared using freshly prepared bilirubin pre-calibrator standard solutions (10 µM). Then, the remaining aliquot of each solution was kept at 4 °C for increasingly longer periods and used after equilibration of the standard solutions at T = 25 °C for 30 min to obtain a specific calibration curve for different aging times. All fluorescence intensities were determined using the HUG-based assay.
Figure A4
Figure A4
(a) Effect of DMSO or BSA on bilirubin-dependent fluorescence emission by HUG. Nanoscale bilirubin solutions prepared in PBS with either 0.4 g × L1 BSA (filled circles) or DMSO (0.3%, open circles; 3%, squares; 30%, diamonds) were immediately incubated with 0.05 g × L1 (0.83 × 10⁶ M) HUG at T = 25 °C for 2 h. Fluorescence intensity data (means ± SD, n = 3 for each tested solvent) were fitted by linear regression analysis. (b) The upper tolerable limit of DMSO concentration in the HUG-based nanoscale bilirubin analysis. Bilirubin solutions (10 nM, circles; 25 nM, squares; 50 nM, triangles) were prepared in a standard buffer (PBS pH 7.4) containing increasing relative volumes of DMSO. Solutions were incubated with 0.05 g × L1 HUG at T = 25 °C for 2 h before fluoresce recording.
Figure 1
Figure 1
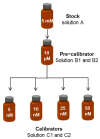
Preparation of standard bilirubin solutions. The solvent of solution A is DMSO. The solvent of solutions B and C is PBS without (B1 and C1) or with BSA (B2 and C2).
Figure 2
Figure 2
UV–visible spectra of 1−10 µM bilirubin in different solvents. (a) dimethylsulphoxyde (DMSO); (b) phosphate buffer (PBS), pH 7.4; (c) PBS with 4 g × L−1 human serum albumin (HSA), pH 7.4; (d) PBS with 4 g × L−1 bovine serum albumin (BSA), pH 7.4. Spectra were recorded at T = 25 °C using Suprasil quartz cuvettes 10 ± 0.01 mm in size.
Figure 3
Figure 3
Correlation of bilirubin analysis by direct UV–Vis spectroscopy versus the diazo colorimetric method. Bilirubin was dissolved in three solvents and analyzed by both methods. Data were fitted to the equation y = mx + q: PBS (empty circles and continuous line; m= 0.884, q = 1.58 × 10⁶, R2 = 0.998); PBS with 4 g × L1 BSA (filled circles and dashed line; m = 0.962, q = 0.667 × 10⁶, R2 = 0.997); 100% DMSO (empty squares and dotted line; m = 0.969, q = 1.18 × 10⁶, R2 = 0.998).
Figure 4
Figure 4
Effect of BSA concentration on the UV–Vis spectra of bilirubin. Bilirubin (BR) pre-calibrator solutions (10 µM) were prepared in PBS supplemented with different BSA concentrations. UV–Vis spectra were recorded at T = 25 °C after 30 min.
Figure 5
Figure 5
Stability of bilirubin pre-calibrator solutions. BR was dissolved in 100% DMSO (open triangles) or 0.1 M NaOH (open diamonds) or PBS (open circles) or PBS with 4 g × L1 BSA (filled circles). Solutions were maintained at constant T = 25 °C for up to 2 h and analyzed by UV–Vis spectroscopy at λmax, indicated in Table 2. Solutions in NaOH were analyzed at λmax = 425 nm. (a) 10 µM BR, (b) 1 µM BR.
Figure 6
Figure 6
Linearity range of bilirubin-dependent fluorescence emission of HUG. Fluorescence intensity of BR•HUG complex in a wide range of bilirubin concentrations in PBS (open circles) or PBS with 0.4 g × L1 BSA (filled circles). Experimental conditions: [HUG] = 0.05 g × L1 (0.83 × 10⁶ M), T = 25 °C, reaction time 1 h (PBS) or 2 h (PBS–BSA).
Figure 7
Figure 7
Progress of the bilirubin–HUG complex formation in the absence and in the presence of BSA. Bilirubin solutions at concentrations of 5 nM (up triangle), 10 nM (down triangle), 20 nM (diamond), 30 nM (circle), 40 nM (star), and 50 nM (square) were prepared in either PBS (open symbols and dotted lines) or PBS with 0.4 g × L1 BSA (filled symbols and continuous lines). They were incubated with 0.05 g × L1 (0.83 × 10⁶ M) HUG at T = 25 °C. Fluorescence intensity of the BR•HUG complex was monitored for up to 4 h. Data were fitted to the single exponential equation.
Figure 8
Figure 8
Calibration of bilirubin-dependent fluorescence emission of HUG. Nanoscale bilirubin solutions in PBS with 0.4 g × L1 BSA were incubated with 0.05 g × L1 (0.83 × 10⁶ M) HUG at T = 25 °C for 2 h. Fluorescence intensity data (means ± SD, n = 40 for each tested concentration) were fitted to the equation y = mx + q (parameters: m = 785, q = 146, R2 = 0.999). The inset shows the box-plot analysis of the angular coefficients (t-test unpaired).
Figure 9
Figure 9
Stability of nanomolar bilirubin solutions in different solvents. Bilirubin solutions (5, 10, 25, 50 nM) were prepared in PBS (open circles) or in PBS supplemented with 0.4 g × L1 BSA (filled circles) or 0.4 g × L1 HUG (diamonds) or 1% Triton X–100 (triangles up), or 0.4 g × L1 HELP (triangles down) and kept at T = 25 °C. Calibration curves and their respective angular coefficients (nM1) were obtained at different times, up to 70 h. * The dotted line across open squares refers to standard solutions prepared in PBS and immediately supplemented with 0.05 g × L1 HUG.
Figure 10
Figure 10
Comparison of total bilirubin analysis in human plasma samples by two assays. The analysis by the HUG assay was performed in the presence of β–glucuronidase (0.085 IU × µL–1). The analysis by the diazo reaction was performed in the presence of caffeine. (a) Correlation plot. (b) Bland–Altman plot, obtained by the software available in Carkeet, 2020. Red lines: Average of the two paired measurements (Diazo–HUG) and upper LoA (ULoA) and lower LoA (LLoA). Green lines: inner confidence limits (ICL). Blue lines outer confidence limits (OCL).

Similar articles

Cited by

References

    1. Li C., Stocker R. Heme oxygenase and iron: From bacteria to humans. Redox Rep. 2009;14:95–101. doi: 10.1179/135100009X392584. - DOI - PubMed
    1. Tift M.S., Alves de Souza R.W., Weber J., Heinrich E.C., Villafuerte F.C., Malhotra A., Otterbein L.E., Simonson T.S. Adaptive Potential of the Heme Oxygenase/Carbon Monoxide Pathway During Hypoxia. Front. Physiol. 2020;11:886. doi: 10.3389/fphys.2020.00886. - DOI - PMC - PubMed
    1. Asad S.F., Singh S., Ahmad A., Khan N.U., Hadi S.M. Prooxidant and antioxidant activities of bilirubin and its metabolic precursor biliverdin: A structure–activity study. Chem. Biol. Interact. 2001;137:59–74. doi: 10.1016/S0009-2797(01)00209-5. - DOI - PubMed
    1. Ryter S.W. Heme oxygenase-1: An anti-inflammatory effector in cardiovascular, lung, and related metabolic disorders. Antioxidants. 2022;11:555. doi: 10.3390/antiox11030555. - DOI - PMC - PubMed
    1. Campbell N.K., Fitzgerald H.K., Dunne A. Regulation of inflammation by the antioxidant haem oxygenase 1. Nat. Rev. Immunol. 2021;21:411–425. doi: 10.1038/s41577-020-00491-x. - DOI - PubMed

LinkOut - more resources