. 2023 Nov 14;24(22):16301.
doi: 10.3390/ijms242216301.

Gut Microbiome-Estrobolome Profile in Reproductive-Age Women with Endometriosis

Affiliations

Gut Microbiome-Estrobolome Profile in Reproductive-Age Women with Endometriosis

Angel Hsin-Yu Pai et al. Int J Mol Sci. .

Abstract

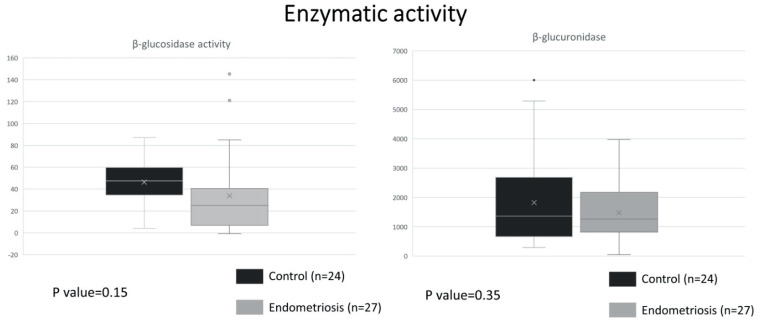
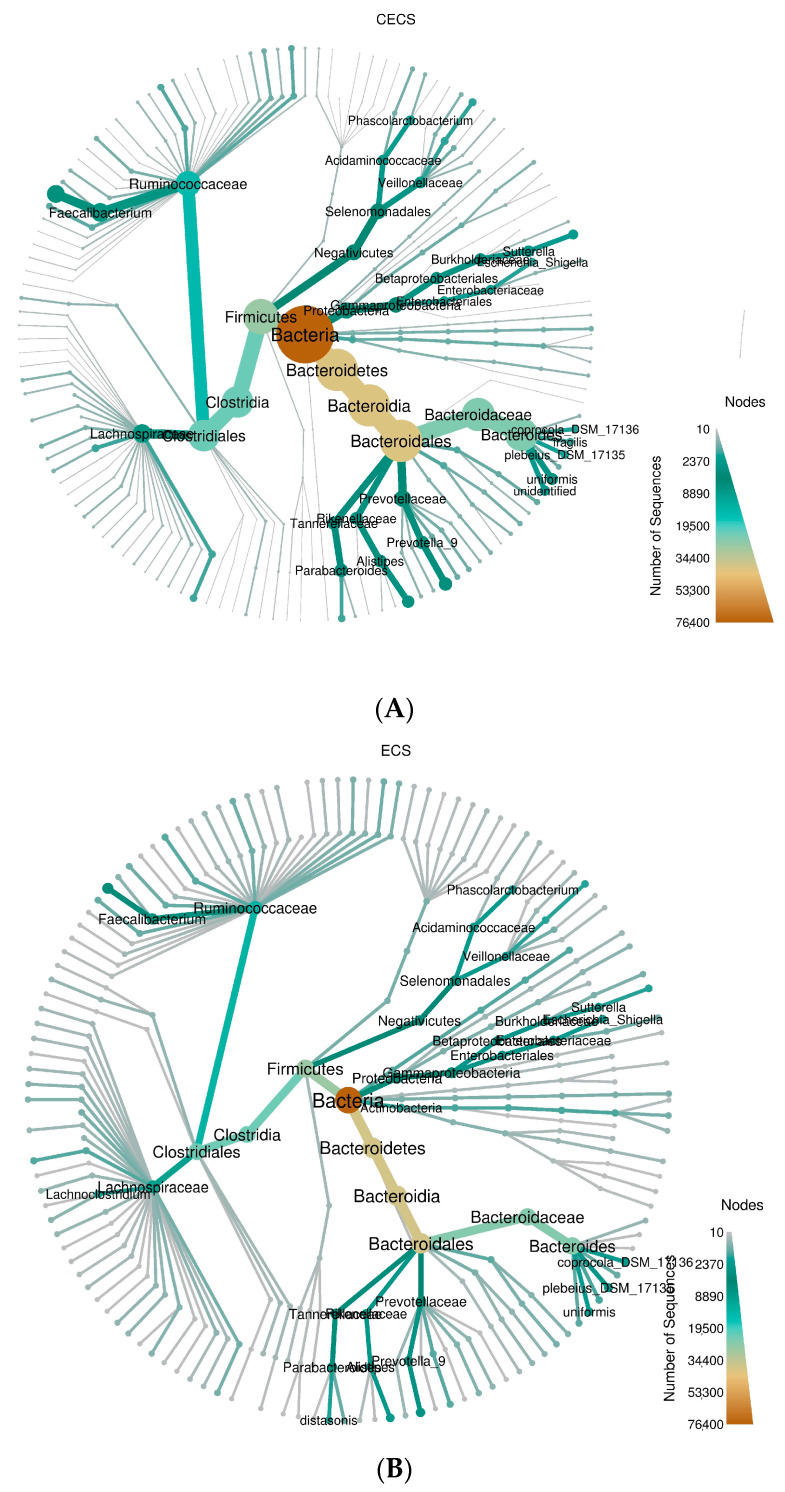
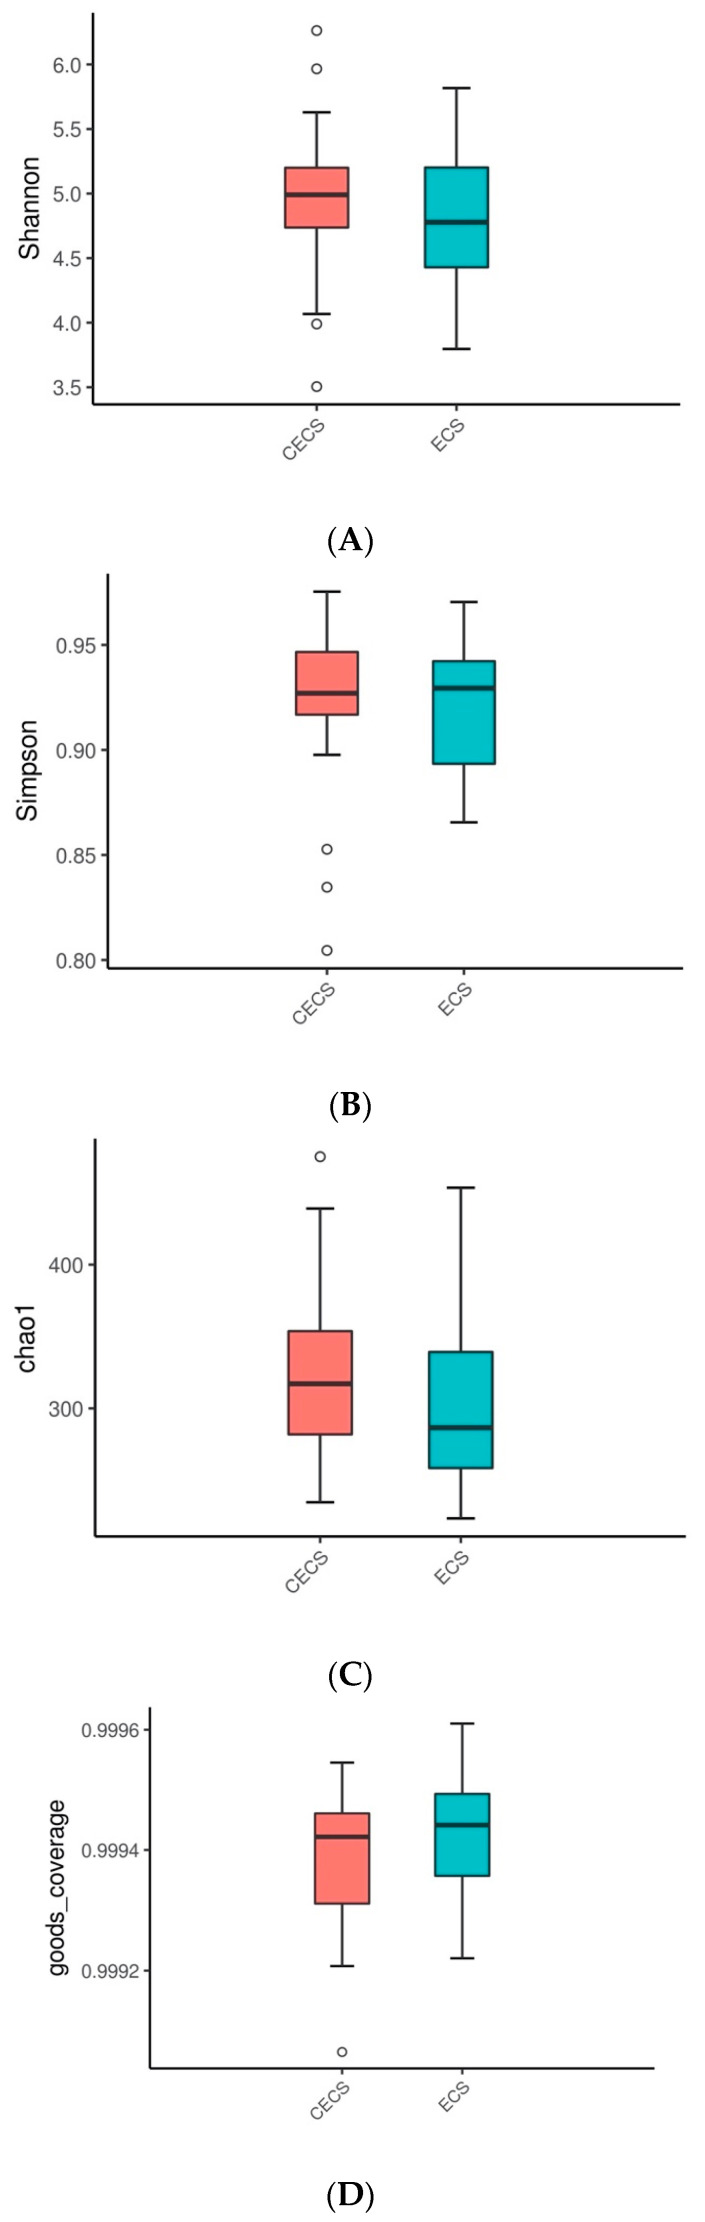
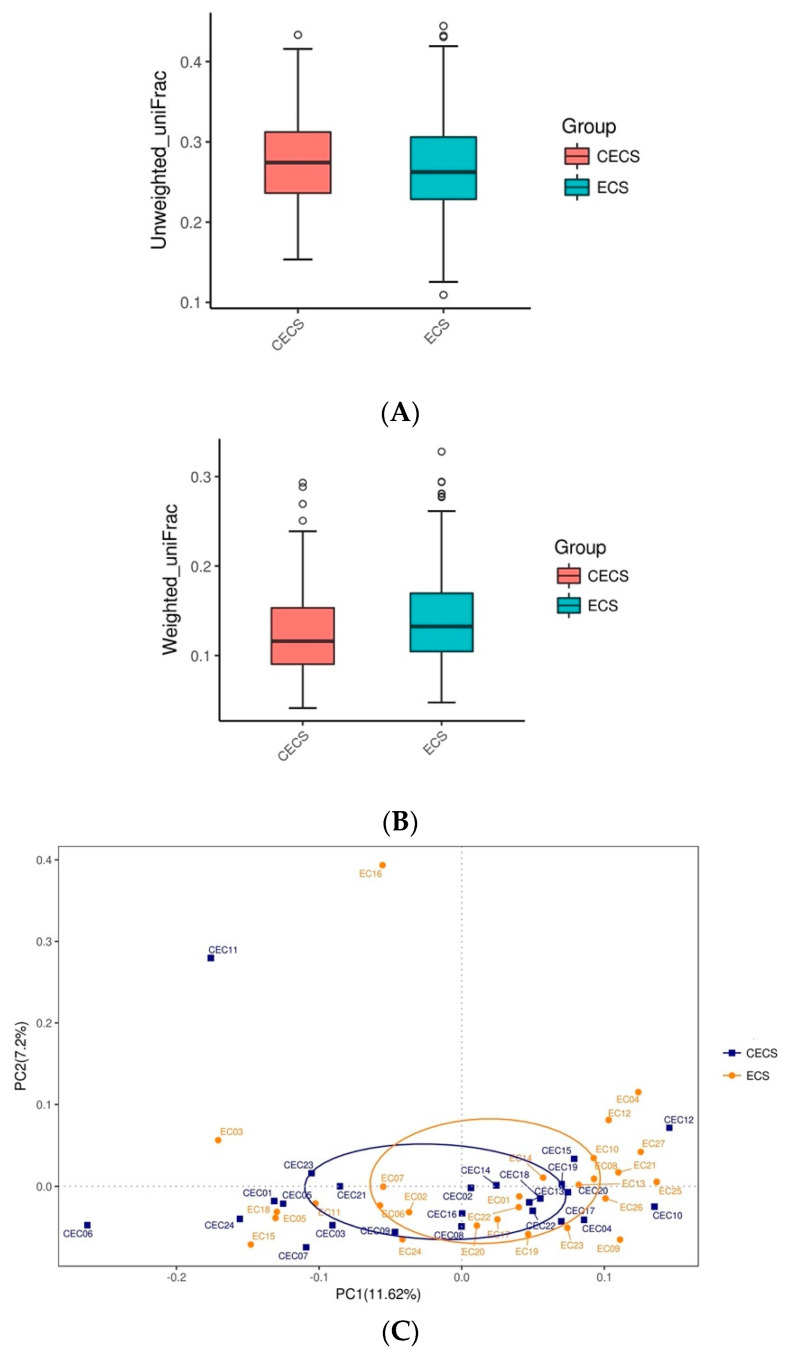
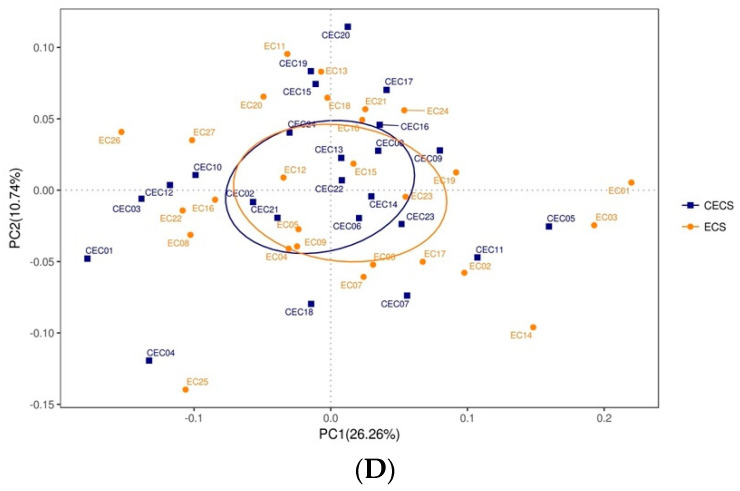
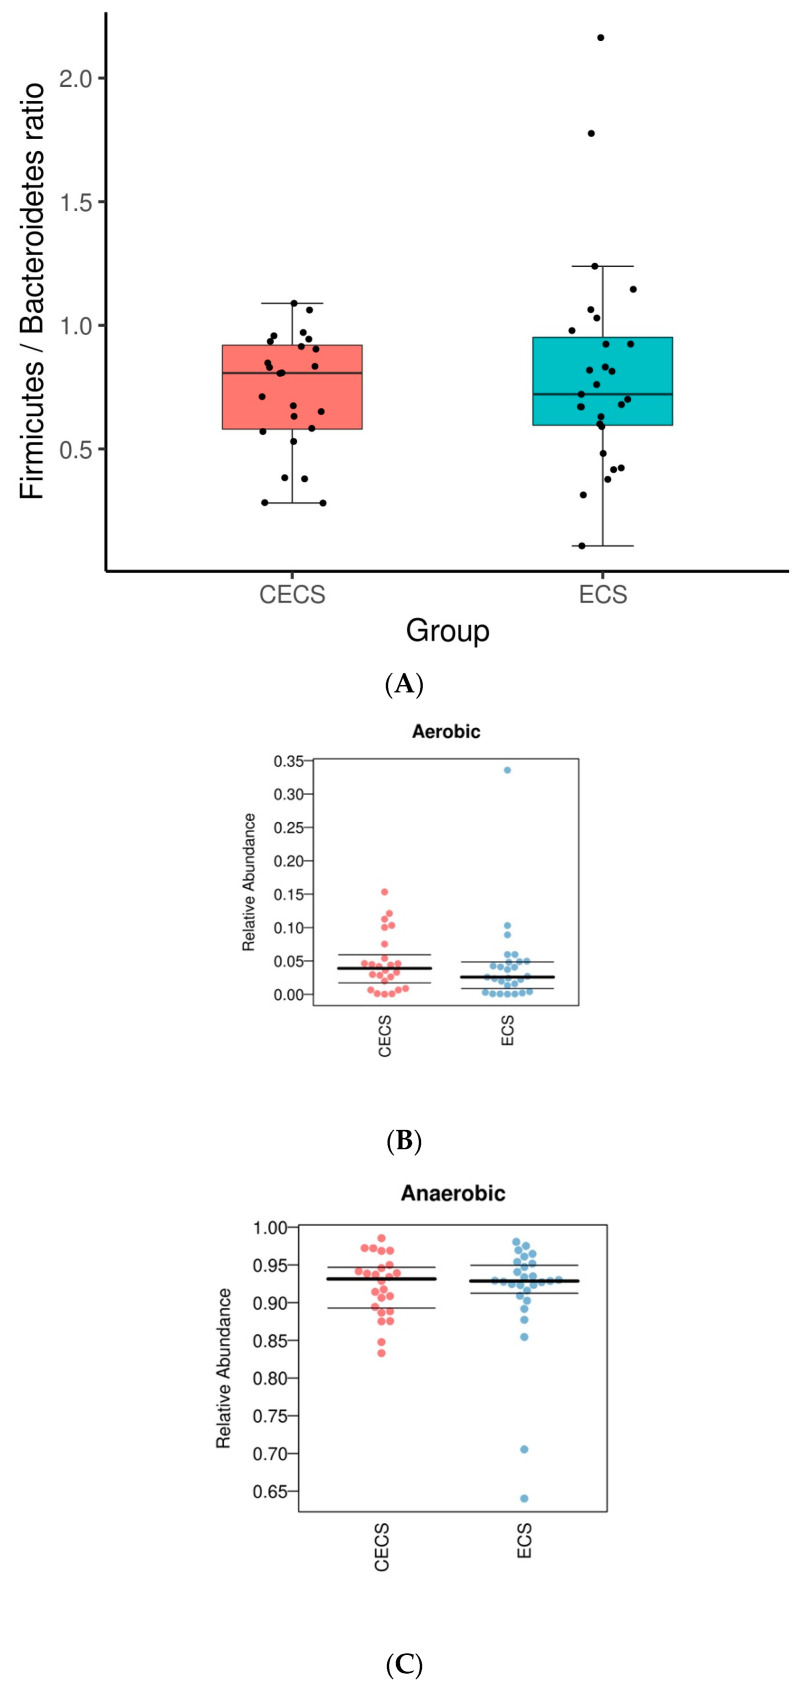
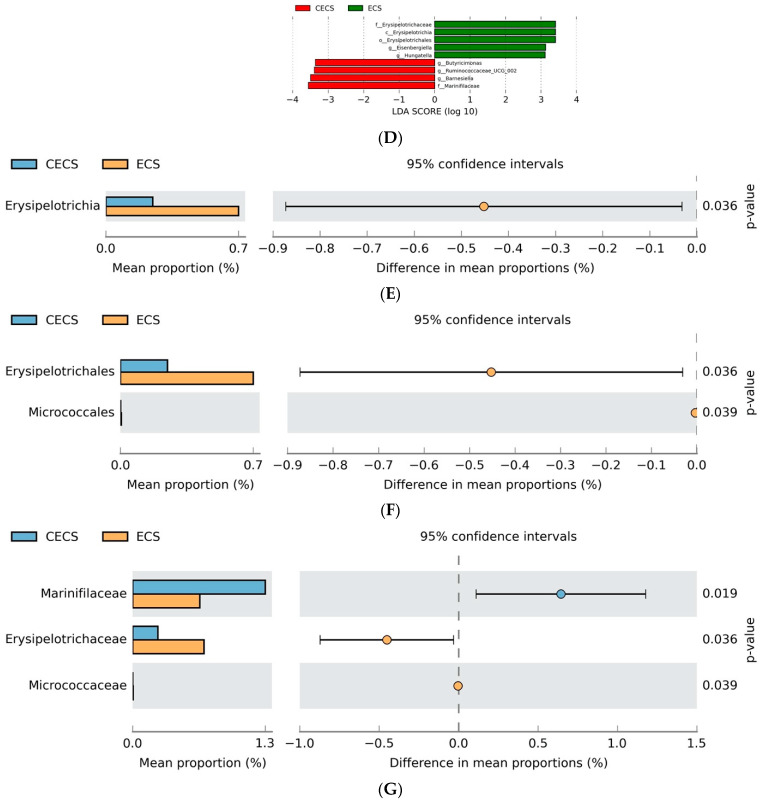
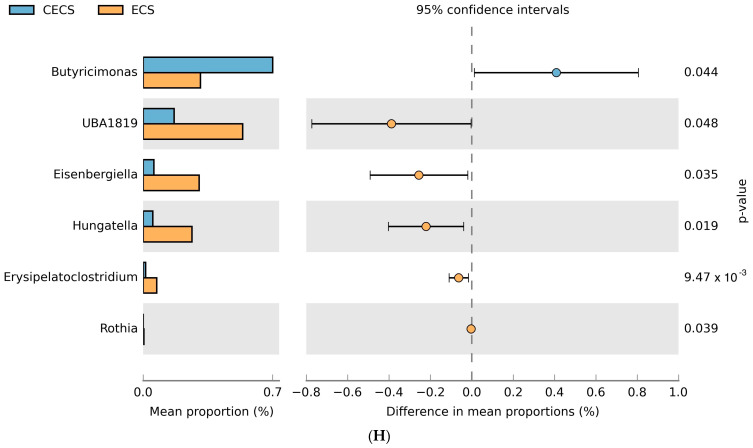
Microbiota is associated with our bodily functions and microenvironment. A healthy, balanced gut microbiome not only helps maintain mucosal integrity, prevents translocation of bacterial content, and contributes to immune status, but also associates with estrogen metabolism. Gut dysbiosis and estrobolome dysfunction have hence been linked to certain estrogen-dependent diseases, including endometriosis. While prior studies on microbiomes and endometriosis have shown conflicting results, most of the observed microbial differences are seen in the genital tract. This case-control study of reproductive-age women utilizes their fecal and urine samples for enzymatic, microbial, and metabolic studies to explore if patients with endometriosis have distinguishable gut microbiota or altered estrogen metabolism. While gut β-glucuronidase activities, microbial diversity, and abundance did not vary significantly between patients with or without endometriosis, fecal samples of patients with endometriosis were more enriched by the Erysipelotrichia class and had higher folds of four estrogen/estrogen metabolites. Further studies are needed to elucidate what these results imply and whether there indeed is an association or causation between gut microbiota and endometriosis.

Keywords: 16S ribosomal-RNA gene; dysbiosis; endometriosis; estrogen metabolites; gut microbiota; β-glucuronidase.


Conflict of interest statement

The authors declare no conflict of interest.

Figures

Figure 1
Figure 1
Enzymatic assay with results given in U/L. Boxplots: box indicate the 1st and 3rd quartiles, dash lines the upper and lower whiskers, cross indicates mean, horizontal bold lines the median, and dots signifies outliers.
Figure 2
Figure 2
A circular heat tree represents the sequence abundance of different hierarchical taxa, displayed from the center outwards. The innermost circle represents the highest taxonomic level, the bacterial domain (Bacteria). Moving outward from the center, the taxonomic levels decrease, and the number of sequences annotated to different taxonomic levels decreases accordingly. Sequence abundance is represented by node size, branch thickness, and color. Species with higher abundance are indicated by larger nodes, thicker branches, and colors closer to brown. The legend in the lower-right corner shows the sequence count along with their corresponding colors and node sizes. (A) Control and (B) Endometriosis. CECS = control, ECS = endometriosis.
Figure 3
Figure 3
Alpha diversity analysis on a single sample reflects the richness, evenness, and diversity of microbial communities within that sample. Shown in box plots, no significant differences were observed using Shannon (A) and Simpson (B) indices, which indicated that the alpha diversity of gut microbiota was similar in the endometriosis and control group. Chao analysis (C) detected similar microbial richness between the two groups. The >99% Good’s coverage index (D) demonstrated that most of the gut microbial taxa were identified. T-test was used to calculate for significant differences. CECS = control, ECS = endometriosis.
Figure 4
Figure 4
Beta diversity studies use OTU representative sequences to construct phylogenetic trees and calculate unweighted UniFrac and weighted UniFrac (when relative abundance of species within sample was considered) distances in order to evaluate differences between samples. Smaller values indicate less differences in species diversity between samples. Results are represented with box plots: (A) unweighted UniFrac and (B) weighted UniFrac. T-test was used to calculate for significant differences. Principal coordinate analysis plots (PCoA) at the OTU level based on the Bray-Curtis dissimilarity matrix demonstrated that for both unweighted (C) and weighted UniFrac distances (D), gut microbiota did not appear to cluster by presence or absence of the disease (control vs. endometriosis). Samples with similar species composition would cluster together while those with less similarities would be further apart in distance. CECS = control, ECS = endometriosis.
Figure 4
Figure 4
Beta diversity studies use OTU representative sequences to construct phylogenetic trees and calculate unweighted UniFrac and weighted UniFrac (when relative abundance of species within sample was considered) distances in order to evaluate differences between samples. Smaller values indicate less differences in species diversity between samples. Results are represented with box plots: (A) unweighted UniFrac and (B) weighted UniFrac. T-test was used to calculate for significant differences. Principal coordinate analysis plots (PCoA) at the OTU level based on the Bray-Curtis dissimilarity matrix demonstrated that for both unweighted (C) and weighted UniFrac distances (D), gut microbiota did not appear to cluster by presence or absence of the disease (control vs. endometriosis). Samples with similar species composition would cluster together while those with less similarities would be further apart in distance. CECS = control, ECS = endometriosis.
Figure 5
Figure 5
(A) F/B (Firmicutes/Bacteroidetes) ratio of the control and endometriosis group shown in box plot. BugBase application uses sequencing data for microbial phenotype prediction, which suggested a similar abundance of aerobic (B) and anaerobic (C) bacteria in both groups of patients. T-test was used to calculate for significant differences. (D) Linear discrimination analysis (LDA) coupled with effective size measurements, using 3.0 as threshold for discriminative features and p < 0.05 for statistical tests, identified the most differentially abundant taxa between the two groups. Comparison of relative abundance at the bacteria (E) class, (F) order, (G) family, and (H) genus levels between the two groups are shown. CECS = control, ECS = endometriosis.
Figure 5
Figure 5
(A) F/B (Firmicutes/Bacteroidetes) ratio of the control and endometriosis group shown in box plot. BugBase application uses sequencing data for microbial phenotype prediction, which suggested a similar abundance of aerobic (B) and anaerobic (C) bacteria in both groups of patients. T-test was used to calculate for significant differences. (D) Linear discrimination analysis (LDA) coupled with effective size measurements, using 3.0 as threshold for discriminative features and p < 0.05 for statistical tests, identified the most differentially abundant taxa between the two groups. Comparison of relative abundance at the bacteria (E) class, (F) order, (G) family, and (H) genus levels between the two groups are shown. CECS = control, ECS = endometriosis.

Similar articles

Cited by

References

    1. Jiang I., Yong P.J., Allaire C., Bedaiwy M.A. Intricate Connections between the Microbiota and Endometriosis. Int. J. Mol. Sci. 2021;22:5644. doi: 10.3390/ijms22115644. - DOI - PMC - PubMed
    1. Seksik P., Landman C. Understanding Microbiome Data: A Primer for Clinicians. Dig. Dis. 2015;33((Suppl. S1)):11–16. doi: 10.1159/000437034. - DOI - PubMed
    1. Chen K.L., Madak-Erdogan Z. Estrogen and Microbiota Crosstalk: Should We Pay Attention? Trends Endocrinol. Metab. 2016;27:752–755. doi: 10.1016/j.tem.2016.08.001. - DOI - PubMed
    1. Al Bander Z., Nitert M.D., Mousa A., Naderpoor N. The Gut Microbiota and Inflammation: An Overview. Int. J. Environ. Res. Public Health. 2020;17:7618. doi: 10.3390/ijerph17207618. - DOI - PMC - PubMed
    1. Qi X., Yun C., Pang Y., Qiao J. The impact of the gut microbiota on the reproductive and metabolic endocrine system. Gut Microbes. 2021;13:1894070. doi: 10.1080/19490976.2021.1894070. - DOI - PMC - PubMed