. 2023 Nov 15;24(22):16350.
doi: 10.3390/ijms242216350.

Characterization of the Moroccan Barley Germplasm Preserved in the Polish Genebank as a First Step towards Selecting Forms with Increased Drought Tolerance

Affiliations

Characterization of the Moroccan Barley Germplasm Preserved in the Polish Genebank as a First Step towards Selecting Forms with Increased Drought Tolerance

Maja Boczkowska et al. Int J Mol Sci. .

Abstract

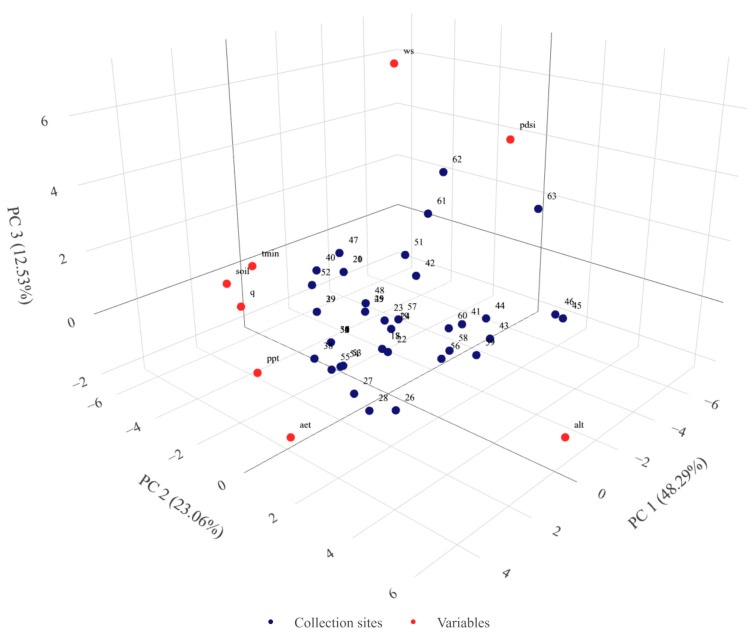
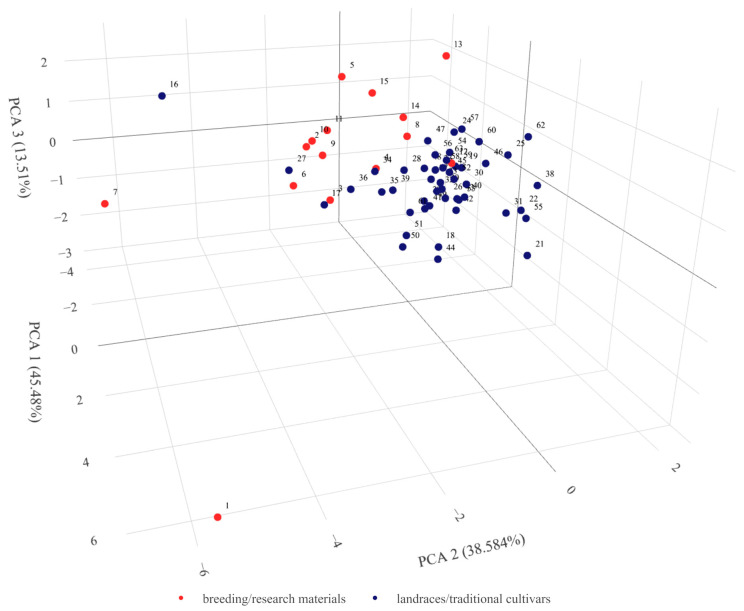
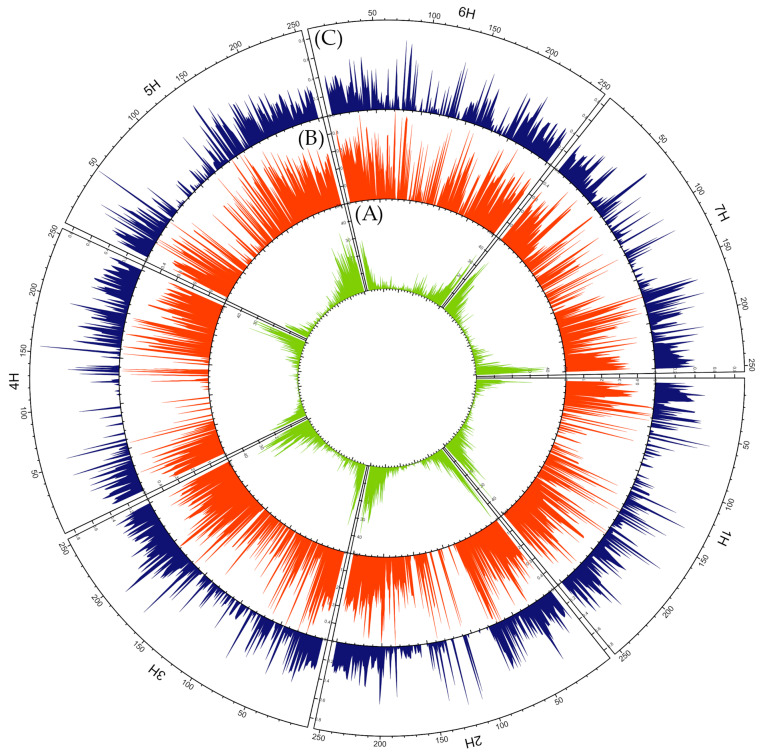
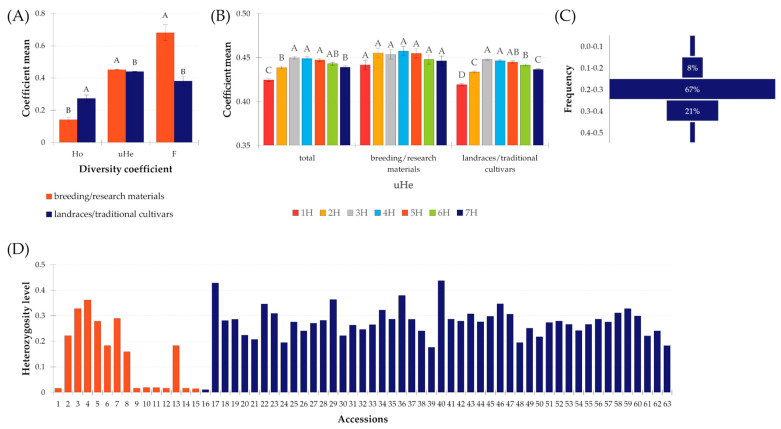
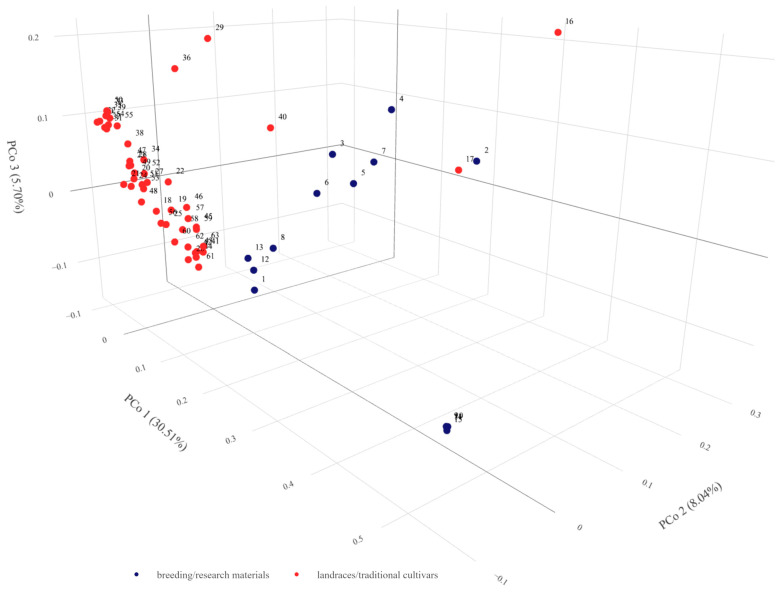
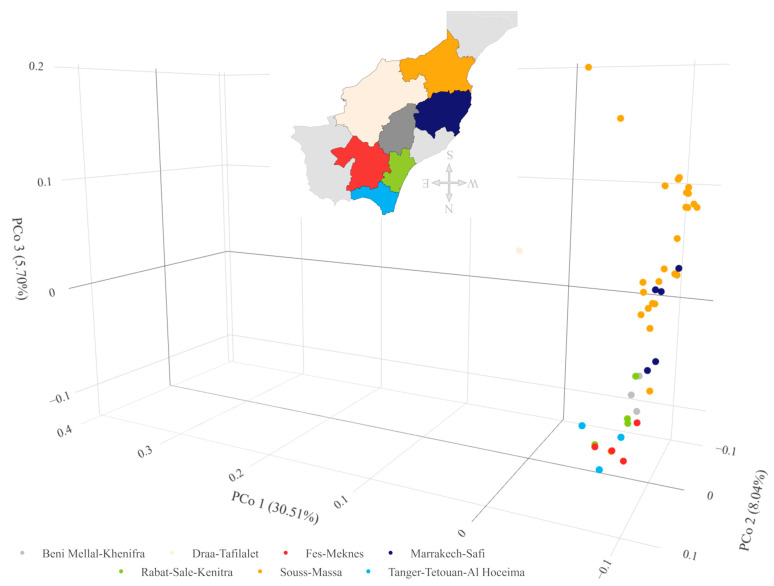
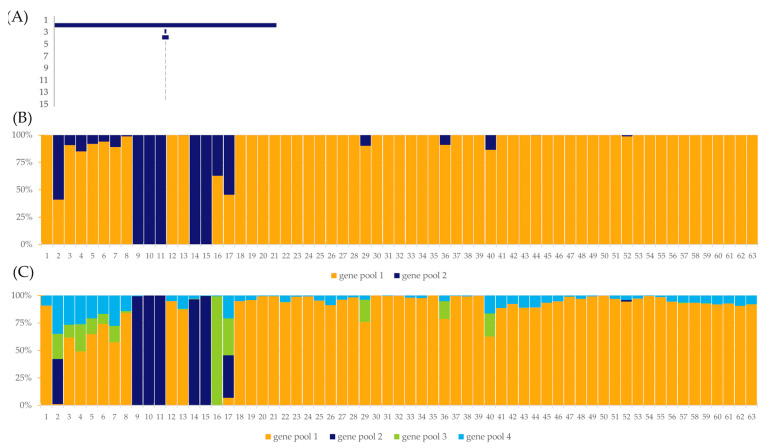
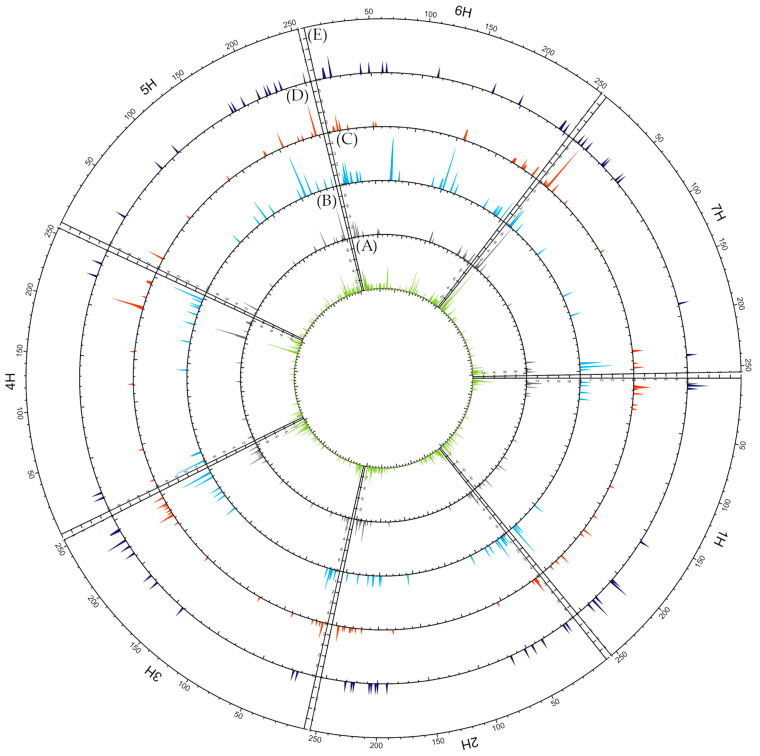
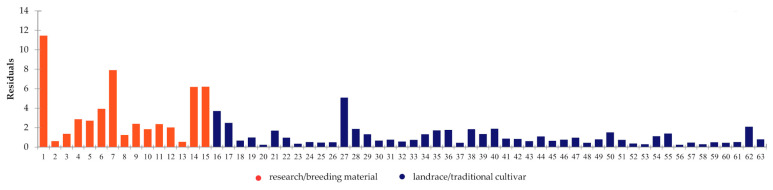
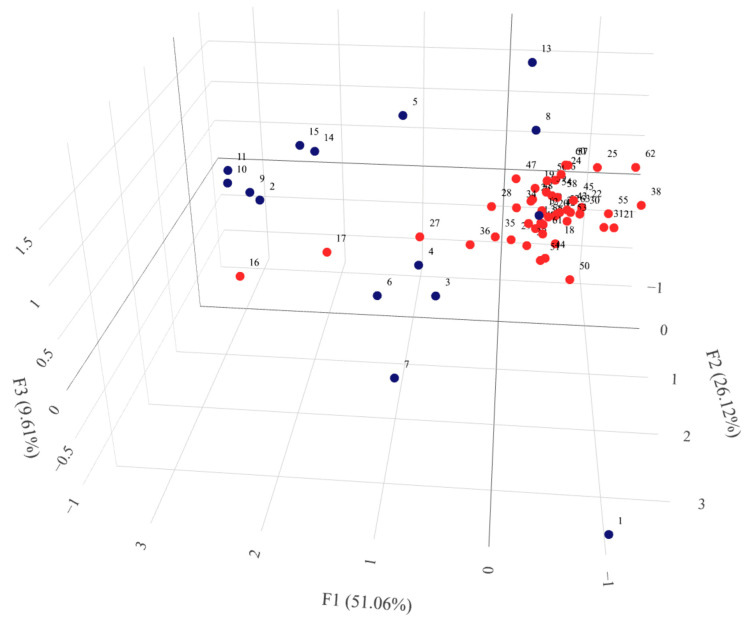
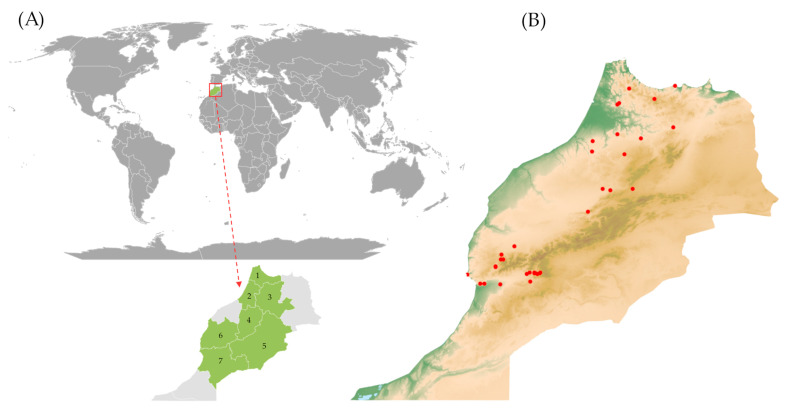
In marginal, arid, and semi-arid areas of Morocco, crops are often exposed to multiple abiotic and biotic stresses that have a major impact on yield. Farmer-maintained Moroccan landraces have been shaped by the impact of very strong selection pressures, gradually adapting to the local ecosystem and obsolete low-input agricultural practices without improvement towards high yield and quality. Considering the increasing threat of drought in Poland, it is necessary to introduce germplasm with tolerance to water deficit into barley breeding programs. The aim of this research was a DArTseq-based genetic characterization of a collection of germplasm of Moroccan origin, conserved in the Polish genebank. The results showed that all conserved landraces have a high level of heterogeneity and their gene pool is different from the material developed by Polish breeders. Based on the analysis of eco-geographical data, locations with extremely different intensities of drought stress were selected. A total of 129 SNPs unique to accessions from these locations were identified. In the neighborhood of the clusters of unique SNPs on chromosomes 5H and 6H, genes that may be associated with plant response to drought stress were identified. The results obtained may provide a roadmap for further research to support Polish barley breeding for increased drought tolerance.

Keywords: DArTseq; SNP; barley; diversity; drought tolerance; germplasm.


Conflict of interest statement

The authors declare no conflict of interest. The funders had no role in the design of the study; in the collection, analyses, or interpretation of data; in the writing of the manuscript; or in the decision to publish the results.

Figures

Figure 1
Figure 1
Graphical presentation of the principal component analysis results for eco-geographical parameters in the places of origin of the 47 Moroccan barley landraces. Results in the first three components’ system. Each point denotes one tested accession. Accession numbering according to Table S8. Rotatable 3D figure can be found in the Supplementary Materials (Figure S1).
Figure 2
Figure 2
Grain morphology of the collection of 63 Moroccan barley accessions: (A) distribution of the parameter values describing grain size; (B) distribution of the parameter values describing grain color.
Figure 3
Figure 3
Graphical presentation of the principal component analysis results for morphometric parameters of the 63 Moroccan barley accessions. Results in the first three components’ system. Each point denotes one tested accession. Accessions numbering according to Table S8. Rotatable 3D figure can be found in the Supplementary Materials (Figure S3).
Figure 4
Figure 4
Circular overview of seven H. vulgare chromosomes based on DArTseq data acquired for 63 Moroccan barley accessions. (A) DArTseq loci distribution; (B) average polymorphism information content (PIC) distribution; (C) average observed heterozygosity (Ho) distribution. A sliding window approach with 500 kb windows, printed for 250 positions along the full length of barley chromosomes based on the genome assembly: IBSC_v2 [50] was applied.
Figure 5
Figure 5
Summary of the diversity coefficient values for 63 accessions based on DArTseq data. (A) Observed heterozygosity (Ho), unbiased coefficient of variation (uHe), and fixation index (F) calculated for groups of accessions in accordance with their biological status; (B) unbiased coefficient of variation (uHe) on individual chromosomes according to biological status; (C) polymorphic information content (PIC); (D) heterogeneity level of 63 Moroccan barley accessions expressed by observed heterozygosity value based on SNPs derived from DArTseq analysis. Accessions numbering according Table S8.
Figure 6
Figure 6
Graphical presentation of the Principal Coordinate Analysis results for DArTseq data of 63 barley Moroccan accessions with indication of their biological status. Results in the first three coordinates’ system. Each point denotes one tested accession. Numbering according to Table S8. Rotatable 3D figure can be found in the Supplementary Materials (Figure S5).
Figure 7
Figure 7
Graphical presentation of the principal coordinate analysis results for DArTseq data of 47 Moroccan barley landraces with indication of their region of origin. Results in the first three coordinates’ system. Each point denotes one tested accession. Numbering according to Table S8. Rotatable 3D figure can be found in the Supplementary Materials (Figure S6).
Figure 8
Figure 8
The results of 200,000 iterations of STRUCTURE software v 2. 3. 4 [51] for 63 Moroccan barley accessions based on DArTseq-derived SNPs data with K = 15 based on ad hoc measure ∆K [52,53], where K is the number of ad hoc clusters; each vertical bar represents one accession that is marked by order number according to Table S8. The length of the colored segment shows the estimated proportion of the membership of each gene pool in the cultivar genetic makeup. (A) The results of ad hoc measure of ∆K [52] generated by CLUMPAK software [53]; (B) primary genetic structure for 63 barley accessions at K = 2; (C) secondary genetic structure for 63 barley accessions at K = 4.
Figure 9
Figure 9
Circular overview of seven H. vulgare chromosomes. (A) Total number of unique SNPs of accessions collected at sites with extreme eco-geographical parameters value; (B) number of unique SNPs of accessions collected at sites with extreme soil moisture (soil) value; (C) number of unique SNPs of accessions collected at sites with extreme Palmer drought severity index (PDSI) value; (D) number of unique SNPs of accessions collected at sites with extreme precipitation (ppt); (E) number of unique SNPs of accessions collected at sites with extreme minimum temperature (tmin).
Figure 10
Figure 10
The result obtained during the Generalized Procrustes Analysis (GPA) showing the residuals of the accession after the transformations. Accessions numbering according to Table S8.
Figure 11
Figure 11
Graphical presentation of the Generalized Procrustes Analysis of genotypic and grain morphological data of 63 Moroccan barley accessions. Results in the first three coordinates’ system. Each point denotes one tested cultivar. Numbering according to Table S8. Rotatable 3D figure can be found in the Supplementary Materials (Figure S7).
Figure 12
Figure 12
Maps. (A) The regions, where the expedition was carried out and from which the accessions surveyed had originated, were marked in maroon and numbered 1–7: 1—Tanger-Tétouan-Al Hoceïma; 2—Rabat-Salé-Kénitra; 3—Fès-Meknès; 4—Béni Mellal-Khénifra; 5—Drâa-Tafilalet; 6—Marrakech-Safi; 7—Souss-Massa, (B) relief map of Morocco with indication of barley landraces collection sites.

Similar articles

References

    1. Myers N. Threatened biotas: “Hot spots” in tropical forests. Environmentalist. 1988;8:187–208. doi: 10.1007/BF02240252. - DOI - PubMed
    1. Myers N., Mittermeier R.A., Mittermeier C.G., Da Fonseca G.A., Kent J. Biodiversity hotspots for conservation priorities. Nature. 2000;403:853–858. doi: 10.1038/35002501. - DOI - PubMed
    1. Sloan S., Jenkins C.N., Joppa L.N., Gaveau D.L., Laurance W.F. Remaining natural vegetation in the global biodiversity hotspots. Biol. Conserv. 2014;177:12–24. doi: 10.1016/j.biocon.2014.05.027. - DOI
    1. Noss R.F., Platt W.J., Sorrie B.A., Weakley A.S., Means D.B., Costanza J., Peet R.K. How global biodiversity hotspots may go unrecognized: Lessons from the North American Coastal Plain. Divers. Distrib. 2015;21:236–244. doi: 10.1111/ddi.12278. - DOI
    1. Habel J.C., Rasche L., Schneider U.A., Engler J.O., Schmid E., Rödder D., Meyer S.T., Trapp N., Sos del Diego R., Eggermont H. Final countdown for biodiversity hotspots. Conserv. Lett. 2019;12:e12668. doi: 10.1111/conl.12668. - DOI

LinkOut - more resources