. 2023 Nov 15;24(22):16370.
doi: 10.3390/ijms242216370.

Transcriptome Profiling Provides Insights into the Early Development of Tiller Buds in High- and Low-Tillering Orchardgrass Genotypes

Affiliations

Transcriptome Profiling Provides Insights into the Early Development of Tiller Buds in High- and Low-Tillering Orchardgrass Genotypes

Guangyan Feng et al. Int J Mol Sci. .

Abstract

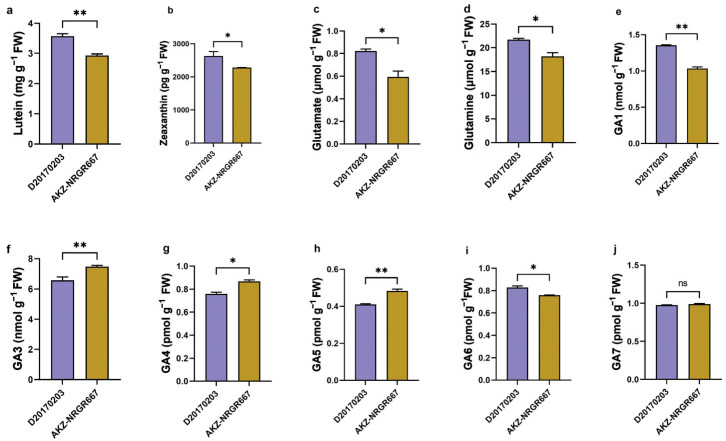
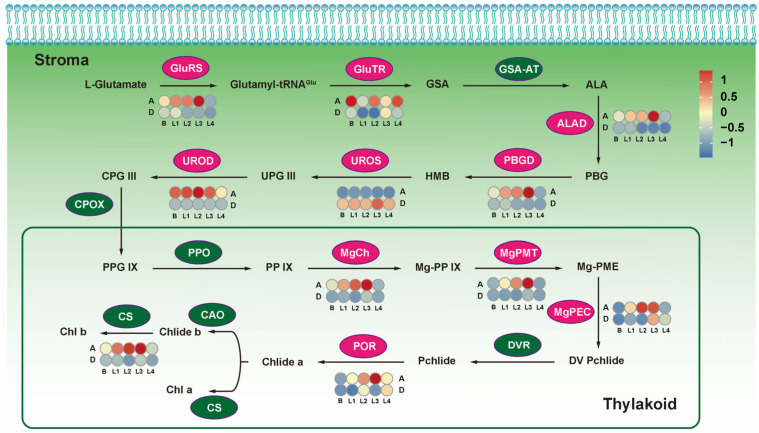
Orchardgrass (Dactylis glomerata L.) is among the most economically important perennial cool-season grasses, and is considered an excellent hay, pasture, and silage crop in temperate regions worldwide. Tillering is a vital feature that dominates orchardgrass regeneration and biomass yield. However, transcriptional dynamics underlying early-stage bud development in high- and low-tillering orchardgrass genotypes are unclear. Thus, this study assessed the photosynthetic parameters, the partially essential intermediate biomolecular substances, and the transcriptome to elaborate the early-stage profiles of tiller development. Photosynthetic efficiency and morphological development significantly differed between high- (AKZ-NRGR667) and low-tillering genotypes (D20170203) at the early stage after tiller formation. The 206.41 Gb of high-quality reads revealed stage-specific differentially expressed genes (DEGs), demonstrating that signal transduction and energy-related metabolism pathways, especially photosynthetic-related processes, influence tiller induction and development. Moreover, weighted correlation network analysis (WGCNA) and functional enrichment identified distinctively co-expressed gene clusters and four main regulatory pathways, including chlorophyll, lutein, nitrogen, and gibberellic acid (GA) metabolism pathways. Therefore, photosynthesis, carbohydrate synthesis, nitrogen efficient utilization, and phytohormone signaling pathways are closely and intrinsically linked at the transcriptional level. These findings enhance our understanding of tillering in orchardgrass and perennial grasses, providing a new breeding strategy for improving forage biomass yield.

Keywords: orchardgrass; perennial forage; photosynthesis; tillering regulation; transcriptome profiling.


Conflict of interest statement

The authors declare no conflict of interest.

Figures

Figure 1
Figure 1
Photosynthetic parameters and chlorophyll content. (a) Stomatal conductance (Gs, mmol); (b) Net photosynthetic rate (Pn, μmol CO2 m−2 s−1); (c) Transpiration rate (Tr, mmol H2O m−2 s−1); (d) Water use efficiency (WUE, μmol CO2 mmol H2O−1); (e) Photochemical efficiency (Fv/Fm); (f) PIABS; (g) Chlorophyll content (Chl, mg g−1 FW); (h) Chlorophyll a/b ratio. “ns” indicates no significant difference, and “**” indicates the statistical significance at p-value < 0.01.
Figure 2
Figure 2
The concentrations of lutein, zeaxanthin, glutamate, glutamine, and gibberellic acid (GA) in the high- and low-tillering orchardgrass. (a) Lutein content (mg g−1 FW); (b) zeaxanthin content (mg g−1 FW); (c) glutamate content (μmol g−1 FW); (d) glutamine content (μmol g−1 FW); (e) GA1 content (nmol g−1 FW); (f) GA3 content (nmol g−1 FW); (g) GA4 content (pmol g−1 FW); (h) GA5 content (pmol g−1 FW); (i) GA6 content (pmol g−1 FW); (j) GA7 content (pmol g−1 FW). “ns” indicates no significant difference, “*” indicates the statistical significance at p-value < 0.05, and “**” indicates the statistical significance at p-value < 0.01.
Figure 3
Figure 3
Transcriptional relationships between samples. (a) Gene expression per sample; (b) FPKM (fragments per kilobase of transcript per million mapped reads) density per sample; (c) Pearson correlation between samples; (d) principal component analysis of expressed genes per sample (showing ten distinct clusters). HB, bud stage of the high-tillering orchardgrass (AKZ-NRGR667); LB, bud stage of the low-tillering orchardgrass (D20170203); L1, one-leaf stage; L2, two-leaves stage; L3, three-leaves, and L4, four-leaves stage.
Figure 4
Figure 4
Differentially expressed genes (DEGs) between samples. (a) The number of up- and down-regulated genes in eight pairwise sampling stages, including A_L1 vs. A_HB, A_L2 vs. A_L1, A_L3 vs. A_L2, A_L4 vs. A_L3, D_L1 vs. D_LB, D_L2 vs. D_L1, D_L3 vs. D_L2, and D_L4 vs. D_L3; (b) the heatmap showing the DEGs from each ‘AKZ-NRGR667′ sample group based on the average FPKM (fragments per kilobase of transcript per million mapped reads) of biological replicates; (c) the heatmap showing the DEGs from each ‘D20170203′ sample group based on the average FPKM of biological replicates.
Figure 5
Figure 5
A weighted correlation network analysis (WGCNA) of genes. (a) A hierarchical cluster tree showing the co-expression modules identified via WGCNA. Each leaf in the tree represents one gene. Major tree branches constitute 18 modules labeled by different colors. (b) The relationship between modules and samples. The heatmap shows the correlation between different modules. The deeper the red color, the higher the correlation. The colors on the left indicate the clusters in AKZ-NRGR667 after the correlation analysis between samples and modules. The connecting lines indicate module correlation between AKZ-NRGR667 and D20170203 samples. (ch) are the expression patterns of eigengene in six modules, including pink, magenta, tan, blue, green, and turquoise, respectively. The sample labels are the same as above.
Figure 6
Figure 6
Chlorophyll metabolism in AKZ-NRGR667 and D20170203. The ellipses denote enzymes in different chlorophyll synthesis steps. Light magenta indicates that the genes were differentially expressed between the two genotypes in at least one stage, and green indicates no significant difference. Blue to red indicates the expression of genes that encode enzymes catalyzing corresponding biochemical reactions in different tissues. Sample labels are the same as mentioned above. ALA, 5-aminolevulinic acid; ALAD, ALA dehydratase; CAO, chlide a oxygenase; Chl a, chlorophyll a; Chl b, chlorophyll b; Chlide a, chlorophyllide a; Chlide b, chlorophyllide b; CPG III, Coproporphyrinogen III; CPOX, coproporphyrinogen III oxidase; CS, chlorophyll synthase; DV Pchlide, divinyl protochlorophyllide a; DVR, 3,8-divinyl protochlorophyllide an 8-vinyl reductase; GluRS, glutamate-tRNA ligase; GluTR, glutamyl-tRNA reductase; GSA, glutamate 1-semialdehyde; GSA-AT, glutamate-1-semialdehyde 2,1-aminomutase; HMB, hydroxymethylbilane; MgCh, magnesium chelatase subunit H; MgPEC, magnesium-protoporphyrin IX monomethyl ester cyclase; Mg-PME, magnesium protoporphyrin monomethyl ester; MgPMT, magnesium protoporphyrin IX methyltransferase; Mg-PP IX, magnesium protoporphyrin IX; PBG, porphobilinogen; PBGD, porphobilinogen deaminase; Pchlide, protochlorophyllide; PP IX, protoporphyrin IX; PPG IX, protoporphyrinogen IX; PPO, protoporphyrinogen oxidase; POR, protochlorophyllide reductase; UPG III, uroporphyrinogen III; UROD, uroporphyrinogen III decarboxylase; UROS, uroporphyrinogen-III synthase.
Figure 7
Figure 7
Lutein metabolism in high- and low-tillering orchardgrass. The ellipses denote enzymes in different steps of lutein metabolism. Light magenta indicates the differential expressed enzyme-encoding genes between the two genotypes in at least one stage. Green indicates no significant difference between the enzyme-encoding genes. Blue to red represents genes that encode enzymes catalyzing corresponding biochemical reactions in different tissues. Sample labels are the same as mentioned above. CHYB: beta-carotene hydroxylase; CYP97A, cytochrome P450-type monooxygenase 97A; CYP97C, cytochrome P450-type monooxygenase 97C; GGPP, geranylgeranyl diphosphate; LCYB, lycopene beta-cyclase; LCYE, lycopene epsilon-cyclase; PDS, 15-cis-phytoene desaturase; PSY, 15-cis-phytoene synthase; ZDS, ζ-carotene desaturase.
Figure 8
Figure 8
Nitrogen and gibberellic acid (GA) metabolism in high- and low-tillering orchardgrass. The ellipses denote enzymes at different steps of nitrogen and GA metabolism. Light magenta indicates differentially expressed enzyme-encoding genes between AKZ-NRGR667 and D20170203 in at least one stage. Grayish green indicates no significant difference in enzyme-encoding genes. Deep green denotes proteins related to nitrogen and the GA pathway. Sample labels are the same as mentioned above. Lines with arrows indicate positive regulation, and those with blunt ends indicate negative regulation. CPS, ent-copalyl diphosphate synthase; ent-CDP, ent-copalyl diphosphate; GA2ox, gibberellin 2beta-dioxygenase; GA20ox, gibberellin 20 oxidase; GGPP, geranylgeranyl pyrophosphate; GID, gibberellin insensitive dwarf; GOGAT, glutamate synthase; GRF4, growth-regulating factor 4; GS, glutamine synthetase; KAO, ent-kaurene oxidase; KS, ent-kaurene synthase; NGR5, nitrogen-mediated tiller growth response 5; NiR, ferredoxin-nitrite reductase; NIT, nitrilase; NR, nitrate reductase; NRT, nitrate/nitrite transporter.
Figure 9
Figure 9
Schematic representation of the pathways involved in the early stage of tiller formation in orchardgrass. Chlorophyll, lutein, nitrogen, and gibberellic acid (GA) metabolism-induced energy conversion, carbon/nitrogen assimilation, morphological development, cell division/growth, and shoot elongation in the early tillering stage. Sample labels are the same as mentioned above.

Similar articles

Cited by

References

    1. Feng G., Xu L., Wang J., Nie G., Bushman B.S., Xie W., Yan H., Yang Z., Guan H., Huang L., et al. Integration of small RNAs and transcriptome sequencing uncovers a complex regulatory network during vernalization and heading stages of orchardgrass (Dactylis glomerata L.) BMC Genom. 2018;19:727. doi: 10.1186/s12864-018-5104-0. - DOI - PMC - PubMed
    1. Xie K., Cakmak I., Wang S., Zhang F., Guo S. Synergistic and antagonistic interactions between potassium and magnesium in higher plants. Crop J. 2021;9:249–256. doi: 10.1016/j.cj.2020.10.005. - DOI
    1. Rotili D.H., Sadras V.O., Abeledo L.G., Ferreyra J.M., Micheloud J.R., Duarte G., Girón P., Ermácora M., Maddonni G.A. Impacts of vegetative and reproductive plasticity associated with tillering in maize crops in low-yielding environments: A physiological framework. Field Crops Res. 2021;265:108107. doi: 10.1016/j.fcr.2021.108107. - DOI
    1. He R., Ni Y., Li J., Jiao Z., Zhu X., Jiang Y., Li Q., Niu J. Quantitative changes in the transcription of phytohormone-related genes: Some transcription factors are major causes of the wheat mutant dmc not tillering. Int. J. Mol. Sci. 2018;19:1324. doi: 10.3390/ijms19051324. - DOI - PMC - PubMed
    1. Zhang Y., Wang Z., Li L., Zhou Q., Xiao Y., Wei X., Zhou M. Short-term complete submergence of rice at the tillering stage increases yield. PLoS ONE. 2015;10:e0127982. doi: 10.1371/journal.pone.0127982. - DOI - PMC - PubMed

LinkOut - more resources