. 2023 Nov 15;24(22):16380.
doi: 10.3390/ijms242216380.

ZNF643/ZFP69B Exerts Oncogenic Properties and Associates with Cell Adhesion and Immune Processes

Affiliations

ZNF643/ZFP69B Exerts Oncogenic Properties and Associates with Cell Adhesion and Immune Processes

Urszula Oleksiewicz et al. Int J Mol Sci. .

Abstract

The global cancer burden remains high; thus, a better understanding of the molecular mechanisms driving carcinogenesis is needed to improve current prevention and treatment options. We previously detected the ZNF643/ZFP69B gene upregulated in multiple tumors, and we speculated it may play a role in tumor biology. To test this hypothesis, we employed TCGA-centered databases to correlate ZNF643 status with various clinicopathological parameters. We also performed RNA-seq analysis and in vitro studies assessing cancer cell phenotypes, and we searched for ZNF643-bound genomic loci. Our data indicated higher levels of ZNF643 in most analyzed tumors compared to normal samples, possibly due to copy number variations. ZNF643 mRNA correlated with diverse molecular and immune subtypes and clinicopathological features (tumor stage, grade, patient survival). RNA-seq analysis revealed that ZNF643 silencing triggers the deregulation of the genes implicated in various cancer-related processes, such as growth, adhesion, and immune system. Moreover, we observed that ZNF643 positively influences cell cycle, migration, and invasion. Finally, our ChIP-seq analysis indicated that the genes associated with ZNF643 binding are linked to adhesion and immune signaling. In conclusion, our data confirm the oncogenic properties of ZNF643 and pinpoint its impact on cell adhesion and immune processes.

Keywords: ChIP-seq; KRAB-ZFP; TCGA datasets; ZFP69B; ZNF643; oncogenes; transcriptomic profiling.


Conflict of interest statement

The authors declare no conflict of interest.

Figures
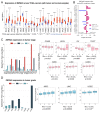
Figure 1
Figure 1
ZNF643 status in TCGA samples. (A) ZNF643 expression in normal (blue) and tumor (red) samples among distinct TCGA cohorts assessed with the UALCAN database. Statistical significance was calculated based on the student t-test. (B) Association between ZNF643 gene expression and p53 mutation status. Spearman’s correlation between ZNF643 gene expression and (C) tumor stage and (D) tumor grade. The data was downloaded from TISIDB database. The graphs on the left-hand side represent the p-values (transformed into –log10 p-values) as assessed with Spearman correlation test (NS: non-significant). Higher ZNF643 expression was observed in the tumors with lower (red) or higher (dark blue) (C) or grade (D). The tumors presenting statistically significant correlations are additionally shown on the barplots on the right. The scale from 1 to 4 on the X axis (C,D) denotes, respectively: the lowest and highest stage and grade. Adrenocortical carcinoma (ACC); bladder urothelial carcinoma (BLCA); breast invasive carcinoma (BRCA); cervical squamous cell carcinoma and endocervical adenocarcinoma (CESC); cholangiocarcinoma (CHOL); colon adenocarcinoma (COAD); lymphoid neoplasm diffuse large B-cell lymphoma (DLBC); esophageal carcinoma (ESCA); glioblastoma multiforme (GBM); head and neck squamous cell carcinoma (HNSC); kidney chromophobe (KICH); kidney renal clear cell carcinoma (KIRC); kidney renal papillary cell carcinoma (KIRP); brain lower grade glioma (LGG); liver hepatocellular carcinoma (LIHC); lung adenocarcinoma (LUAD); lung squamous cell carcinoma (LUSC); mesothelioma (MESO); ovarian serous cystadenocarcinoma (OV); pancreatic adenocarcinoma (PAAD); prostate adenocarcinoma (PRAD); pheochromocytoma and paraganglioma (PCPG); rectum adenocarcinoma (READ); sarcoma (SARC); skin cutaneous melanoma (SKCM); stomach adenocarcinoma (STAD); testicular germ cell tumors (TGCT); thyroid carcinoma (THCA); thymoma (THYM); uterine corpus endometrial carcinoma (UCEC); uterine carcinosarcoma (UCS); uveal melanoma (UVM).
Figure 2
Figure 2
ZNF643 expression and patient prognosis. (A,B) In several analyzed tumors, high and low-risk groups of patients present differences in ZNF643 median expression as assessed with the log-rank tests of overall survival (A) and disease-free survival (B). Presented graphs with the Kaplan–Meier curves contain information about the numbers of patients in high (red) and low (blue) ZNF643 expression groups, calculated hazard ratios (HR), and p-values. Dotted lines represent 95% Confidence Interval range.
Figure 3
Figure 3
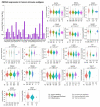
ZNF643 association with tumor immune subtypes. Distinct immune subtypes (C1–C6) of analyzed TCGA tumors represent differences (Kruskal–Wallis test) in ZNF643 gene expression. Transformed p-values (−log10) are present on a barplot. Violin plots represent tumors with statistically significant expression differences, showing p-value calculated with the Kruskal–Wallis test. The number of samples within different immune subtypes is displayed below plots.
Figure 4
Figure 4
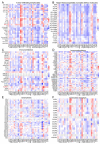
ZNF643 correlation with tumor immunology. (AF) The heatmaps displaying the Spearman’s correlation rho values between the expression level of ZNF643 and the expression of the genes specific for tumor-infiltrating lymphocytes (A), MHC molecules (B), immunoinhibitors (C), immunostimulators (D), chemokines (E), and chemokine receptors (F). Blue boxes and fonts represent negative correlation, while red—positive correlation.
Figure 5
Figure 5
Mutations and structural variations of ZNF643 across TCGA samples. (A,B) Different tumor types present distinct mutational statuses of ZNF643, as evidenced by cbioportal (A) and GSCA (B) algorithms. For the cbioportal analysis (A), we selected the “cancer study” mode with a minimum of 100 samples within each analyzed cohort. Light green lollipops represent missense mutations of unknown significance, and their heights correspond to the total number of patients with a given mutation. Green boxes mark zinc finger double domains (zf-H2C2_2). Green dots represent ZNF643 phosphorylation sites (threonines: 36, 330, and 358), whereas purple dots denote sumoylation sites (lysines: 37, 40, 178, 235). (C) ZNF643 gene expression is associated with CNV status as assessed with Spearman correlation analysis. (D) Graphical representation of point mutations located within the ZNF643 gene. Abbreviations: pheochromocytoma (PCC), non-small cell lung cancer (NSCLC), colorectal cancer (CRC), glioma (GBMLGG), thyroid epithelial tumor (TET), hepatobiliary cancer (HBC).
Figure 6
Figure 6
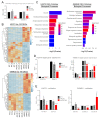
Transcriptomic profile of lung cancer cell lines with decreased expression of ZNF643. (A) ZNF643 gene expression level after shRNA-mediated knock-down in H2073 and SKMES cell lines evaluated with qPCR assay relative to ESD internal control. (B) Heatmaps representing Z-score normalized TPM (transcript per kilobase per million mapped reads) values and supervised clustering of top 100 (sorted by p-value) differentially expressed genes (DEGs) identified between control cells (WT and shLUC) and shZNF643 cells for H2073 (top) and SKMES (bottom). Presented genes met the criteria of cutoff threshold fc ≥ 2 or ≤−2 and p < 0.05. (C) Barplots depicting enriched biological processes (BP1) connected with identified DEGs for H2073 (left) and SKMES (right). The color scale represents the number of DEGs involved in each process. (D) RNA-seq TPM values of normalized expression for selected ZNF643 target genes. (E) RT-qPCR analysis of selected target gene expression. The experiment was performed in biological and technical triplicates. p-value symbols: * vs. WT; ^ vs. shLUC; */^ p < 0.05; ^^ p < 0.01; ***/^^^ p < 0.001, ****/^^^^ p < 0.0001.
Figure 7
Figure 7
The expression level of ZNF643 is modestly associated with the proliferative potential of cancer cells. (A) Western blot analysis assessed the ectopic overexpression of HA-tagged ZNF643 in SKMES lung cancer cell line compared to GAPDH internal control. (B) Confocal microscopy confirmed nuclear localization of HA-tagged ZNF643 (green) in SKMES cell line. Actin filament (red) and cell nuclei (blue) are also visualized. The pictures were taken with FV1000 Olympus scanning confocal microscope, 60×. The scale bar represents 10 μm. Cell proliferation of lung cancer cell lines with decreased (shZNF643) and increased (ZNF643-OE) expression of ZNF643 was measured with the real-time proliferation assay on IncuCyte instrument (CE) and with MTT colorimetric test (F). The analysis of the cell cycle was performed by flow cytometry (G,H). The bar graphs represent statistics for at least three biological replicates. Statistical significance was calculated with an unpaired t-test. p-value symbols: * vs. WT; ^ vs. shLUC; * p < 0.05; **/^^ p < 0.01.
Figure 8
Figure 8
ZNF643 affects the migration and invasiveness of lung cancer cells. A real-time wound healing assay was performed to assess migration (upper panel) and invasion (lower panel) levels in SKMES shZNF643 (A), and SKMES ZNF643-OE (B). The points represent statistics for at least three biological replicates. Statistical significance was calculated with a two-way ANOVA test corrected with Dunnett’s multiple comparison test. p-value symbols: * vs. WT; ^ vs. shLUC; */^ p < 0.05; **/^^ p < 0.01; ^^^; p < 0.001, ****/^^^^ p < 0.0001.
Figure 9
Figure 9
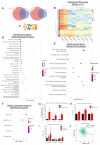
ChIP-seq analysis of genomic regions bound by ZNF643. (A) ChIP seq analysis determined the number of SKMES WT and ZNF643-OE differential peaks within two analyzed replicates. (B) Heatmap of RPM values in the peaks obtained from ChIP (ch) and input (in) samples of SKMES WT and ZNF643-OE cell variants. The heatmap demonstrates the enrichment pattern of the peaks among other peaks across various samples and in comparison to input. (C) A significant short motif sequence detected in the peaks from both replicates. (DF) Bubble plots representing enriched Biological Processes (BP ALL) (D), KEGG pathways (E), and Cellular Components (CC1) (F) connected to the genes associated with ZNF643 binding sites. X-axis—fold enrichment; color scale—p-value; bubble size—the number of genes involved in each process. (G) ChIP-qPCR validation assays for selected target genes associated with ZNF643 binding loci in the SKMES cell line. RT-qPCR assessed the expression level of selected ZNF643 target genes in (H) ZNF643-OE and (I) shZNF643 cells. The experiment was performed in biological and technical triplicates. Statistical significance was calculated with an unpaired t-test. */^ p ≤ 0.05; **/^^ p ≤ 0.01; * vs. WT, ^ vs. shLUC; (J) Spearman correlation test between TNFSF9 and ZNF643 expression in LUSC samples downloaded from TISIDB database.

Similar articles

Cited by

References

    1. Sung H., Ferlay J., Siegel R.L., Laversanne M., Soerjomataram I., Jemal A., Bray F. Global Cancer Statistics 2020: GLOBOCAN Estimates of Incidence and Mortality Worldwide for 36 Cancers in 185 Countries. CA Cancer J. Clin. 2021;71:209–249. doi: 10.3322/caac.21660. - DOI - PubMed
    1. Hanahan D. Hallmarks of Cancer: New Dimensions. Cancer Discov. 2022;12:31–46. doi: 10.1158/2159-8290.CD-21-1059. - DOI - PubMed
    1. Llinas-Arias P., Esteller M. Epigenetic inactivation of tumour suppressor coding and non-coding genes in human cancer: An update. Open Biol. 2017;7:170152. doi: 10.1098/rsob.170152. - DOI - PMC - PubMed
    1. Sobocińska J., Molenda S., Machnik M., Oleksiewicz U. KRAB-ZFP Transcriptional Regulators Acting as Oncogenes and Tumor Suppressors: An Overview. Int. J. Mol. Sci. 2021;22:2212. doi: 10.3390/ijms22042212. - DOI - PMC - PubMed
    1. Sun M., Ju J., Ding Y., Zhao C., Tian C. The signaling pathways regulated by KRAB zinc-finger proteins in cancer. Biochim. Biophys. Acta BBA Rev. Cancer. 2022;1877:188731. doi: 10.1016/j.bbcan.2022.188731. - DOI - PubMed