

Integration of Metabolomics and Transcriptomics to Explore Dynamic Alterations in Fruit Color and Quality in 'Comte de Paris' Pineapples during Ripening Processes
- PMID: 38003574
- PMCID: PMC10671212
- DOI: 10.3390/ijms242216384
Integration of Metabolomics and Transcriptomics to Explore Dynamic Alterations in Fruit Color and Quality in 'Comte de Paris' Pineapples during Ripening Processes
Abstract
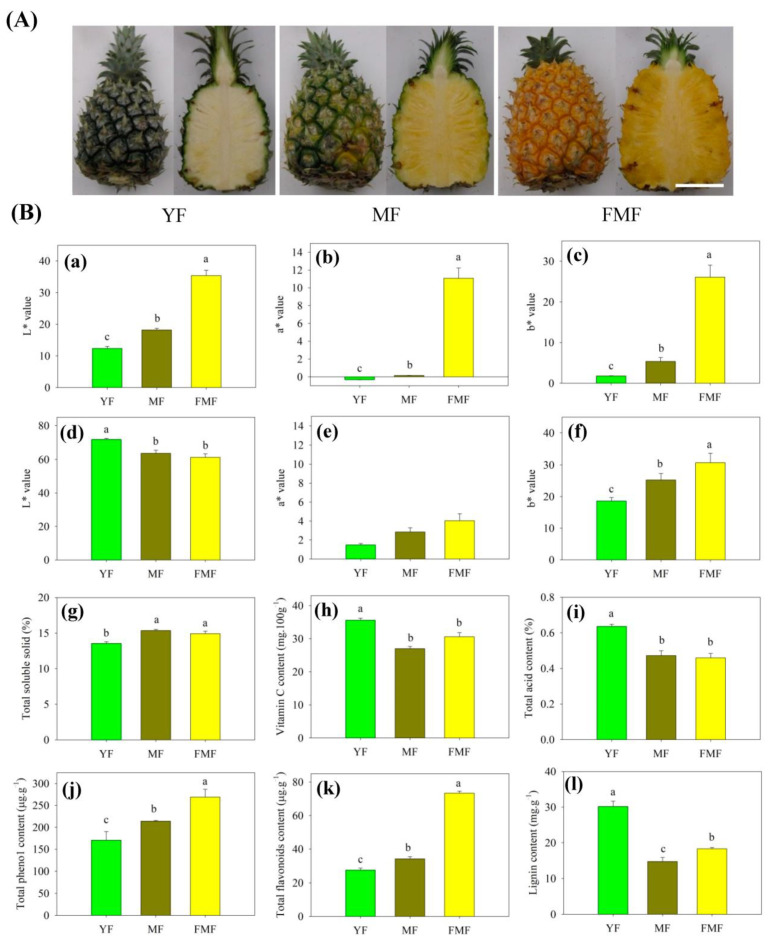
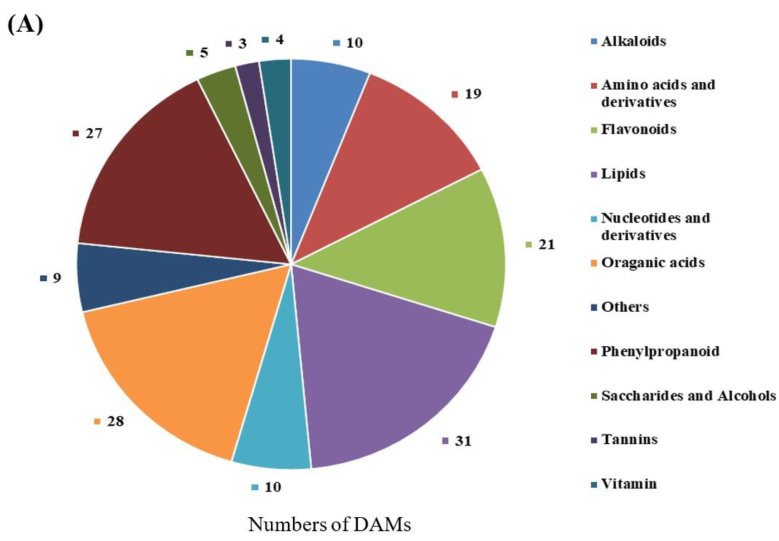
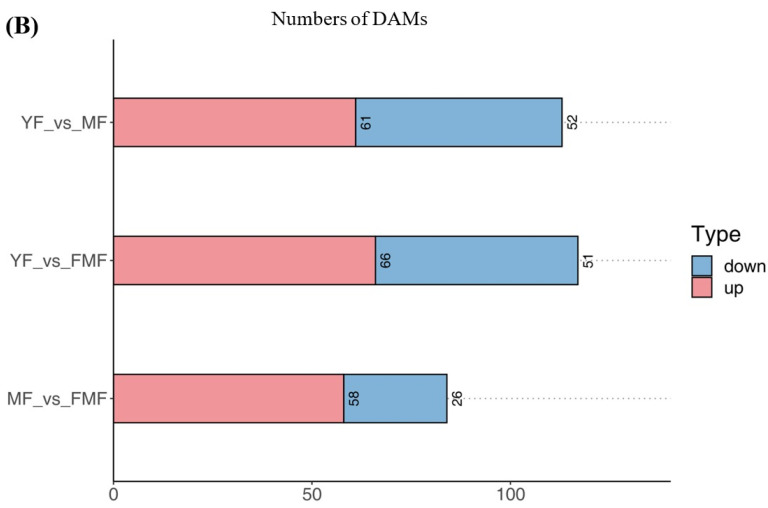
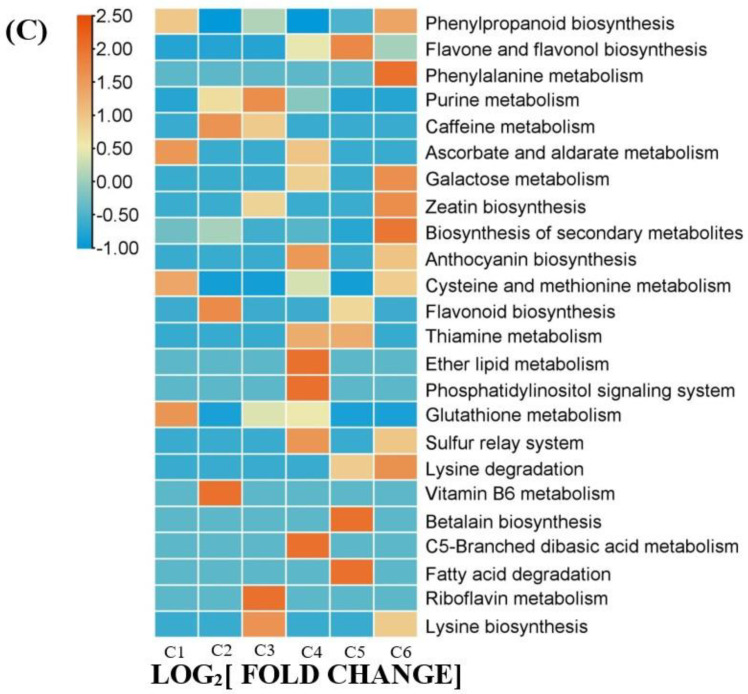
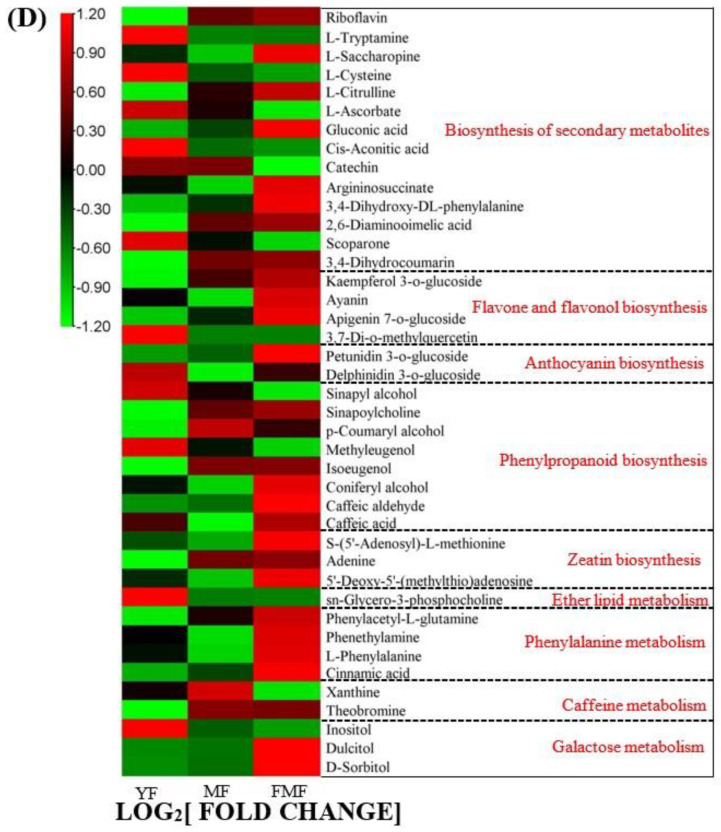
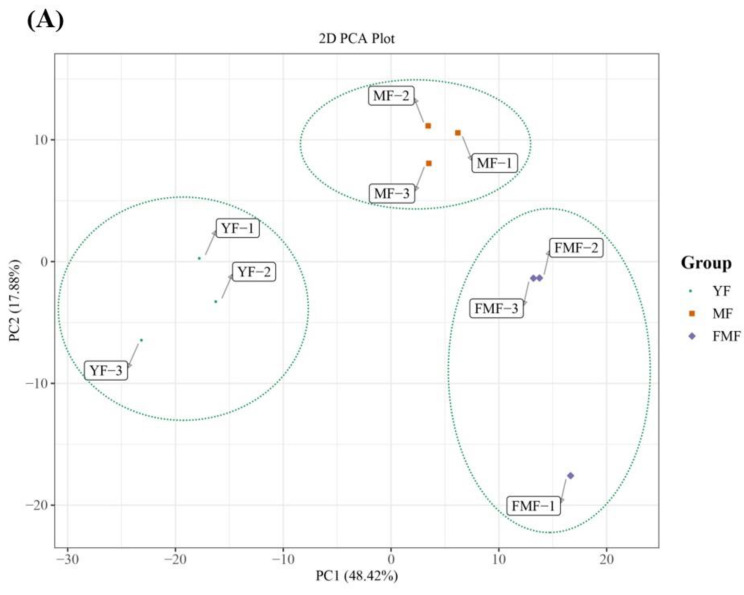
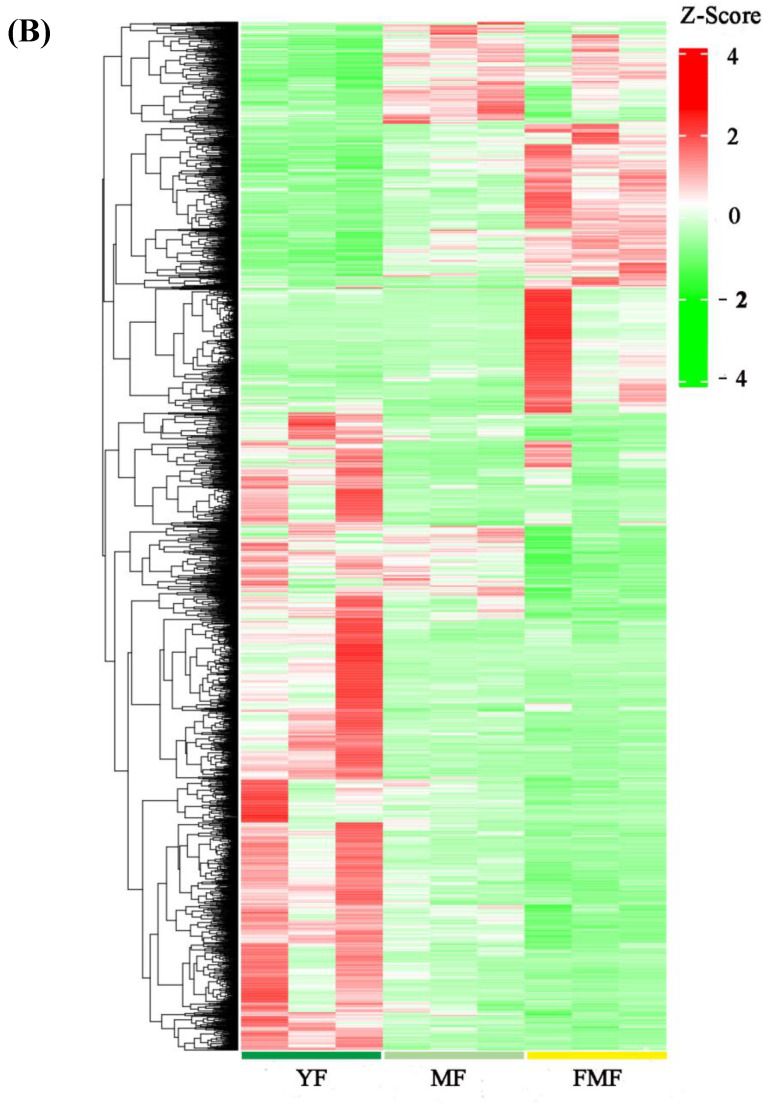
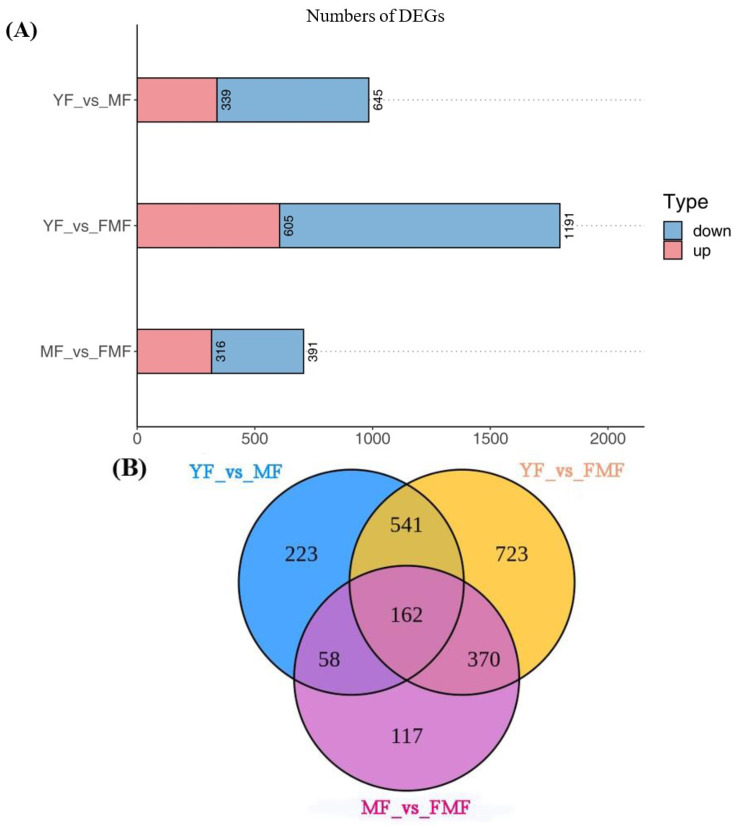
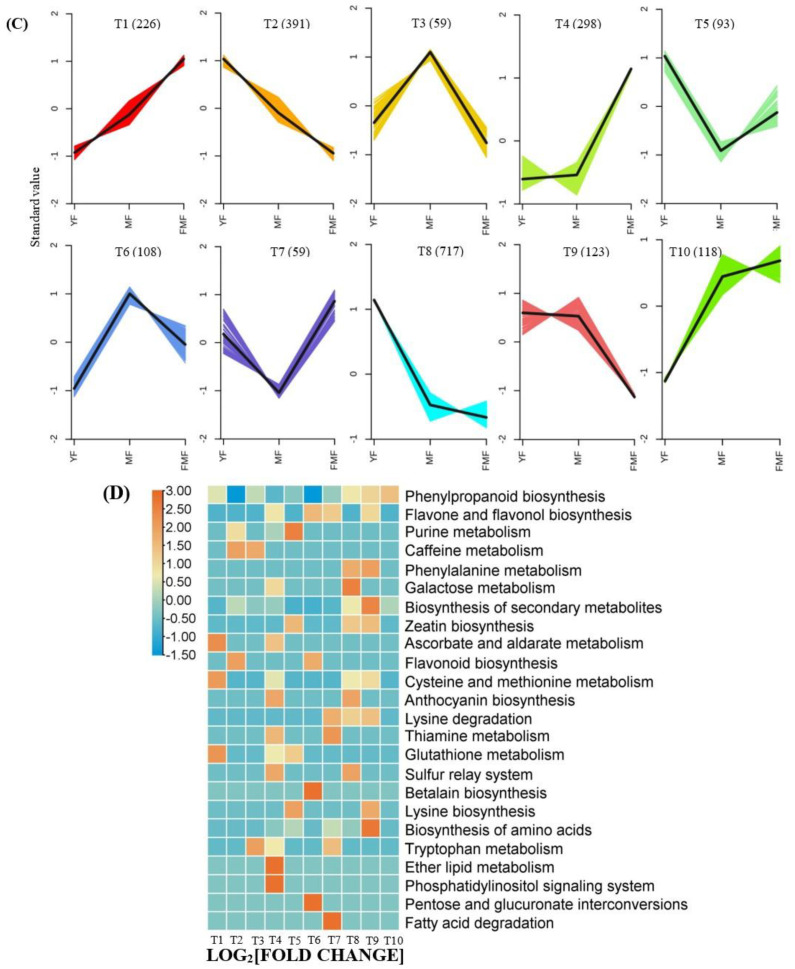
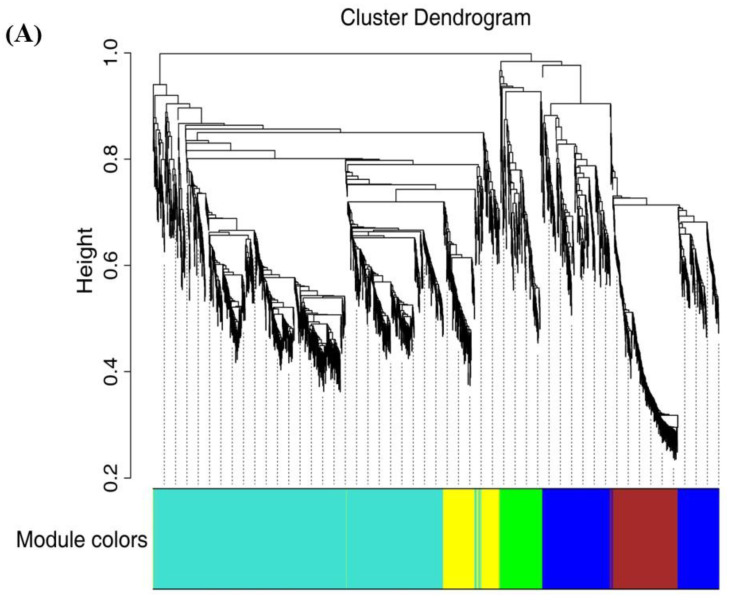
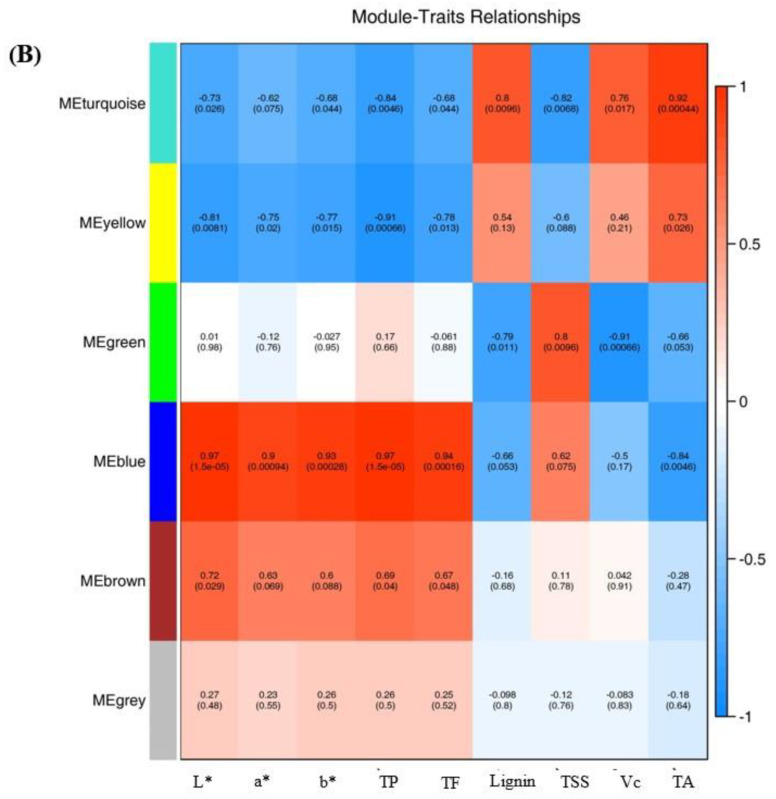
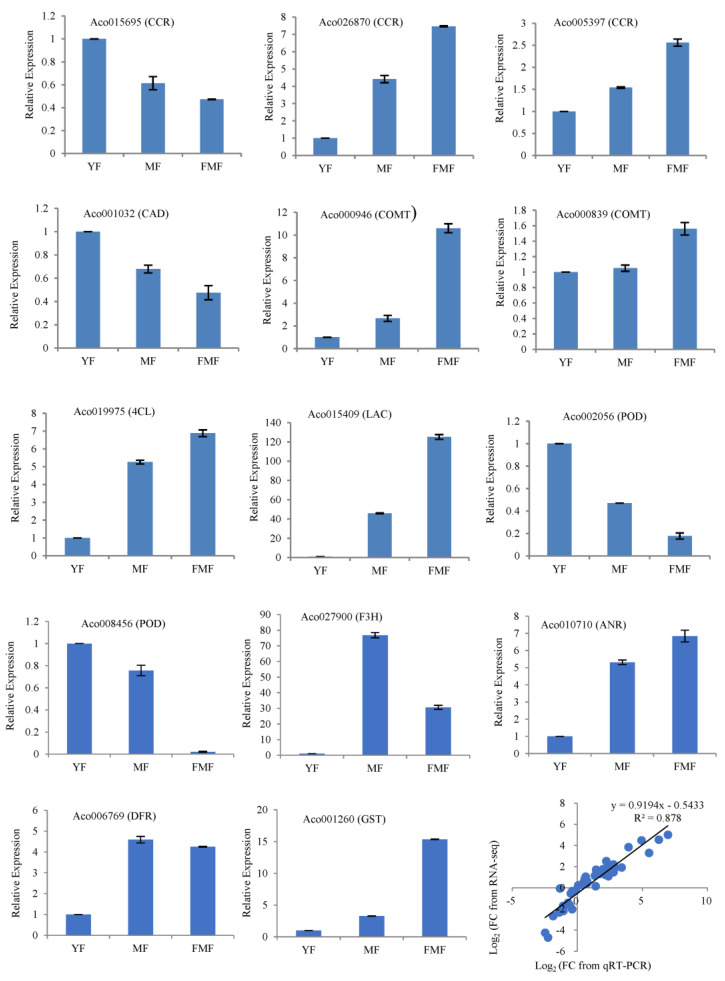
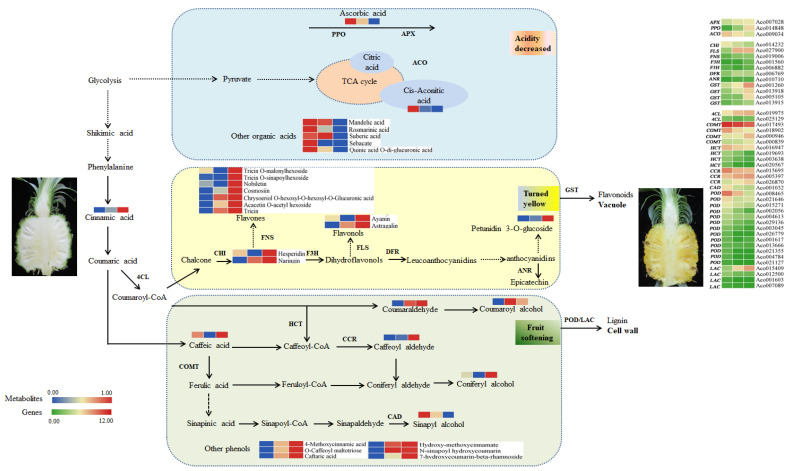
Pineapple color yellowing and quality promotion gradually manifest as pineapple fruit ripening progresses. To understand the molecular mechanism underlying yellowing in pineapples during ripening, coupled with alterations in fruit quality, comprehensive metabolome and transcriptome investigations were carried out. These investigations were conducted using pulp samples collected at three distinct stages of maturity: young fruit (YF), mature fruit (MF), and fully mature fruit (FMF). This study revealed a noteworthy increase in the levels of total phenols and flavones, coupled with a concurrent decline in lignin and total acid contents as the fruit transitioned from YF to FMF. Furthermore, the analysis yielded 167 differentially accumulated metabolites (DAMs) and 2194 differentially expressed genes (DEGs). Integration analysis based on DAMs and DEGs revealed that the biosynthesis of plant secondary metabolites, particularly the flavonol, flavonoid, and phenypropanoid pathways, plays a pivotal role in fruit yellowing. Additionally, RNA-seq analysis showed that structural genes, such as FLS, FNS, F3H, DFR, ANR, and GST, in the flavonoid biosynthetic pathway were upregulated, whereas the COMT, CCR, and CAD genes involved in lignin metabolism were downregulated as fruit ripening progressed. APX as well as PPO, and ACO genes related to the organic acid accumulations were upregulated and downregulated, respectively. Importantly, a comprehensive regulatory network encompassing genes that contribute to the metabolism of flavones, flavonols, lignin, and organic acids was proposed. This network sheds light on the intricate processes that underlie fruit yellowing and quality alterations. These findings enhance our understanding of the regulatory pathways governing pineapple ripening and offer valuable scientific insight into the molecular breeding of pineapples.
Keywords: fruit quality; metabolomics; pineapple; ripening; transcriptomics; yellowing.
Conflict of interest statement
The authors declare no conflict of interest.
Figures
Similar articles
-
Integrated Metabolomics and Transcriptomics Analysis of Flavonoid Biosynthesis Pathway in Polygonatum cyrtonema Hua.Molecules. 2024 May 10;29(10):2248. doi: 10.3390/molecules29102248. Molecules. 2024. PMID: 38792110 Free PMC article.
-
Novel Insight into the Relationship between Metabolic Profile and Fatty Acid Accumulation Altering Cellular Lipid Content in Pineapple Fruits at Different Stages of Maturity.J Agric Food Chem. 2021 Aug 4;69(30):8578-8589. doi: 10.1021/acs.jafc.1c02658. Epub 2021 Jul 26. J Agric Food Chem. 2021. PMID: 34310150
-
Integrative Analyses of Widely Targeted Metabolic Profiling and Transcriptome Data Reveals Molecular Insight into Metabolomic Variations during Apple (Malus domestica) Fruit Development and Ripening.Int J Mol Sci. 2020 Jul 7;21(13):4797. doi: 10.3390/ijms21134797. Int J Mol Sci. 2020. PMID: 32645908 Free PMC article.
-
Molecular Bases of Fruit Quality in Prunus Species: An Integrated Genomic, Transcriptomic, and Metabolic Review with a Breeding Perspective.Int J Mol Sci. 2020 Dec 30;22(1):333. doi: 10.3390/ijms22010333. Int J Mol Sci. 2020. PMID: 33396946 Free PMC article. Review.
-
A Review of Transcriptomics and Metabolomics in Plant Quality and Environmental Response: From Bibliometric Analysis to Science Mapping and Future Trends.Metabolites. 2024 May 8;14(5):272. doi: 10.3390/metabo14050272. Metabolites. 2024. PMID: 38786749 Free PMC article. Review.
Cited by
-
Advances in Molecular Research of Tropical Fruit.Int J Mol Sci. 2024 Dec 19;25(24):13582. doi: 10.3390/ijms252413582. Int J Mol Sci. 2024. PMID: 39769344 Free PMC article.
-
Identification, Phylogeny, and Expression Profiling of Pineapple Heat Shock Proteins (HSP70) Under Various Abiotic Stresses.Int J Mol Sci. 2024 Dec 14;25(24):13407. doi: 10.3390/ijms252413407. Int J Mol Sci. 2024. PMID: 39769172 Free PMC article.
-
Classification of Packaged Vegetable Soybeans Based on Freshness by Metabolomics Combined with Convolutional Neural Networks.Metabolites. 2025 Feb 21;15(3):145. doi: 10.3390/metabo15030145. Metabolites. 2025. PMID: 40137110 Free PMC article.
-
Comparative Metabolomics Analysis of Four Pineapple (Ananas comosus L. Merr) Varieties with Different Fruit Quality.Plants (Basel). 2025 Aug 3;14(15):2400. doi: 10.3390/plants14152400. Plants (Basel). 2025. PMID: 40805749 Free PMC article.
References
-
- Sun G.M., Zhang X.M., Soler A., Marie-alphonsine P.A. Nutritional Composition of Fruit Cultivars. Academic Press; Cambridge, MA, USA: 2016. Nutritional composition of pineapple (Ananas comosus (L.) Merr.) pp. 609–637. - DOI
-
- Shuvo M.S.H., Rahman S.B., Mortuza M.G., Rahman M.A. Changes in physicochemical properties of pineapple at different ripening stages during storage. J. Agrofor. Environ. 2019;13:1–2.
-
- Li L., Yi P., Sun J., Tang J., Liu G.M., Bi J.F., Teng J.W., Hu M.J., Yuan F., He X.M., et al. Genome-wide transcriptome analysis uncovers gene networks regulating fruit quality and volatile compounds in mango cultivar ‘Tainong’ during postharvest. Food Res. Int. 2023;165:112531. doi: 10.1016/j.foodres.2023.112531. - DOI - PubMed
-
- Hassan A., Othman Z., Siriphanich J. Pineapple (Ananas comosus L. Merr.) Postharvest Biol. Technol. Trop. Subtrop. Fruits. 2011;10:194–217. doi: 10.1533/9780857092618.194. - DOI
MeSH terms
Substances
Grants and funding
- No.ZDYF2021XDNY303/Science and Technology special fund of Hainan Province
- No.1630062022006/Central Public-interest Scientific Institution Basal Research Fund
- No.321QN0921/Natural Science Foundation of Hainan Province
- No.320MS087/Natural Science Foundation of Hainan Province
- No.1630062023005/Central Public-interest Scientific Institution Basal Research Fund for Chinese Academy of Tropical Agricultural Sciences
LinkOut - more resources
Full Text Sources
Research Materials
Miscellaneous
