

Whole-Transcriptome RNA Sequencing Uncovers the Global Expression Changes and RNA Regulatory Networks in Duck Embryonic Myogenesis
- PMID: 38003577
- PMCID: PMC10671564
- DOI: 10.3390/ijms242216387
Whole-Transcriptome RNA Sequencing Uncovers the Global Expression Changes and RNA Regulatory Networks in Duck Embryonic Myogenesis
Abstract
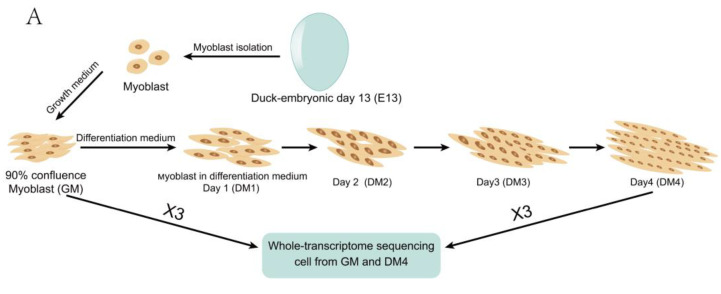
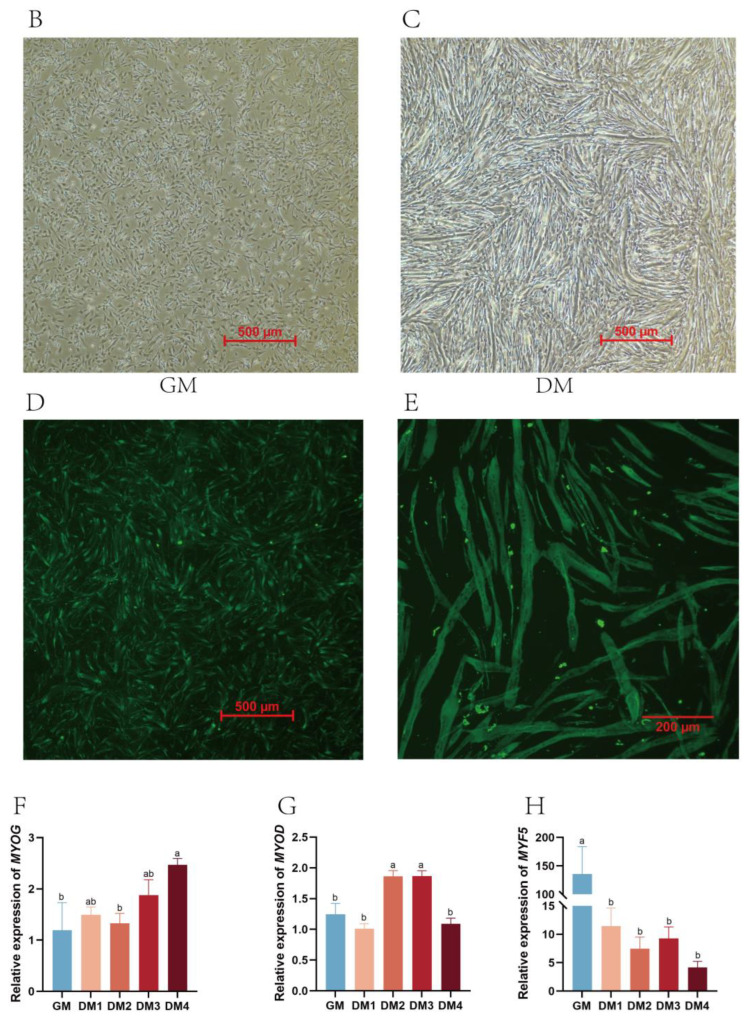
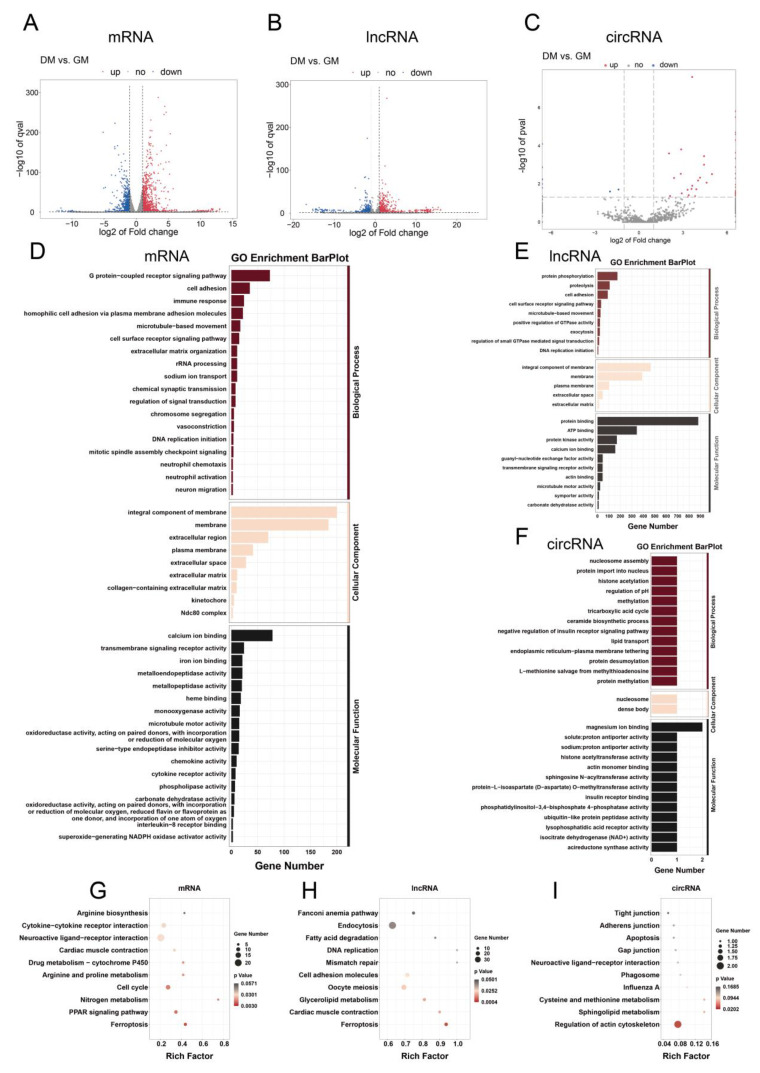
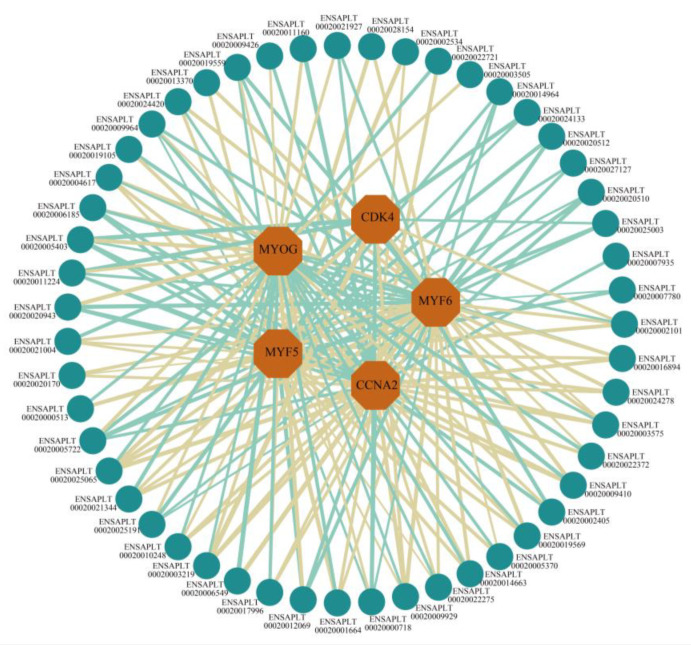
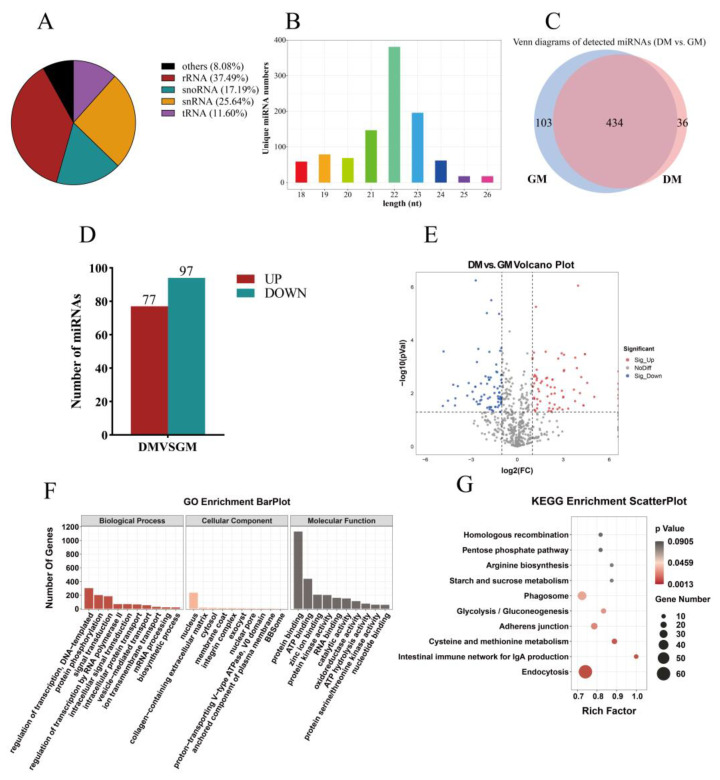
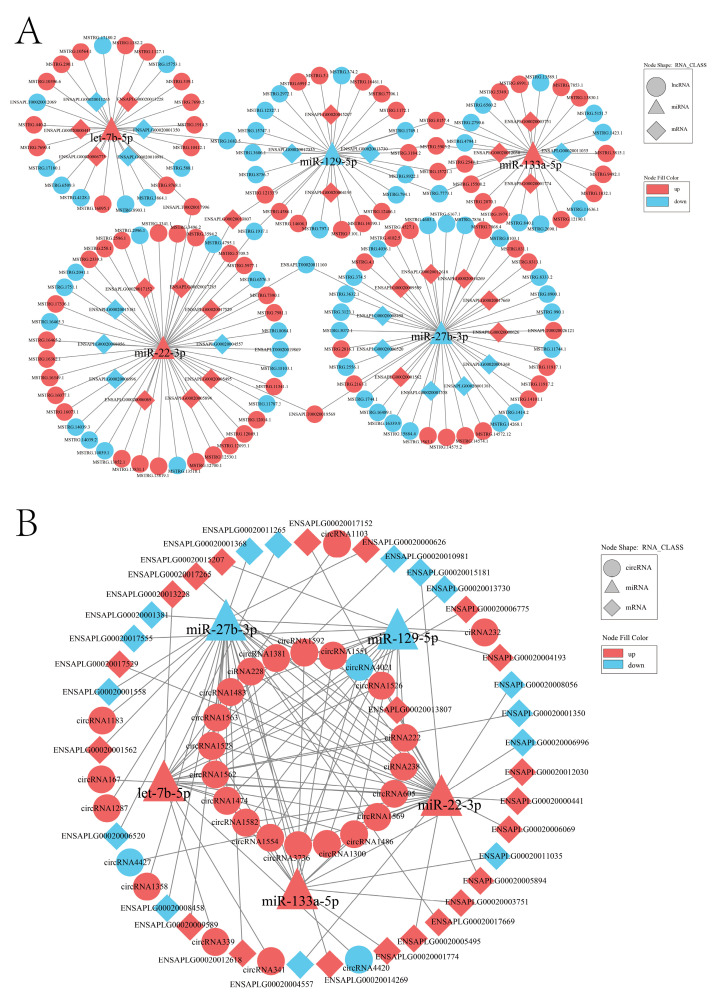
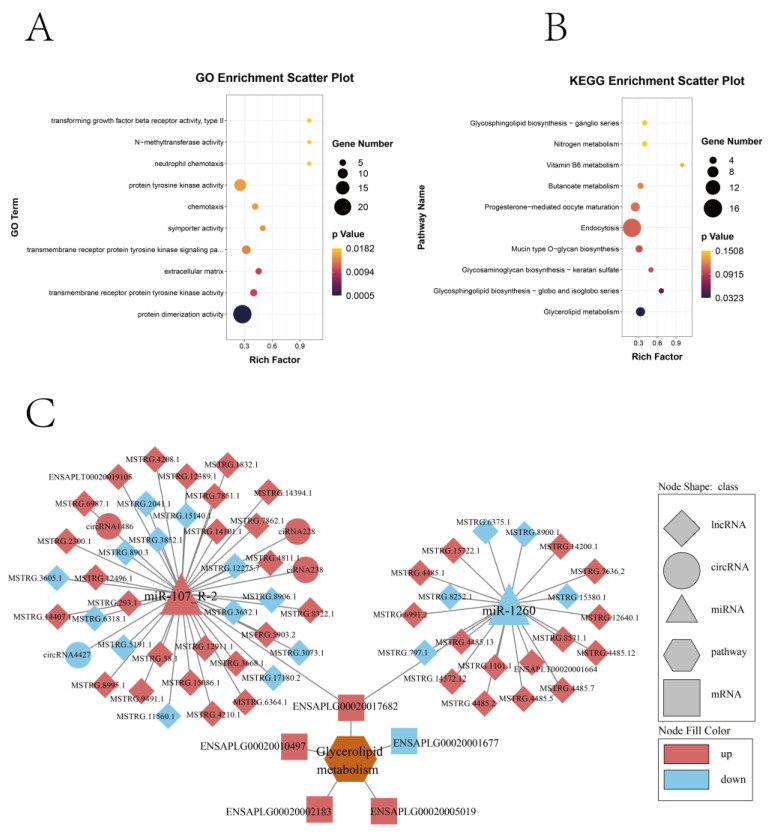
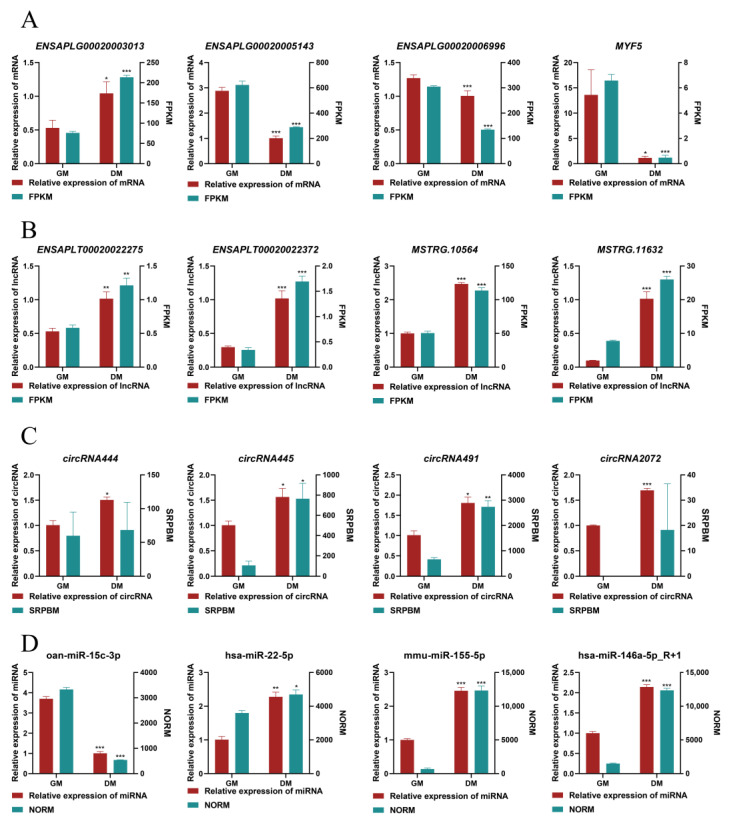
Duck meat is pivotal in providing high-quality protein for human nutrition, underscoring the importance of studying duck myogenesis. The regulatory mechanisms governing duck myogenesis involve both coding and non-coding RNAs, yet their specific expression patterns and molecular mechanisms remain elusive. To address this knowledge gap, we performed expression profiling analyses of mRNAs, lncRNAs, circRNAs, and miRNAs involved in duck myogenesis using whole-transcriptome RNA-seq. Our analysis identified 1733 differentially expressed (DE)-mRNAs, 1116 DE-lncRNAs, 54 DE-circRNAs, and 174 DE-miRNAs when comparing myoblasts and myotubes. A GO analysis highlighted the enrichment of DE molecules in the extracellular region, protein binding, and exocyst. A KEGG analysis pinpointed pathways related to ferroptosis, PPAR signaling, nitrogen metabolism, cell cycle, cardiac muscle contraction, glycerolipid metabolism, and actin cytoskeleton. A total of 51 trans-acting lncRNAs, including ENSAPLT00020002101 and ENSAPLT00020012069, were predicted to participate in regulating myoblast proliferation and differentiation. Based on the ceRNAs, we constructed lncRNA-miRNA-mRNA and circRNA-miRNA-mRNA ceRNA networks involving five miRNAs (miR-129-5p, miR-133a-5p, miR-22-3p, miR-27b-3p, and let-7b-5p) that are relevant to myogenesis. Furthermore, the GO and KEGG analyses of the DE-mRNAs within the ceRNA network underscored the significant enrichment of the glycerolipid metabolism pathway. We identified five different DE-mRNAs, specifically ENSAPLG00020001677, ENSAPLG00020002183, ENSAPLG00020005019, ENSAPLG00020010497, and ENSAPLG00020017682, as potential target genes that are crucial for myogenesis in the context of glycerolipid metabolism. These five mRNAs are integral to ceRNA networks, with miR-107_R-2 and miR-1260 emerging as key regulators. In summary, this study provides a valuable resource elucidating the intricate interplay of mRNA-lncRNA-circRNA-miRNA in duck myogenesis, shedding light on the molecular mechanisms that govern this critical biological process.
Keywords: ceRNA regulatory network; duck myogenesis; non-coding RNAs; whole-transcriptome sequencing.
Conflict of interest statement
The authors declare no conflict of interest.
Figures

Similar articles
-
Validation of Targeted Relationships of Novel circRNA803/lncRNA MSTRG.19726-oar-let-7a-CPEB1 ceRNA Networks, Key to Follicle Development in Single-Litter and Multi-Litter Sheep Based on Whole-Transcriptome Sequencing.Int J Mol Sci. 2025 May 28;26(11):5161. doi: 10.3390/ijms26115161. Int J Mol Sci. 2025. PMID: 40507971 Free PMC article.
-
Whole transcriptome analysis of HCT-8 cells infected by Cryptosporidium parvum.Parasit Vectors. 2022 Nov 24;15(1):441. doi: 10.1186/s13071-022-05565-4. Parasit Vectors. 2022. PMID: 36434735 Free PMC article.
-
Transcriptome Sequencing of lncRNAs, circRNAs, miRNAs, mRNAs, and Interaction Network Constructing in Acute Exacerbation of Idiopathic Pulmonary Fibrosis.Discov Med. 2023 Oct;35(178):887-896. doi: 10.24976/Discov.Med.202335178.84. Discov Med. 2023. PMID: 37811627
-
Recent advances in investigation of circRNA/lncRNA-miRNA-mRNA networks through RNA sequencing data analysis.Brief Funct Genomics. 2025 Jan 15;24:elaf005. doi: 10.1093/bfgp/elaf005. Brief Funct Genomics. 2025. PMID: 40251826 Free PMC article. Review.
-
LncRNA/CircRNA-miRNA-mRNA Axis in Atherosclerotic Inflammation: Research Progress.Curr Pharm Biotechnol. 2024;25(8):1021-1040. doi: 10.2174/0113892010267577231005102901. Curr Pharm Biotechnol. 2024. PMID: 37842894 Review.
Cited by
-
Elucidating the Functional Roles of Long Non-Coding RNAs in Alzheimer's Disease.Int J Mol Sci. 2024 Aug 25;25(17):9211. doi: 10.3390/ijms25179211. Int J Mol Sci. 2024. PMID: 39273160 Free PMC article.
-
Characterization and analysis of MicroRNA during leg muscle development in embryonic stage of daozhou grey goose.Poult Sci. 2025 Jun 5;104(9):105354. doi: 10.1016/j.psj.2025.105354. Online ahead of print. Poult Sci. 2025. PMID: 40479765 Free PMC article.
-
CircFBLN2 regulates duck myoblast proliferation and differentiation through miR-22-5p and MEF2C interaction.Poult Sci. 2025 May;104(5):105063. doi: 10.1016/j.psj.2025.105063. Epub 2025 Mar 18. Poult Sci. 2025. PMID: 40120247 Free PMC article.
-
Genome-wide characteristics and potential functions of circular RNAs from the embryo muscle development in Chengkou mountain chicken.Front Vet Sci. 2024 May 30;11:1375042. doi: 10.3389/fvets.2024.1375042. eCollection 2024. Front Vet Sci. 2024. PMID: 38872802 Free PMC article.
-
Whole-transcriptome sequencing revealed the ceRNA regulatory network during the proliferation and differentiation of goose myoblast.Poult Sci. 2024 Nov;103(11):104173. doi: 10.1016/j.psj.2024.104173. Epub 2024 Aug 3. Poult Sci. 2024. PMID: 39153268 Free PMC article.
References
-
- Saxena V.K., Sachdev A.K., Gopal R., Pramod A.B. PRAMOD. Roles of Important Candidate Genes on Broiler Meat Quality. World’s Poult. Sci. J. 2009;65:37–50. doi: 10.1017/S0043933909000038. - DOI
MeSH terms
Substances
Grants and funding
LinkOut - more resources
Full Text Sources
Miscellaneous
