. 2023 Nov 18;24(22):16494.
doi: 10.3390/ijms242216494.

Heterotypic Stressors Unmask Behavioral Influences of PMAT Deficiency in Mice

Affiliations

Heterotypic Stressors Unmask Behavioral Influences of PMAT Deficiency in Mice

Brady L Weber et al. Int J Mol Sci. .

Abstract

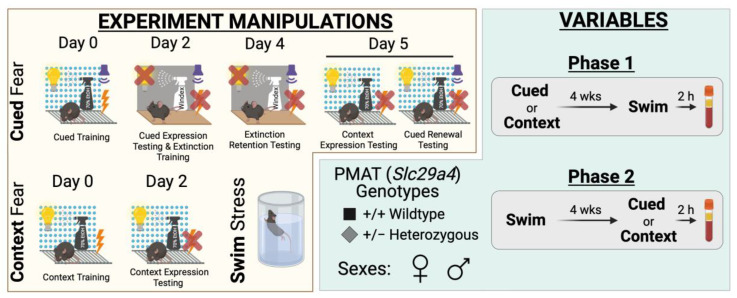
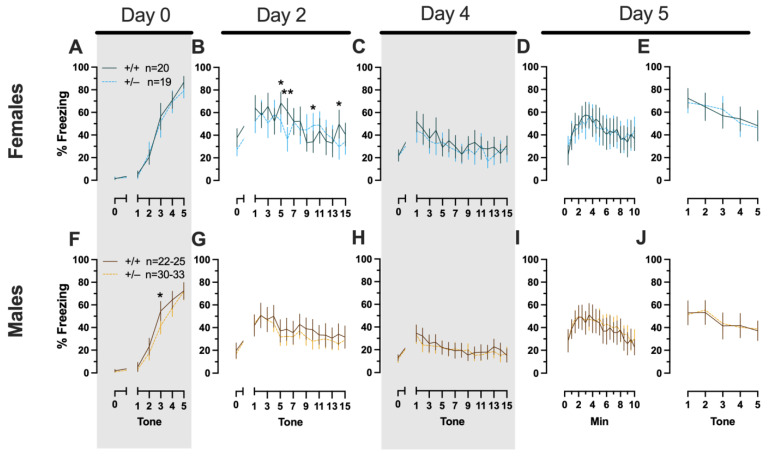
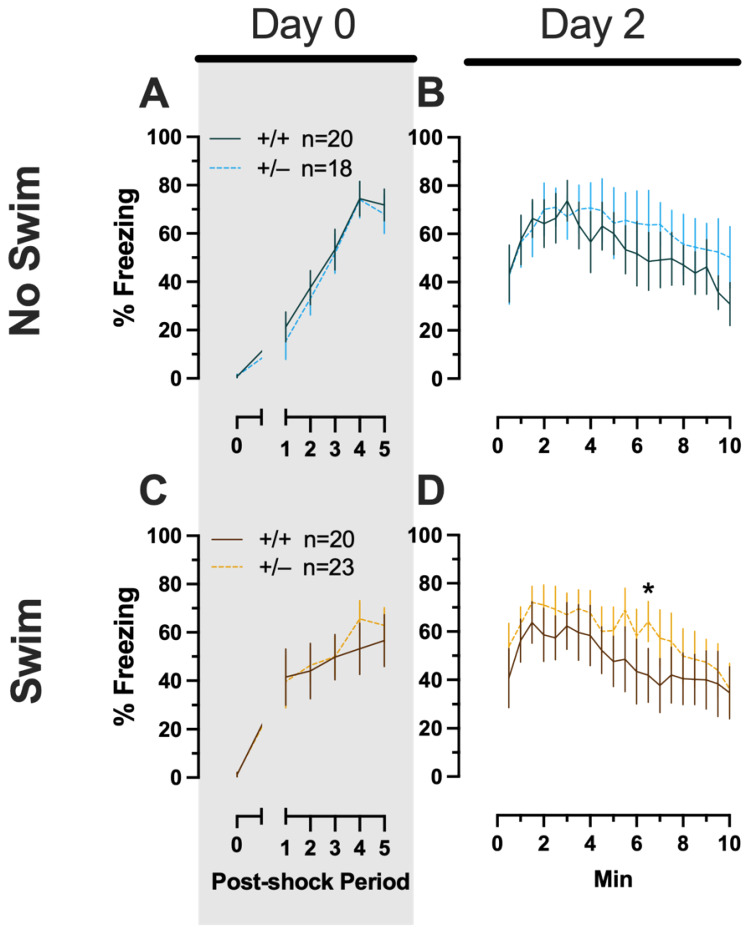
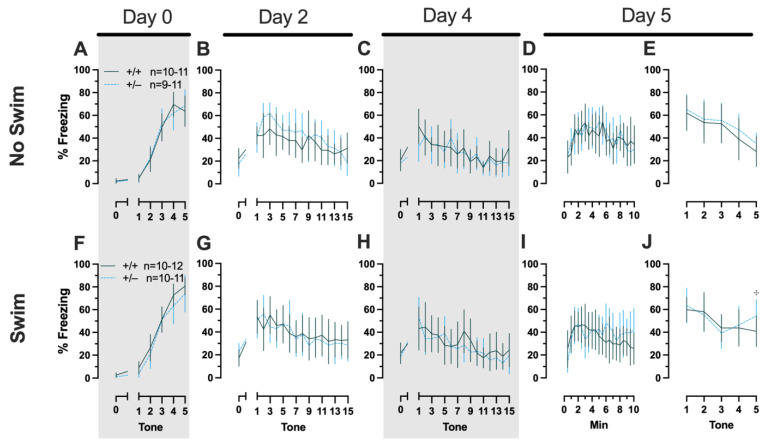
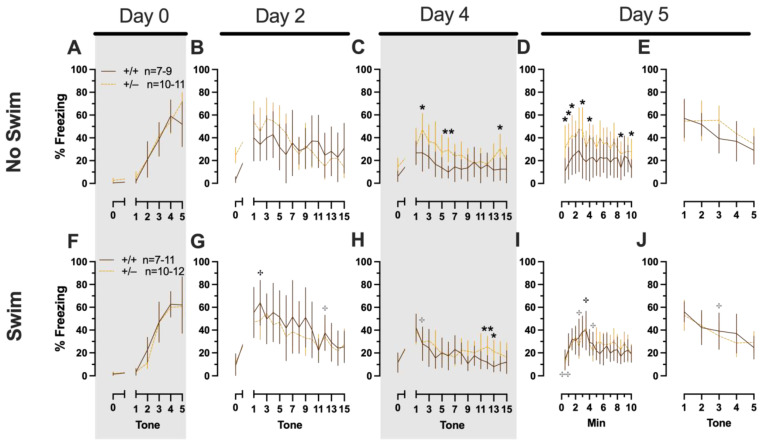
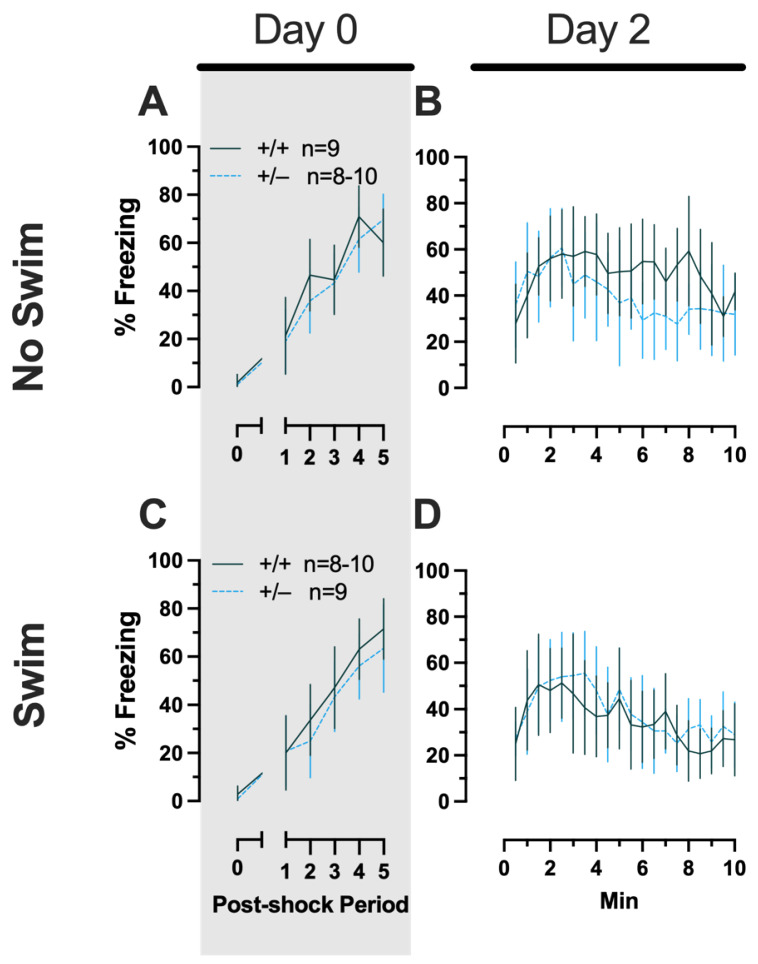
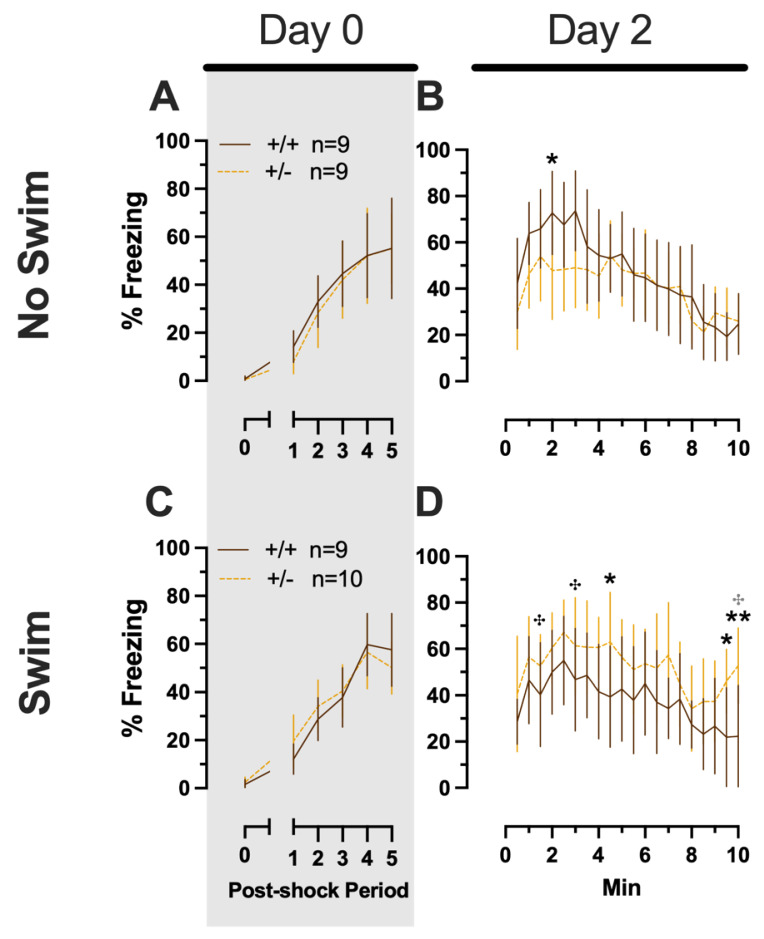
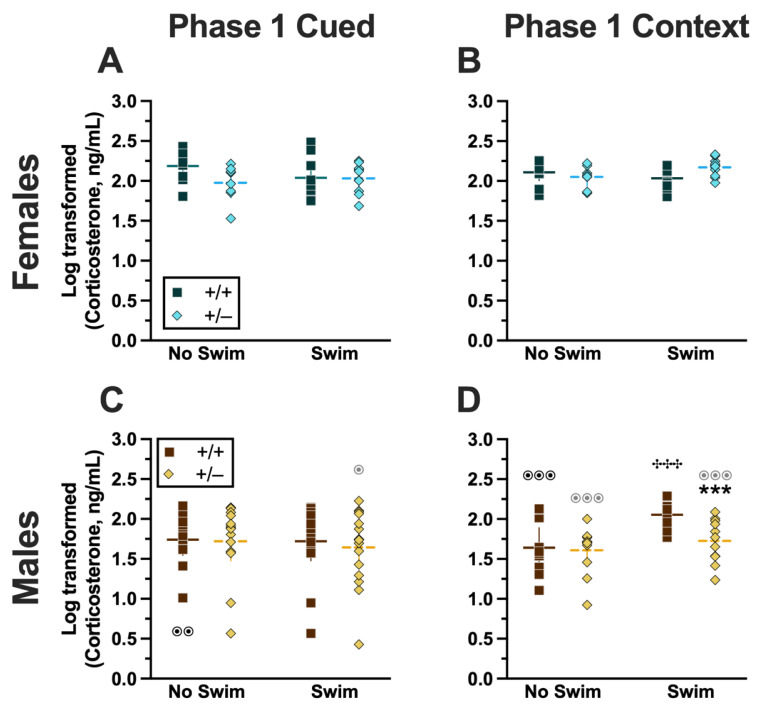
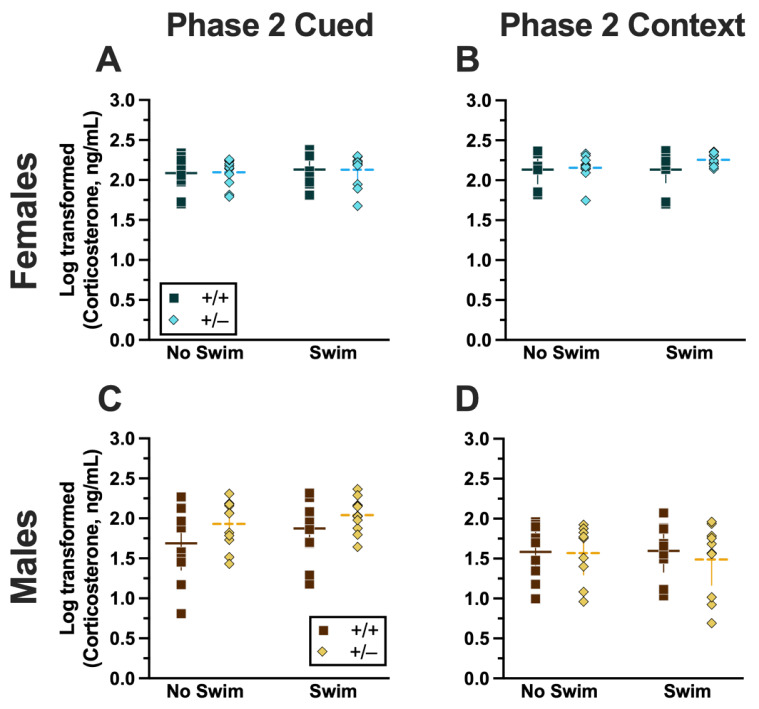
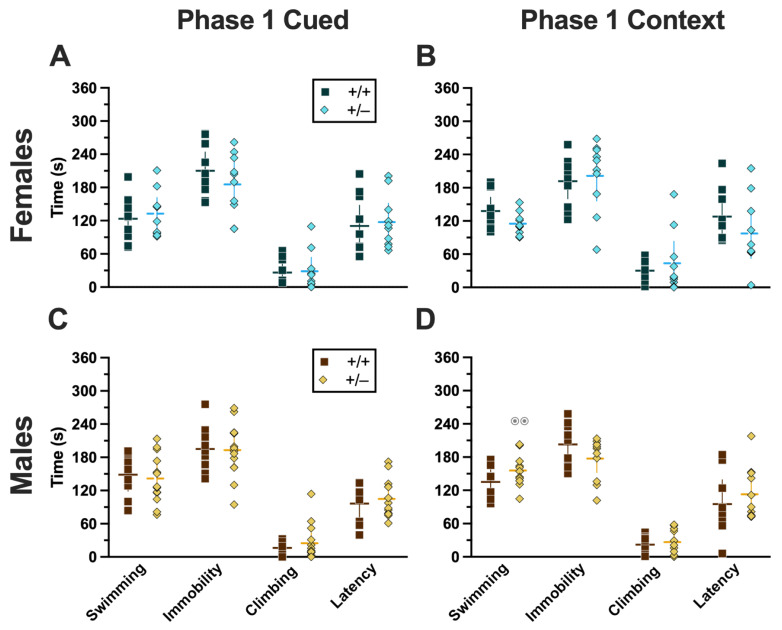
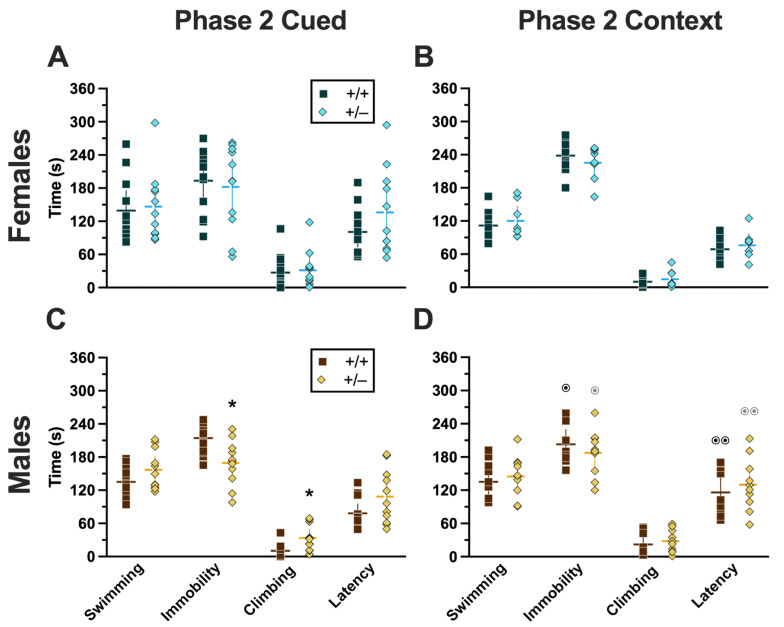
Certain life stressors having enduring physiological and behavioral consequences, in part by eliciting dramatic signaling shifts in monoamine neurotransmitters. High monoamine levels can overwhelm selective transporters like the serotonin transporter. This is when polyspecific transporters like plasma membrane monoamine transporter (PMAT, Slc29a4) are hypothesized to contribute most to monoaminergic signaling regulation. Here, we employed two distinct counterbalanced stressors-fear conditioning and swim stress-in mice to systematically determine how reductions in PMAT function affect heterotypic stressor responsivity. We hypothesized that male heterozygotes would exhibit augmented stressor responses relative to female heterozygotes. Decreased PMAT function enhanced context fear expression, an effect unexpectedly obscured by a sham stress condition. Impaired cued fear extinction retention and enhanced context fear expression in males were conversely unmasked by a sham swim condition. Abrogated corticosterone levels in male heterozygotes that underwent swim stress after context fear conditioning did not map onto any measured behaviors. In sum, male heterozygous mouse fear behaviors proved malleable in response to preceding stressor or sham stress exposure. Combined, these data indicate that reduced male PMAT function elicits a form of stress-responsive plasticity. Future studies should assess how PMAT is differentially affected across sexes and identify downstream consequences of the stress-shifted corticosterone dynamics.

Keywords: behavior; corticosterone; fear conditioning; mice; sex differences; stress; swim.


Conflict of interest statement

The authors declare no conflict of interest.

Figures

Figure 1
Figure 1
Experimental manipulations and variables for study. Experimental manipulations involved cued fear conditioning, context fear conditioning, and swim stress (yellow compartment, left side). Cued fear conditioning (top, yellow compartment) involved cued fear training in Context A (visible light, grid floor, patterned background, ethanol scent) on Day 0, followed by cued fear expression testing and cued extinction training on Day 2 in Context B (infrared light, smooth floor, no background, Windex scent). On Day 4, testing of extinction retention occurred in Context B, then Day 5 involved testing mice in Context A for context expression testing followed immediately by cued fear renewal testing. Note that for Day 5, the graphic shows the different conditions for context expression testing (left; 10 min) and cued fear renewal testing (right; 5 min) for clarity, but that in practice these tests occurred within the same continuous 15 min testing session. Context fear conditioning (bottom left, yellow compartment) involved context fear training in Context A on Day 0, with testing occurring in Context A on Day 2. Swim stress involved a 6 min inescapable immersion in room temperature water (bottom right, yellow compartment). Variables involved plasma membrane monoamine transporter (PMAT, Slc29a4) genotype, sex, swim condition, and the timeline of stressor exposure (Phase 1 or 2) (green compartment, right side). Wild-type (+/+) or heterozygous (+/−) mice of both sexes were used (bottom left, green compartment). Phase 1 (top right, green compartment) involved exposing mice to either cued or context fear conditioning, followed 4 weeks later by swim stress; 2 h after swim stress, blood was collected for serum corticosterone analyses. Phase 2 (bottom right, green compartment) had mice undergo swim stress, followed 4 weeks later by either cued or context fear conditioning; 2 h after the last test (Day 5, cued; Day 2, context), blood was collected for serum corticosterone analyses.
Figure 2
Figure 2
Phase 1 cued fear conditioning in female and male mice, collapsed across swim condition. Female (AE) wild types are represented by teal solid lines, and female heterozygotes are represented by blue dashed lines. Male (FJ) wild types are represented by orange solid lines, and male heterozygotes are represented by yellow dashed lines. Fear conditioning commenced 4 weeks prior to swim stress exposure for Phase 1. Mice were trained on Day 0 in Context A, then two days later (Day 2), mice were placed in Context B for cued fear expression testing as well as cued fear extinction training. Two days thereafter, mice underwent the identical procedure for the purposes of testing extinction retention (Day 4; C,H). One day later (Day 5), mice were placed in Context A and were tested for context fear expression (D,I) followed immediately by testing cued fear renewal (E,J). Data are percent time spent freezing for each 30 s period indicated. Data were analyzed within each training/testing stage and within each sex using two-way repeated-measures ANOVAs (PMAT genotype × time) and Holm–Šídák post hoc testing and are graphed as mean ± 95% confidence interval. * p = 0.027, * p = 0.042, * p = 0.016 (left to right, panel B); * p = 0.021 (panel F); ** p = 0.002 (panel B); indicate the difference between heterozygous and wild type within the same sex at the indicated timepoint.
Figure 3
Figure 3
Phase 1 context fear conditioning in female and male mice, collapsed across swim condition. Female (A,B) wild types are represented by teal solid lines, and female heterozygotes are represented by blue dashed lines. Male (C,D) wild types are represented by orange solid lines, and male heterozygotes are represented by yellow dashed lines. Fear conditioning commenced 4 weeks prior to swim stress exposure for Phase 1. Mice were trained on Day 0 in Context A (A,C). Two days later (Day 2), mice were placed back in Context A to test for context fear expression (B,D). Data are percent time spent freezing for each 30 s period following the foot shock (A,C) or every 30 s of testing (B,D). Data were analyzed within each training/testing stage and within each sex using two-way repeated-measures ANOVAs (PMAT genotype × time) and Holm–Šídák post hoc testing and are graphed as mean ± 95% confidence interval. * p = 0.039 indicates a difference between heterozygous and wild type within the same sex at the indicated time point.
Figure 4
Figure 4
Phase 2 cued fear conditioning in female mice, separated by swim condition. Female wild types are represented by teal solid lines, and female heterozygotes are represented by blue dashed lines. Fear conditioning occurred 4 weeks after swim stress exposure for Phase 2. Mice were trained on Day 0 in Context A (A,F). Two days later (Day 2), mice were placed in Context B (B,G); this served as cued fear expression testing as well as cued fear extinction training. Two days thereafter, mice underwent the identical procedure for the purposes of testing extinction retention (Day 4; C,H). One day later (Day 5), mice were placed in Context A to test for context fear expression (D,I) then immediately thereafter tested for cued fear renewal (E,J). Data are percent time spent freezing for each 30 s period indicated. Data were analyzed within each training/testing stage and within each sex, using 3-way repeated-measures ANOVAs (time × PMAT genotype × swim condition) and pairwise comparisons with Bonferroni correction, and are graphed as mean ± 95% confidence interval. indicates p = 0.021 difference between no-swim and swim conditions within the same sex and genotype (heterozygous) at the indicated time point.
Figure 5
Figure 5
Phase 2 cued fear conditioning in male mice, separated by swim condition. Male wild types are represented by orange solid lines, and male heterozygotes are represented by yellow dashed lines. Fear conditioning occurred 4 weeks after swim stress exposure for Phase 2. Mice were trained on Day 0 in Context A (A,F), then two days later (Day 2) placed in Context B (B,G), where they underwent cued fear expression testing as well as cued fear extinction training. Two days thereafter, mice underwent the identical procedure for the purposes of testing extinction retention (Day 4; C,H). One day later (Day 5), mice were placed in Context A for context fear expression (D,I). Immediately after context fear expression testing, mice were tested for cued fear renewal (E,J). Data are percent time spent freezing for each 30 s period indicated. Data were analyzed within each training/testing stage and within each sex, using 3-way repeated-measures ANOVAs (time × PMAT genotype × swim condition) and pairwise comparisons with Bonferroni correction, and are graphed as mean ± 95% confidence interval. * p = 0.023, * p = 0.015 (left to right, panel C); * p = 0.021, * p = 0.029,* p = 0.026, * p = 0.023, * p = 0.043, * p = 0.046, * p = 0.015 (left to right, panel D); * p = 0.039 (panel H); ** p = 0.002 (panel C); ** p = 0.008 (panel H) indicate difference between heterozygous and wild type within the same sex at the indicated time point.  p = 0.025,  p = 0.019 (left to right, panel G);  p = 0.031 (panel H);  p = 0.019,  p = 0.035,  p = 0.013 (left to right, panel I); ✣✣ p = 0.009 (panel I);  p = 0.015 (panel J) indicates difference between no-swim and swim conditions within the same sex and genotype (indicated by color; black for wild-type, grey for heterozygous) at the indicated time point.
Figure 6
Figure 6
Phase 2 context fear conditioning in female mice, separated by swim condition. Female wild types are represented by teal solid lines, and female heterozygotes are represented by blue dashed lines. Fear conditioning occurred 4 weeks after swim stress exposure for Phase 2. Mice were trained on Day 0 in Context A (A,C). Two days later (Day 2), mice were placed back in Context A to test for context fear expression (B,D). Data were analyzed within each training/testing stage and within each sex, using 3-way repeated-measures ANOVAs (time × PMAT genotype × swim condition) and pairwise comparisons with Bonferroni correction. Data are percent time spent freezing for each 30 s period following the foot shock (A,C) or every 30 s of testing (B,D). Data are graphed as mean ± 95% confidence interval.
Figure 7
Figure 7
Phase 2 context fear conditioning in male mice, separated by swim condition. Male wild types are represented by orange solid lines, and male heterozygotes are represented by yellow dashed lines. Fear conditioning occurred 4 weeks after swim stress exposure for Phase 2. Mice were trained on Day 0 in Context A (A,C). Two days later (Day 2), mice were placed back in Context A to test for context fear expression (B,D). Data are percent time spent freezing for each 30 s period following the foot shock (A,C) or every 30 s of testing (B,D). Data were analyzed within each training/testing stage and within each sex, using 3-way repeated-measures ANOVAs (time × PMAT genotype × swim condition) and pairwise comparisons with Bonferroni correction, and are graphed as mean ± 95% confidence interval. * p = 0.034 (panel B); * p = 0.048, * p = 0.013 (left to right, panel D); ** p = 0.004 (panel D) indicate difference between heterozygous and wild type within the same sex at the indicated time point.  p = 0.030,  p = 0.035,  p = 0.011 (left to right, panel D) indicate difference between no-swim and swim conditions within the same sex and genotype (indicated by color; black for wild-type, grey for heterozygous) at the indicated time point.
Figure 8
Figure 8
Log-transformed corticosterone levels in mice from Phase 1. Mice in Phase 1 had blood collected 2 h following swim stress to measure serum corticosterone levels. Female (A,B) wild types are represented by teal squares, and female heterozygotes are represented by blue diamonds. Male (C,D) wild types are represented by orange squares, and male heterozygotes are represented by yellow diamonds. Phase 1 cued data (A,C) and Phase 1 context data (B,D) are graphed in columns separated by sex. Data are log-transformed serum corticosterone levels, showing individual data points. Data were analyzed within each Phase and form of fear conditioning (cued or context) by a 3-way ANOVA (PMAT genotype × sex × swim condition) and Holm–Šídák post hoc tests. Horizontal lines are shown as the mean, with vertical lines as ±95% confidence interval. *** p = 0.001 (panel D) indicates difference between heterozygous and wild type within the same sex and same swim condition. ✣✣✣ p < 0.001 (panel D) indicates difference between no-swim and swim conditions within the same sex and genotype. ⊙⊙ p = 0.008,  p = 0.014 (left to right, panel C); ⊙⊙⊙ p < 0.001, ⊙⊙⊙ p < 0.001, ⊙⊙⊙ p < 0.001 (left to right, panel D) indicate difference between sexes within the same genotype and swim condition.
Figure 9
Figure 9
Log-transformed corticosterone levels in mice from Phase 2. Mice in Phase 2 had blood collected 2 h following context fear testing and cued fear renewal to measure serum corticosterone levels. Female (A,B) wild types are represented by teal squares, and female heterozygotes are represented by blue diamonds. Male (C,D) wild types are represented by orange squares, and male heterozygotes are represented by yellow diamonds. Phase 2 cued data (A,C) and Phase 2 context data (B,D) are graphed in columns separated by sex. Data are log-transformed serum corticosterone levels, showing individual data points. Data were analyzed within each phase and form of fear conditioning (cued or context) by a 3-way ANOVA (PMAT genotype × sex × swim condition). Horizontal lines are shown as the mean, with vertical lines as ±95% confidence interval.
Figure 10
Figure 10
Behaviors during the swim stressor in Phase 1 mice. Mice in Phase 1 assigned to swim stress experienced an acute 6 min swim stressor 4 weeks after undergoing Cued (A,C) or Context (B,D) fear conditioning. Female (A,B) wild types are represented by teal squares, and female heterozygotes are represented by blue diamonds. Male (C,D) wild types are represented by orange squares, and male heterozygotes are represented by yellow diamonds. Data are the amount of time in seconds spent swimming, immobile, or climbing; or the amount of time until the first bout of immobility (i.e., latency). Data were analyzed by a 2-way ANOVA (PMAT genotype × sex) within each phase and form of fear conditioning (cued or context) and pairwise comparisons with Bonferroni correction. Horizontal lines are shown as the mean, with vertical lines as ±95% confidence interval. ⊙⊙ p = 0.003 (panel D) indicates difference between sexes within the same genotype and swim behavior.
Figure 11
Figure 11
Behaviors during the swim stressor in Phase 2 mice. Mice in Phase 2 assigned to swim stress experienced an acute 6 min swim stressor 4 weeks before undergoing Cued (A,C) or Context (B,D) fear conditioning. Female (A,B) wild types are represented by teal squares, and female heterozygotes are represented by blue diamonds. Male (C,D) wild types are represented by orange squares, and male heterozygotes are represented by yellow diamonds. Data are the amount of time in seconds spent swimming, immobile, or climbing; or the amount of time until the first bout of immobility (i.e., latency). Data were analyzed by a 2-way ANOVA (PMAT genotype × sex) within each phase and form of fear conditioning (cued or context) and pairwise comparisons with Bonferroni correction. * p = 0.049, * p = 0.043 (left to right, panel C) indicate difference between heterozygous and wild type within the same sex for the same swim behavior.  p = 0.032,  p = 0.030, ⊙⊙ p = 0.006, ⊙⊙ p = 0.003 (left to right, panel D) indicate difference between sexes within the same genotype and swim behavior.

Update of

References

    1. Puglisi-Allegra S., Kempf E., Schleef C., Cabib S. Repeated Stressful Experiences Differently Affect Brain Dopamine Receptor Subtypes. Life Sci. 1991;48:1263–1268. doi: 10.1016/0024-3205(91)90521-C. - DOI - PubMed
    1. Finlay J.M., Zigmond M.J., Abercrombie E.D. Increased Dopamine and Norepinephrine Release in Medial Prefrontal Cortex Induced by Acute and Chronic Stress: Effects of Diazepam. Neuroscience. 1995;64:619–628. doi: 10.1016/0306-4522(94)00331-X. - DOI - PubMed
    1. Fujino K., Yoshitake T., Inoue O., Ibii N., Kehr J., Ishida J., Nohta H., Yamaguchi M. Increased Serotonin Release in Mice Frontal Cortex and Hippocampus Induced by Acute Physiological Stressors. Neurosci. Lett. 2002;320:91–95. doi: 10.1016/S0304-3940(02)00029-0. - DOI - PubMed
    1. Matuszewich L., Filon M.E., Finn D.A., Yamamoto B.K. Altered Forebrain Neurotransmitter Responses to Immobilization Stress Following 3,4-Methylenedioxymethamphetamine. Neuroscience. 2002;110:41–48. doi: 10.1016/S0306-4522(01)00539-5. - DOI - PubMed
    1. Weber B.L., Beaver J.N., Gilman T.L. Summarizing Studies Using Constitutive Genetic Deficiency to Investigate Behavioural Influences of Uptake 2 Monoamine Transporters. Basic Clin. Pharmacol. Toxicol. 2023;133:439–458. doi: 10.1111/bcpt.13810. - DOI - PMC - PubMed