

Changes in Skeletal Muscle Protein Metabolism Signaling Induced by Glutamine Supplementation and Exercise
- PMID: 38004105
- PMCID: PMC10674901
- DOI: 10.3390/nu15224711
Changes in Skeletal Muscle Protein Metabolism Signaling Induced by Glutamine Supplementation and Exercise
Abstract
Aim: To evaluate the effects of resistance exercise training (RET) and/or glutamine supplementation (GS) on signaling protein synthesis in adult rat skeletal muscles.
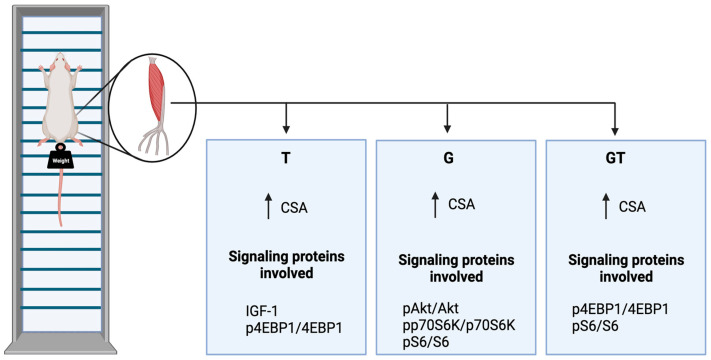
Methods: The following groups were studied: (1) control, no exercise (C); (2) exercise, hypertrophy resistance exercise training protocol (T); (3) no exercise, supplemented with glutamine (G); and (4) exercise and supplemented with glutamine (GT). The rats performed hypertrophic training, climbing a vertical ladder with a height of 1.1 m at an 80° incline relative to the horizontal with extra weights tied to their tails. The RET was performed three days a week for five weeks. Each training session consisted of six ladder climbs. The extra weight load was progressively increased for each animal during each training session. The G groups received daily L-glutamine by gavage (one g per kilogram of body weight per day) for five weeks. The C group received the same volume of water during the same period. The rats were euthanized, and the extensor digitorum longus (EDL) muscles from both hind limbs were removed and immediately weighed. Glutamine and glutamate concentrations were measured, and histological, signaling protein contents, and mRNA expression analyses were performed.
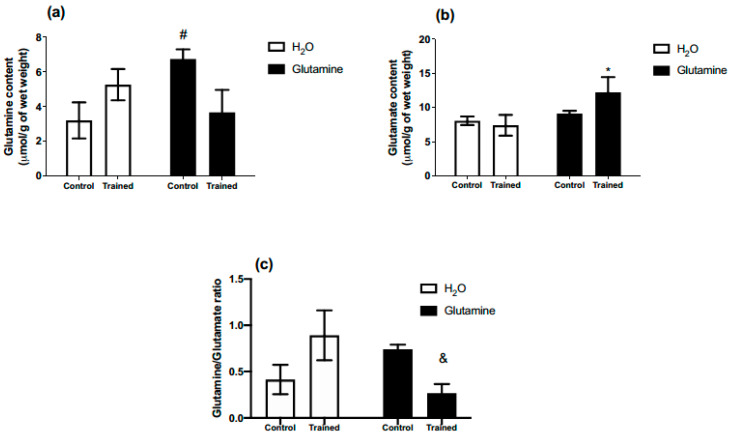
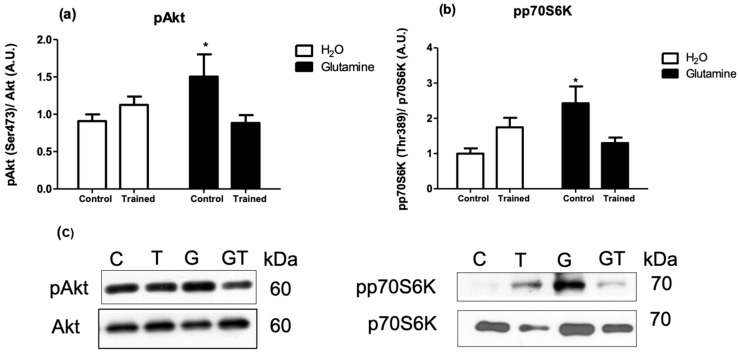
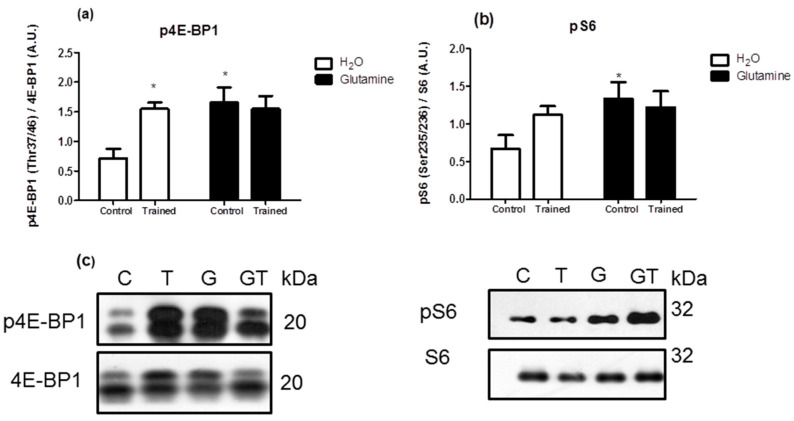
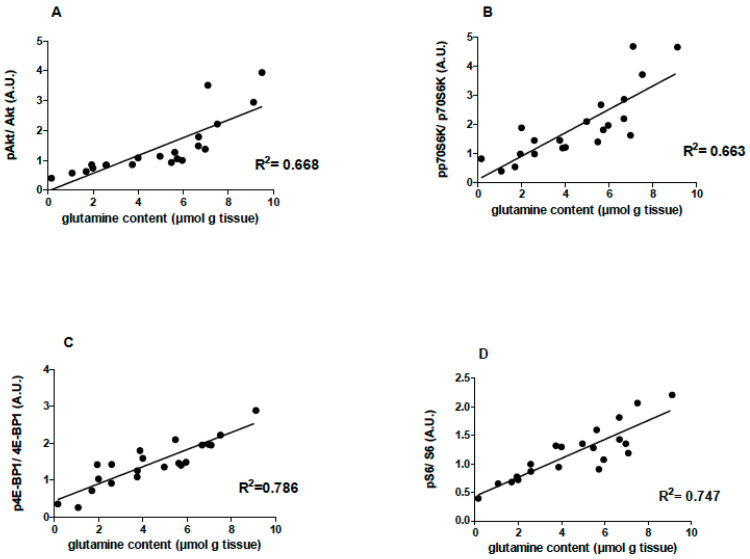
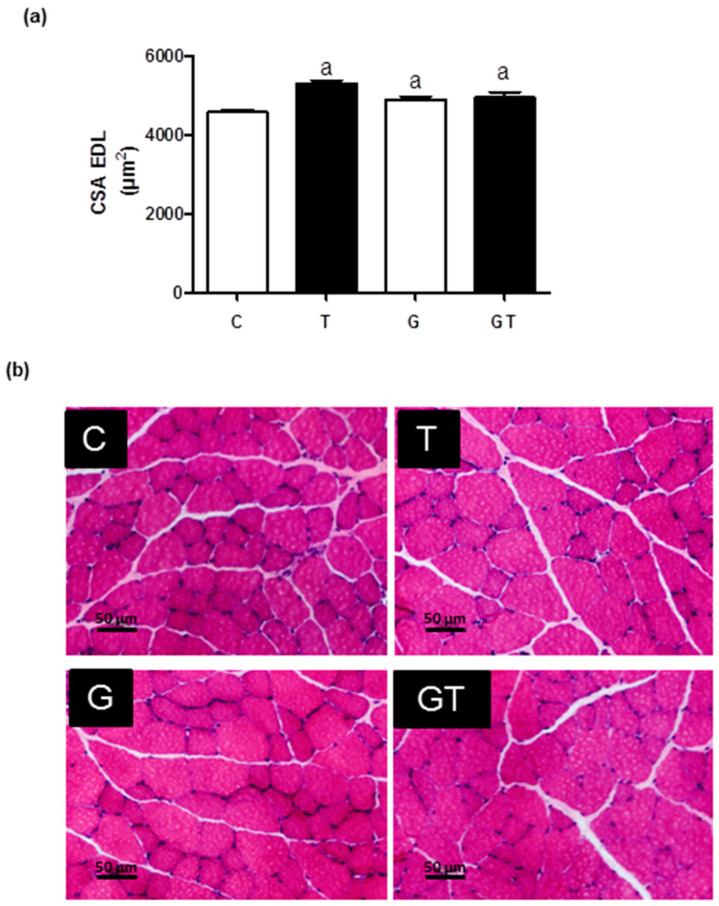
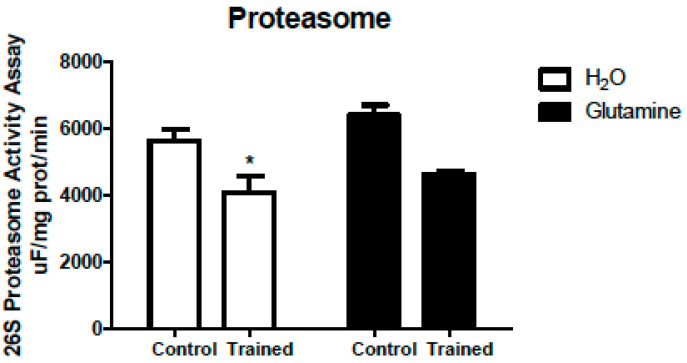
Results: Supplementation with free L-glutamine increased the glutamine concentration in the EDL muscle in the C group. The glutamate concentration was augmented in the EDL muscles from T rats. The EDL muscle mass did not change, but a significant rise was reported in the cross-sectional area (CSA) of the fibers in the three experimental groups. The levels of the phosphorylated proteins (pAkt/Akt, pp70S6K/p70S6K, p4E-BP1/4E-BP1, and pS6/S6 ratios) were significantly increased in EDL muscles of G rats, and the activation of p4E-BP1 was present in T rats. The fiber CSAs of the EDL muscles in T, G, and GT rats were increased compared to the C group. These changes were accompanied by a reduction in the 26 proteasome activity of EDL muscles from T rats.
Conclusion: Five weeks of GS and/or RET induced muscle hypertrophy, as indicated by the increased CSAs of the EDL muscle fibers. The increase in CSA was mediated via the upregulated phosphorylation of Akt, 4E-BP1, p70S6k, and S6 in G animals and 4E-BP1 in T animals. In the EDL muscles from T animals, a decrease in proteasome activity, favoring a further increase in the CSA of the muscle fibers, was reported.
Keywords: 26S proteasome; 4E-BP-1; hypertrophy; pS6; physical exercise; proteasome.
Conflict of interest statement
The authors declare no conflict of interest.
Figures
Similar articles
-
[Eccentric treadmill exercise promotes adaptive hypertrophy of gastrocnemius in rats].Sheng Li Xue Bao. 2025 Jun 25;77(3):449-464. doi: 10.13294/j.aps.2025.0051. Sheng Li Xue Bao. 2025. PMID: 40566712 Chinese.
-
Regulation of Akt-mTOR, ubiquitin-proteasome and autophagy-lysosome pathways in response to formoterol administration in rat skeletal muscle.Int J Biochem Cell Biol. 2013 Nov;45(11):2444-55. doi: 10.1016/j.biocel.2013.07.019. Epub 2013 Aug 2. Int J Biochem Cell Biol. 2013. PMID: 23916784
-
Determination of the anti-inflammatory and cytoprotective effects of l-glutamine and l-alanine, or dipeptide, supplementation in rats submitted to resistance exercise.Br J Nutr. 2016 Aug;116(3):470-9. doi: 10.1017/S0007114516001999. Epub 2016 May 24. Br J Nutr. 2016. PMID: 27215379
-
What are the potential mechanisms of fatigue-induced skeletal muscle hypertrophy with low-load resistance exercise training?Am J Physiol Cell Physiol. 2025 Mar 1;328(3):C1001-C1014. doi: 10.1152/ajpcell.00266.2024. Epub 2024 Dec 26. Am J Physiol Cell Physiol. 2025. PMID: 39726254 Review.
-
Muscle hypertrophy and ladder-based resistance training for rodents: A systematic review and meta-analysis.Physiol Rep. 2020 Sep;8(17):e14502. doi: 10.14814/phy2.14502. Physiol Rep. 2020. PMID: 32889774 Free PMC article.
Cited by
-
Resistance Exercise Training as a New Trend in Alzheimer's Disease Research: From Molecular Mechanisms to Prevention.Int J Mol Sci. 2024 Jun 27;25(13):7084. doi: 10.3390/ijms25137084. Int J Mol Sci. 2024. PMID: 39000191 Free PMC article. Review.
-
Effects of 12-Week Dietary Inflammatory Index-Based Dietary Education on Frailty Status in Frail Patients with Colorectal Cancer: A Randomized Controlled Trial.Nutrients. 2025 Jul 1;17(13):2203. doi: 10.3390/nu17132203. Nutrients. 2025. PMID: 40647307 Free PMC article. Clinical Trial.
References
-
- Gordon E.E., Kowalski K., Fritts W. Changes in rat muscle fiber with forceful exercises. Arch. Phys. Med. Rehabil. 1967;48:577–582. - PubMed
MeSH terms
Substances
Grants and funding
LinkOut - more resources
Full Text Sources
Miscellaneous
