Randomized Controlled Trial
. 2023 Nov 12;15(22):4759.
doi: 10.3390/nu15224759.

Post-Exercise Rehydration in Athletes: Effects of Sodium and Carbohydrate in Commercial Hydration Beverages

Affiliations
Randomized Controlled Trial

Post-Exercise Rehydration in Athletes: Effects of Sodium and Carbohydrate in Commercial Hydration Beverages

Nhu Q Ly et al. Nutrients. .

Abstract

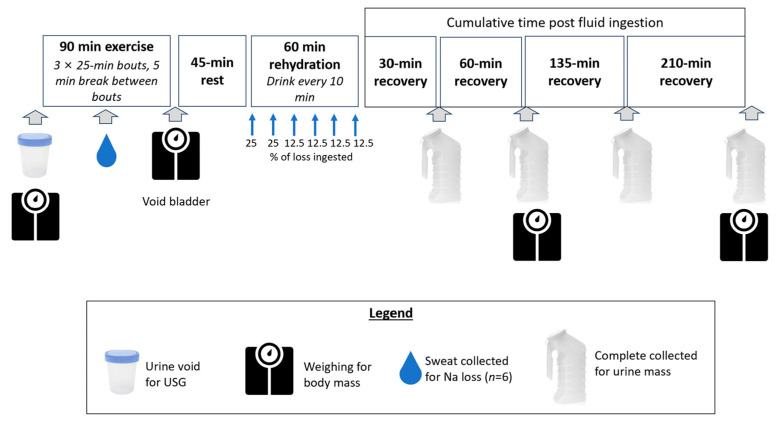
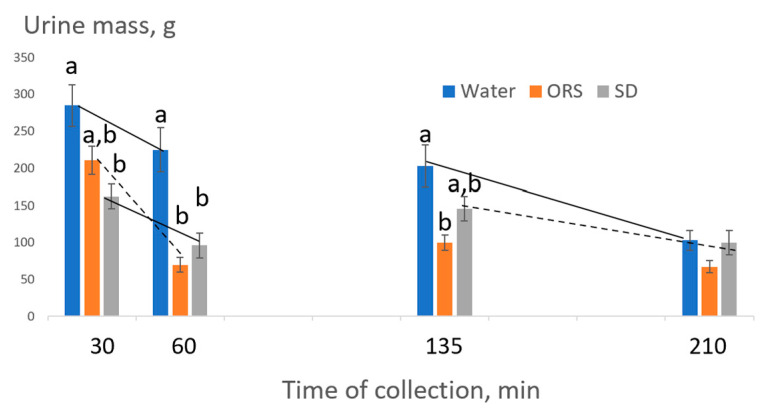
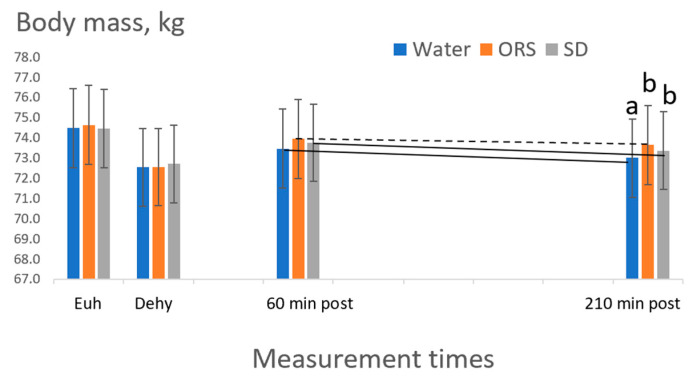
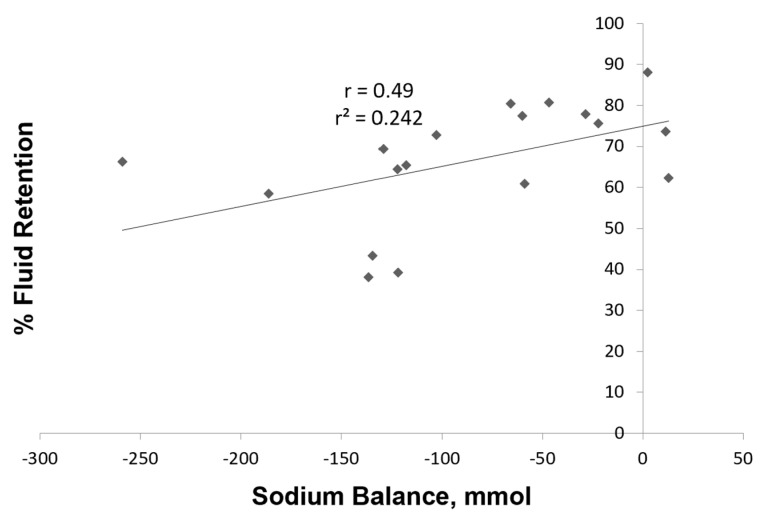
The effects of varying sodium (Na) and carbohydrate (CHO) in oral rehydration solutions (ORS) and sports drinks (SD) for rehydration following exercise are unclear. We compared an ORS and SD for the percent of fluid retained (%FR) following exercise-induced dehydration and hypothesized a more complete rehydration for the ORS (45 mmol Na/L and 2.5% CHO) and that the %FR for the ORS and SD (18 mmol Na/L and 6% CHO) would exceed the water placebo (W). A placebo-controlled, randomized, double-blind clinical trial was conducted. To induce 2.6% body mass loss (BML, p > 0.05 between treatments), 26 athletes performed three 90 min interval training sessions without drinking fluids. Post-exercise, participants replaced 100% of BML and were observed for 3.5 h for the %FR. Mean ± SD for the %FR at 3.5 h was 58.1 ± 12.6% (W), 73.9 ± 10.9% (SD), and 76.9 ± 8.0% (ORS). The %FR for the ORS and SD were similar and greater than the W (p < 0.05 ANOVA and Tukey HSD). Two-way ANOVA revealed a significant interaction with the ORS having greater suppression of urine production in the first 60 min vs. W (SD did not differ from W). By 3.5 h, the ORS and SD promoted greater rehydration than did W, but the pattern of rehydration early in recovery favored the ORS.

Keywords: carbohydrate; dehydration; oral rehydration solution; sodium; sports drink.


Conflict of interest statement

C.A.H. received honoraria for serving on the Science Advisory Board for EAS from 2013 to 2015 and from Abbott Nutrition for providing a lecture for one webinar lecture in 2022. No other conflict exist. The funding agency had no role in the design of the study; in the collection, analyses, or interpretation of data; in the writing of the manuscript; or in the decision to publish the results.

Figures

Figure 1
Figure 1
Sequence of the study protocol. Gray arrows indicate data collection times. Blue arrows during 60 min rehydration period indicate the percentage of volume ingested every 10 min.
Figure 2
Figure 2
Mean urine production (grams) at collection times 30, 60, 135, and 210 min after ingestion of water (Wat), ORS, and sports drink (SD). Bars represent standard errors. Regardless of treatment, time points differed—less urine produced—at subsequent collections. Within a timepoint, different letters indicate beverage differences (p < 0.05 for post hoc tests of significant main effects for 2-way ANOVA). The dotted line indicates where significant interactions existed vs. solid lines for the rate of urine production (p < 0.05 for beverage-by-time interactions for 2-way ANOVA). Where lines are absent, no interactions occurred.
Figure 3
Figure 3
Mean body mass (kg) at each measurement point post ingestion of water (Wat), ORS, and sports drink (SD). Eu: euhydration before exercise (baseline); Dehy: dehydration measurement after 90 min of exercise. Bars represent standard errors. Regardless of treatment, body mass differed at Dehy from other times and body mass was lower at 60 min and 210 min vs. Eu. Within a timepoint, different letters indicate beverage differences (p < 0.05 for post hoc tests of significant main effects for 2-way ANOVA). The dotted line indicates where significant interactions exist vs. solid lines (p < 0.05 for beverage-by-time interactions for 2-way ANOVA).
Figure 4
Figure 4
Relationship between fluid retained and sodium balance for six participants in the three trials (18 data points represented by diamonds). The r value was 0.49 (p < 0.05).

References

    1. Evans G.H., James L.J., Shirreffs S.M., Maughan R.J. Optimizing the restoration and maintenance of fluid balance after exercise-induced dehydration. J. Appl. Physiol. 2017;122:945–951. doi: 10.1152/japplphysiol.00745.2016. - DOI - PubMed
    1. McDermott B.P., Anderson S.A., Armstrong L.E., Casa D.J., Cheuvront S.N., Cooper L., Kenney W.L., O’Connor F.G., Roberts W.O. National athletic trainers’ association position statement: Fluid replacement for the physically active. J. Athl. Train. 2017;52:877–895. doi: 10.4085/1062-6050-52.9.02. - DOI - PMC - PubMed
    1. Montain S.J., Latzka W.A., Sawka M.N. Fluid replacement recommendations for training in hot weather. Mil. Med. 1999;164:502–508. doi: 10.1093/milmed/164.7.502. - DOI - PubMed
    1. Maughan R.J., Owen J.H., Shirreffs S.M., Leiper J.B. Post-exercise rehydration in man: Effects of electrolyte addition to ingested fluids. Eur. J. Appl. Physiol. Occup. Physiol. 1994;69:209–215. doi: 10.1007/BF01094790. - DOI - PubMed
    1. Maughan R.J., Leiper J.B. Sodium intake and post-exercise rehydration in man. Eur. J. Appl. Physiol. Occup. Physiol. 1995;71:311–319. doi: 10.1007/BF00240410. - DOI - PubMed

Publication types

LinkOut - more resources