Meta-Analysis
. 2023 Nov 15;15(22):4790.
doi: 10.3390/nu15224790.

Relationship between Iron Deficiency and Thyroid Function: A Systematic Review and Meta-Analysis

Affiliations
Meta-Analysis

Relationship between Iron Deficiency and Thyroid Function: A Systematic Review and Meta-Analysis

Vincenzo Garofalo et al. Nutrients. .

Abstract

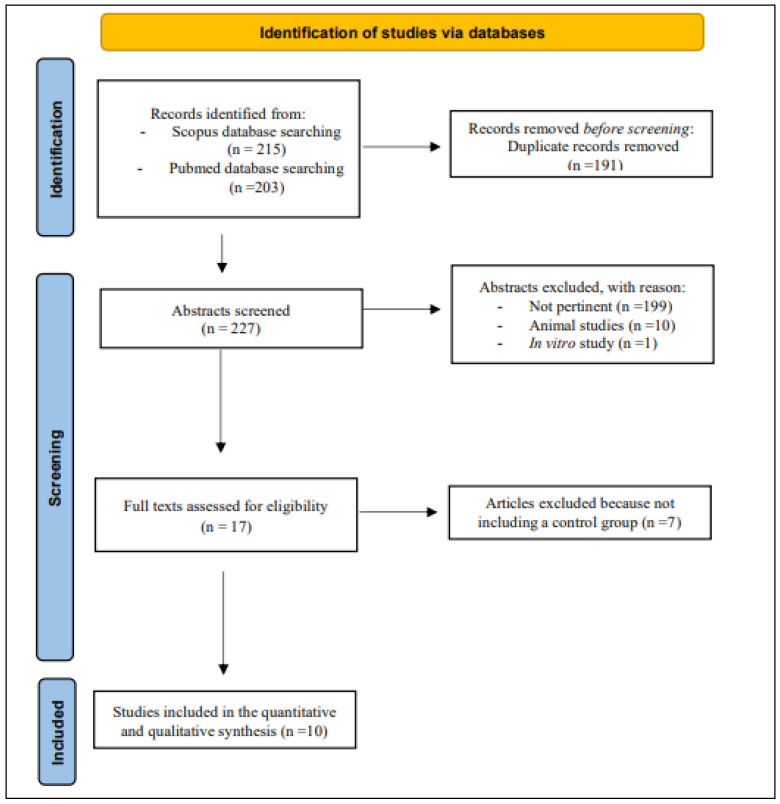
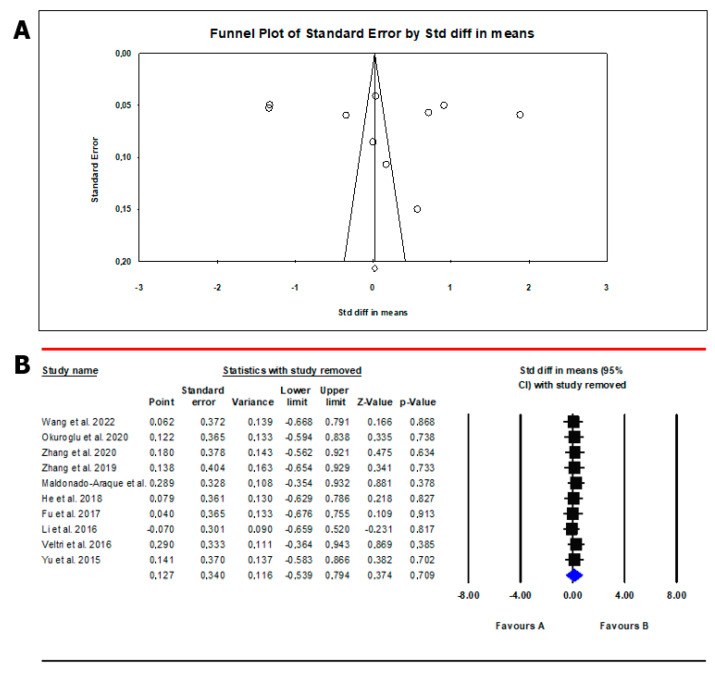
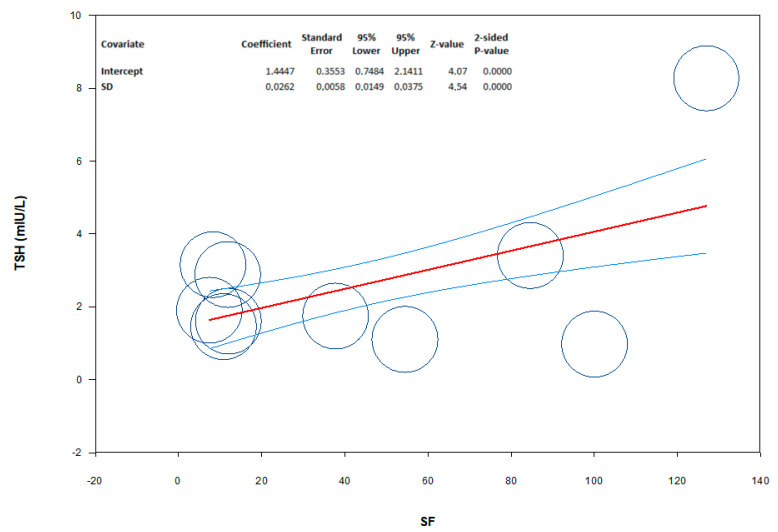
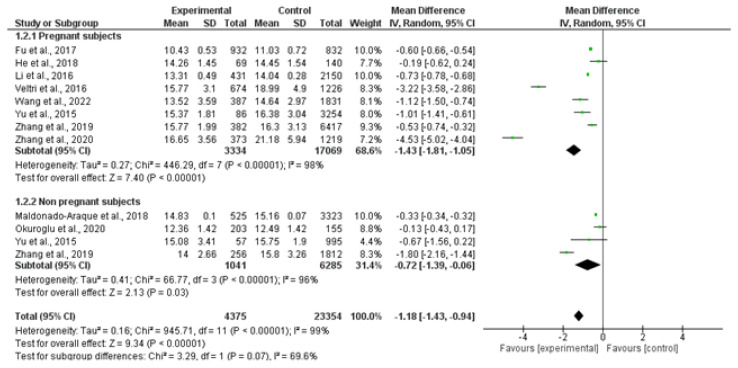
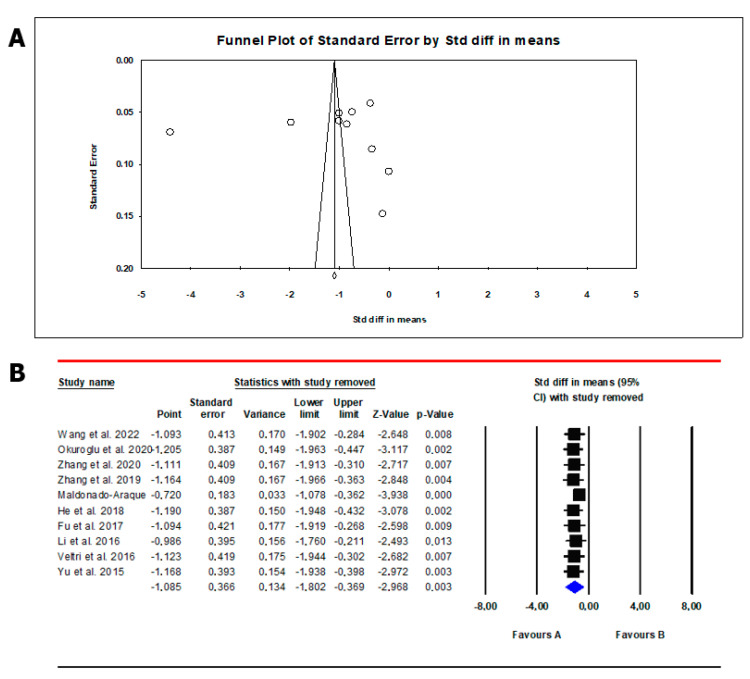
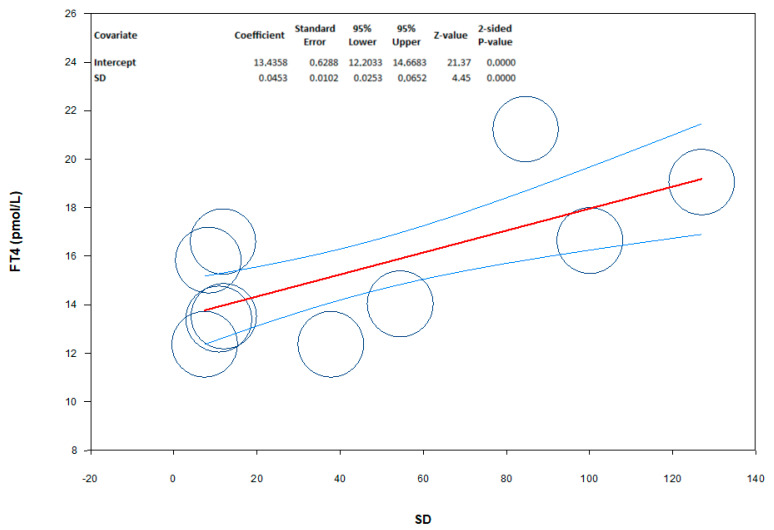
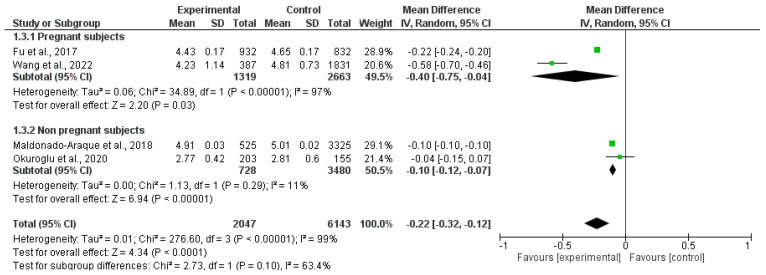
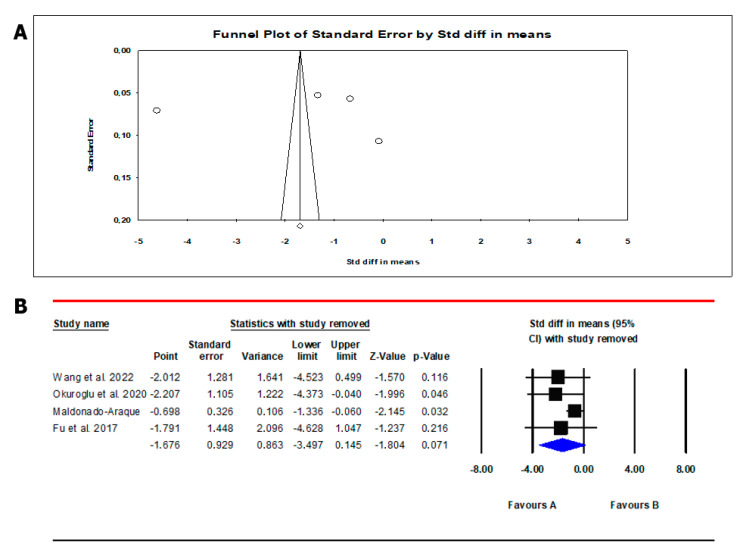
Objective: Iron deficiency (ID) is the most prevalent nutritional deficiency worldwide. Low levels of serum ferritin (SF) could affect the thyroid gland and its functioning. The purpose of this systematic review and meta-analysis is to summarize the main currently available evidence and analyze data on the relationship between ID and thyroid function. Methods: This study included all articles evaluating the relationship between ID and thyroid function. Quality assessment was performed using Cambridge Quality Checklists. The search strategy included the following combination of Medical Subjects Headings terms and keywords: "iron deficiency", "thyroid function", "thyroid disease", "thyroid dysfunction", and "hypothyroidism". A meta-analysis was performed to evaluate whether thyroid stimulating hormone (TSH), free thyroxine (FT4), and free triiodothyronine (FT3) levels differed between patients with ID and healthy controls without ID. For statistical comparison between cases and controls, the mean difference (MD) was calculated, and a subgroup analysis of pregnant and non-pregnant women was performed. Cochran's Q testing and heterogeneity indices (I2) were used to assess statistical heterogeneity. Sensitivity analysis and publication bias analyses were also performed, both qualitatively and quantitatively. Finally, a meta-regression analysis was performed to evaluate the correlation between serum TSH or FT4 levels and SF in the study population. Results: Ten cross-sectional studies were identified and reviewed. Patients with ID showed TSH (MD: -0.24 mIU/L; 95% CI -0.41, -0.07; I2 = 100%, p = 0.005), FT4 (MD: -1.18 pmol/L; 95% CI -1.43, -0.94; I2 = 99%, p < 0.000001), and FT3 (MD: -0.22 pmol/L; 95% CI -0.32, -0.12; I2 = 99%, p < 0.00001) levels that were significantly lower. Subgroup analysis confirmed significantly lower TSH, FT4, and FT3 levels in pregnant women. Non-pregnant women showed significantly lower serum FT4 and FT3 levels but no difference in TSH values. Meta-regression analysis showed that serum TSH and FT4 levels were positively correlated with SF levels. Our systematic review of the literature found that ID significantly increases the prevalence of thyroid autoantibody (anti-thyroglobulin antibodies and anti-thyroid peroxidase antibodies) positivity both individually and collectively. Conclusion: Studies currently published in the literature indicate a possible relationship between ID, thyroid function, and autoimmunity, especially in some patient groups. Data analysis shows that thyroid hormone levels are lower in patients with ID and, in particular, in pregnant women. Further studies are needed to understand the role played by iron in thyroid metabolism.

Keywords: hypothyroidism; iron deficiency; thyroid disease; thyroid dysfunction; thyroid function.


Conflict of interest statement

The authors declare no conflict of interest.

Figures

Figure 1
Figure 1
The PRISMA diagram for Databases and Registers [30].
Figure 2
Figure 2
Forest plot of mean difference in serum TSH levels between patients and controls and subgroup analysis in pregnant and non-pregnant women. Green boxes estimate the study results, and give a representation of the size of the studies. Horizontal lines represent the 95% confidence intervals of the study results, with each end of the line representing the boundaries of the confidence interval. The black diamond represents the point estimate and confidence intervals of the combined studies. The left arrow indicates a study whose estimate point and confidence interval are lower than −2. Fu et al., 2017 [25]; He et al., 2018 [24]; Li et al., 2016 [26]; Veltri et al., 2016 [27]; Wang et al., 2022 [20]; Yu et al., 2015 [28]; Zhang et al., 2019 [23]; Zhang et al., 2020 [22]; Maldonado-Araque et al., 2015 [29]; Okuroglu et al., 2020 [21].
Scheme 1
Scheme 1
Funnel plot (A) and sensitivity analysis (B) of the mean difference in serum TSH values in patients and controls. In Panel (A), circles indicate the standard error plotted by the standard difference in means of each study. Rhombus indicates a standard difference in means of zero. In Panel (B), black boxes estimate the study results, and give a representation of the size of the studies. horizontal lines represent the 95% confidence intervals of the study results, with each end of the line representing the boundaries of the confidence interval. The blue diamond represents the point estimate and confidence intervals of the combined studies. Fu et al., 2017 [25]; He et al., 2018 [24]; Li et al., 2016 [26]; Veltri et al., 2016 [27]; Wang et al., 2022 [20]; Yu et al., 2015 [28]; Zhang et al., 2019 [23]; Zhang et al., 2020 [22]; Maldonado-Araque et al., 2015 [29]; Okuroglu et al., 2020 [21].
Scheme 2
Scheme 2
Meta-regression showing the influence of serum ferritin (SF) levels (moderator) on the mean difference of serum TSH levels in patients from the study population. The size of the circles indicates the size of the study. The red line represents linear predictions for mean difference of TSH as a function of the mean absolute increase in SF. The curved lines indicate the 95% confidence interval lines around the regression line.
Figure 3
Figure 3
Forest plot of mean difference in serum free thyroxin levels between patients and controls and subgroup analysis in pregnant and non-pregnant women. Green boxes estimate the study results, and give a representation of the size of the studies. Horizontal lines represent the 95% confidence intervals of the study results, with each end of the line representing the boundaries of the confidence interval. The black diamond represents the point estimate and confidence intervals of the combined studies. Fu et al., 2017 [25]; He et al., 2018 [24]; Li et al., 2016 [26]; Veltri et al., 2016 [27]; Wang et al., 2022 [20]; Yu et al., 2015 [28]; Zhang et al., 2019 [23]; Zhang et al., 2020 [22]; Maldonado-Araque et al., 2015 [29]; Okuroglu et al., 2020 [21].
Scheme 3
Scheme 3
Funnel plot (A) and sensitivity analysis (B) of mean difference in serum free thyroxin (FT4) levels in patients and controls. In Panel (A), circles indicate the standard error plotted by the standard difference in means of each study. Rhombus indicates a standard difference in means of zero. In Panel (B), black boxes estimate the study results, and give a representation of the size of the studies. horizontal lines represent the 95% confidence intervals of the study results, with each end of the line representing the boundaries of the confidence interval. The blue diamond represents the point estimate and confidence intervals of the combined studies. Fu et al., 2017 [25]; He et al., 2018 [24]; Li et al., 2016 [26]; Veltri et al., 2016 [27]; Wang et al., 2022 [20]; Yu et al., 2015 [28]; Zhang et al., 2019 [23]; Zhang et al., 2020 [22]; Maldonado-Araque et al., 2015 [29]; Okuroglu et al., 2020 [21].
Scheme 4
Scheme 4
Meta-regression showing the influence of serum ferritin (SF) levels (moderator) on the mean difference in serum free thyroxin (FT4) levels among patients in the study population. The size of the circles indicates the sample size of the study. The red line represents linear predictions for the mean difference in FT4 as a function of the mean absolute increase in SF. The curved lines indicate the 95% confidence interval lines around the regression line.
Figure 4
Figure 4
Forest plot of the mean difference in serum free triiodothyronine levels between patients and controls and subgroup analysis in pregnant and non-pregnant women. Green boxes estimate the study results, and give a representation of the size of the studies. Horizontal lines represent the 95% confidence intervals of the study results, with each end of the line representing the boundaries of the confidence interval. The black diamond represents the point estimate and confidence intervals of the combined studies. Fu et al., 2017 [25]; Wang et al., 2022 [20]; Maldonado-Araque et al., 2015 [29]; Okuroglu et al., 2020 [21].
Scheme 5
Scheme 5
Funnel plot (A) and sensitivity analysis (B) of the mean difference in serum free triiodothyronine (FT3) levels in patients and controls. In Panel (A), circles indicate the standard error plotted by the standard difference in means of each study. Rhombus indicates a standard difference in means of zero. In Panel (B), black boxes estimate the study results, and give a representation of the size of the studies. horizontal lines represent the 95% confidence intervals of the study results, with each end of the line representing the boundaries of the confidence interval. The blue diamond represents the point estimate and confidence intervals of the combined studies. Fu et al., 2017 [25]; Wang et al., 2022 [20]; Maldonado-Araque et al., 2015 [29]; Okuroglu et al., 2020 [21].

References

    1. Kumar S.B., Arnipalli S.R., Mehta P., Carrau S., Ziouzenkova O. Iron Deficiency Anemia: Efficacy and Limitations of Nutritional and Comprehensive Mitigation Strategies. Nutrients. 2022;14:2976. doi: 10.3390/nu14142976. - DOI - PMC - PubMed
    1. Zimmermann M.B., Hurrell R.F. Nutritional iron deficiency. Lancet. 2007;370:511–520. doi: 10.1016/S0140-6736(07)61235-5. - DOI - PubMed
    1. Pasricha S.R., Tye-Din J., Muckenthaler M.U., Swinkels D.W. Iron deficiency. Lancet. 2021;397:233–248. doi: 10.1016/S0140-6736(20)32594-0. - DOI - PubMed
    1. Hess S.Y., Zimmermann M.B., Arnold M., Langhans W., Hurrell R.F. Iron deficiency anemia reduces thyroid peroxidase activity in rats. J. Nutr. 2002;132:1951–1955. doi: 10.1093/jn/132.7.1951. - DOI - PubMed
    1. Szczepanek-Parulska E., Hernik A., Ruchała M. Anemia in thyroid diseases. Pol. Arch. Intern. Med. 2017;127:352–360. doi: 10.20452/pamw.3985. - DOI - PubMed