. 2023 Oct 24;16(11):1512.
doi: 10.3390/ph16111512.

DP2, a Carbohydrate Derivative, Enhances In Vitro Osteoblast Mineralisation

Affiliations

DP2, a Carbohydrate Derivative, Enhances In Vitro Osteoblast Mineralisation

Nissrine Ballout et al. Pharmaceuticals (Basel). .

Abstract

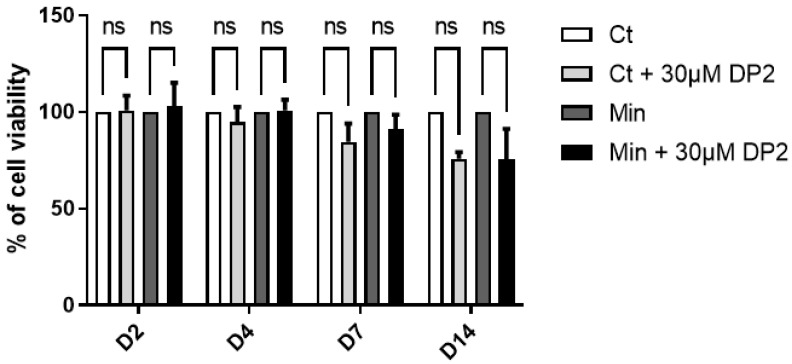
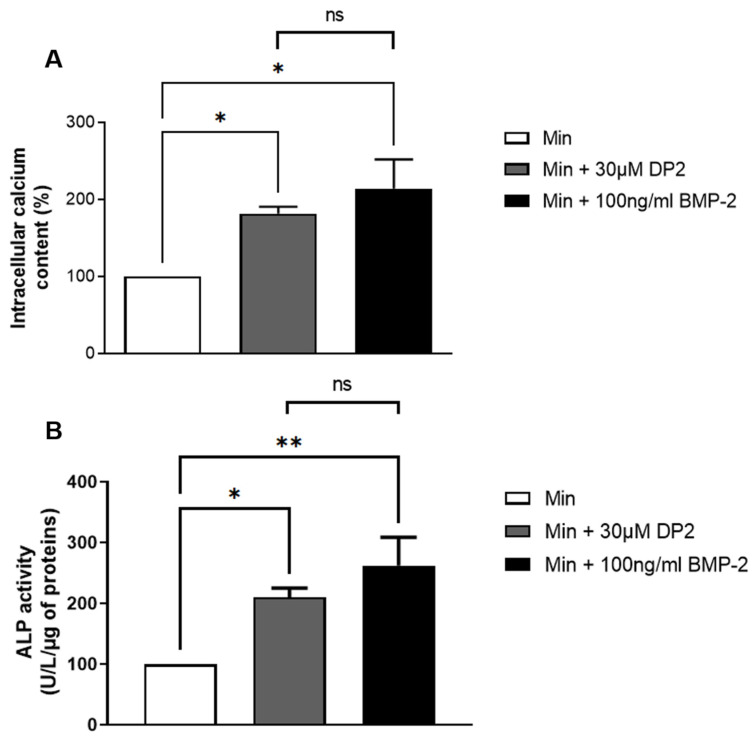
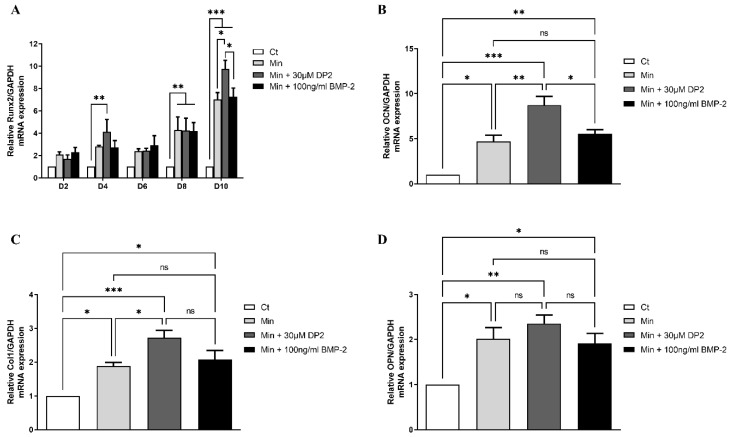
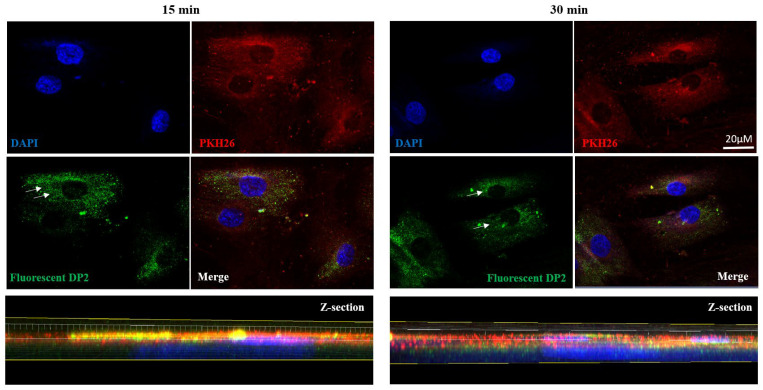
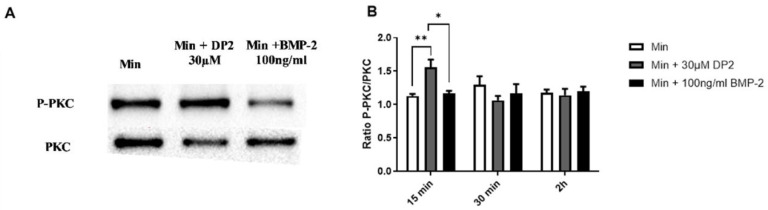
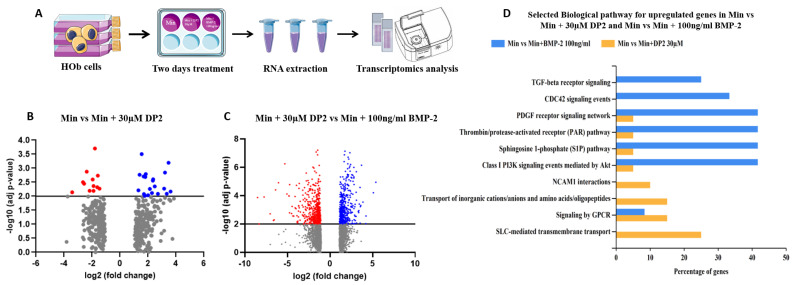
Bone fracture healing is a complex biological process involving four phases coordinated over time: hematoma formation, granulation tissue formation, bony callus formation, and bone remodelling. Bone fractures represent a significant health problem, particularly among the elderly population and patients with comorbidities. Therapeutic strategies proposed to treat such fractures include the use of autografts, allografts, and tissue engineering strategies. It has been shown that bone morphogenetic protein 2 (BMP-2) has a therapeutic potential to enhance fracture healing. Despite the clinical efficacy of BMP-2 in osteoinduction and bone repair, adverse side effects and complications have been reported. Therefore, in this in vitro study, we propose the use of a disaccharide compound (DP2) to improve the mineralisation process. We first evaluated the effect of DP2 on primary human osteoblasts (HOb), and then investigated the mechanisms involved. Our findings showed that (i) DP2 improved osteoblast differentiation by inducing alkaline phosphatase activity, osteopontin, and osteocalcin expression; (ii) DP2 induced earlier in vitro mineralisation in HOb cells compared to BMP-2 mainly by earlier activation of Runx2; and (iii) DP2 is internalized in HOb cells and activates the protein kinase C signalling pathway. Consequently, DP2 is a potential therapeutical candidate molecule for bone fracture repair.

Keywords: DP2; bone morphogenetic proteins; bone regeneration; osteoblast.


Conflict of interest statement

The authors declare no conflict of interest.

Figures

Figure 1
Figure 1
Effect of DP2 on HOb cell viability. HOb cells were incubated with either the culture medium (Ct), Ct + 30 μM DP2, mineralising medium (Min), or Min + 30 μM DP2 for 2, 4, 7, and 14 days (D). The cell viability was then assessed using the MTT test. The cell viability of untreated cells (Ct) was considered as 100%. Data are expressed as the mean ± SEM of three independent experiments performed in triplicate (n = 3). ns: non-significant.
Figure 2
Figure 2
Effect of DP2 on HOb cell calcification and alkaline phosphatase (ALP) activity. (A) HOb cells were incubated with either the mineralised medium (Min), Min + 30 μM DP2, or Min + 100 ng/mL BMP 2 for 14 days. The intracellular calcium content was quantified using the OCP colorimetric method. The intracellular calcium content of Min-treated cells (Min) was considered as 100% (n = 4). (B) HOb cells were incubated with either Min, Min + 30 μM DP2, or Min + 100 ng/mL BMP-2 for 7 days. The enzymatic activity of Min-treated cells was considered as 100% (n = 5). Data are expressed as the mean ± SEM. The p-value was determined using a one-way ANOVA, followed by Tukey’s multiple comparisons test (* p < 0.05, ** p < 0.01); ns: non-significant.
Figure 3
Figure 3
Effect of DP2 on HOb cell osteoblastic differentiation. (A) HOb cells were incubated with either a medium alone (Ct), mineralised medium (Min), Min + 30 μM DP2, or Min + 100 ng/mL BMP-2 for 2 days (D2), 4 days (D4), 6 days (D6), 8 days (D8), or 10 days (D10). Data are expressed as the mean ± SEM (n = 3). The p-value was determined using Two-way ANOVA followed by Tukey’s multiple comparisons test (* p < 0.05, ** p < 0.01, *** p < 0.001). (BD) Gene expression of (B) osteopontin (OCN), (C) type I collagen (Col1), and (D) osteopontin (OPN) was measured 10 days after treatment with either Ct, Min, Min + 30 μM DP2, or Min + 100 ng/mL BMP-2. Data are expressed as the mean ± SEM (n = 3). The p-value was determined using a one-way ANOVA followed by Tukey’s multiple comparisons test (* p < 0.05, ** p < 0.01, *** p < 0.001); ns: non-significant.
Figure 4
Figure 4
DP2 internalization in HOb cells. HOb cells were incubated with the mineralised medium (Min) + 30 μM of fluorescent DP2, and the internalisation was evaluated via confocal microscopy. High-magnification images and Z-sections showing nucleus labelling in blue (DAPI), membrane labelling in red (PKH26), and fluorescent DP2 in green 15 and 30 min after treatment. White arrows show fluorescent DP2 in the cytoplasm. Scale bar: 20 µm.
Figure 5
Figure 5
Activation of the PKC signalling pathway after DP2 treatment. HOb cells were incubated with either mineralised medium (Min) alone, Min + 30 μM DP2, or Min + 100 ng/mL BMP-2. The protein expression of the phosphorylated and total PKC (A) was evaluated by western blotting. Histograms (B) represent the ratio between the total and the phosphorylated protein. Data are expressed as the mean ± SEM of three independent experiments performed in quadruplicate (n = 4). The p-value was determined using a one-way ANOVA followed by Tukey’s multiple comparisons test (* p < 0.05, ** p < 0.01).
Figure 6
Figure 6
Effect of DP2 on gene expression in HOb cells. (A) Cell sample preparation: HOb cells were incubated with either the mineralised medium (Min), Min + 30 μM DP2, or Min + 100 ng/mL BMP-2 for 2 days. (B) Volcano plot showing the genes (blue) up- or (red) downregulated after treatment with Min + 30 µM DP2 compared to treatment with Min. (C) Volcano plot showing the genes up- or downregulated after treatment with Min + 30 µM DP2 compared to treatment with Min + 100 ng/mL BMP-2. (D) Gene ontology (GO) enrichment for the upregulated genes in HOb cells treated with Min + 30 µM DP2 compared to treatment with Min + 100 ng/mL BMP-2.
Figure 7
Figure 7
Synthesis and structure of DP2. The acceptor glucoside was obtained in eight steps, with total control of the alpha stereochemistry for the aglycone moiety. The alpha trichloroacetimidate donor glucoside was straightforwardly obtained in a three-step sequence [23].
Figure 8
Figure 8
Synthesis and structure of fluorescent DP2.

Similar articles

Cited by

References

    1. Kostenuik P., Mirza F.M. Fracture Healing Physiology and the Quest for Therapies for Delayed Healing and Nonunion. J. Orthop. Res. 2017;35:213–223. doi: 10.1002/jor.23460. - DOI - PMC - PubMed
    1. Kanis J.A., Norton N., Harvey N.C., Jacobson T., Johansson H., Lorentzon M., McCloskey E.V., Willers C., Borgström F. SCOPE 2021: A New Scorecard for Osteoporosis in Europe. Arch. Osteoporos. 2021;16:82. doi: 10.1007/s11657-020-00871-9. - DOI - PMC - PubMed
    1. Willers C., Norton N., Harvey N.C., Jacobson T., Johansson H., Lorentzon M., McCloskey E.V., Borgström F., Kanis J.A. The SCOPE review panel of the IOF Osteoporosis in Europe: A Compendium of Country-Specific Reports. Arch. Osteoporos. 2022;17:23. doi: 10.1007/s11657-021-00969-8. - DOI - PMC - PubMed
    1. Wu A.C., Raggatt L.J., Alexander K.A., Pettit A.R. Unraveling Macrophage Contributions to Bone Repair. Bonekey Rep. 2013;2:373. doi: 10.1038/bonekey.2013.107. - DOI - PMC - PubMed
    1. Marsell R., Einhorn T.A. The Biology of Fracture Healing. Injury. 2011;42:551–555. doi: 10.1016/j.injury.2011.03.031. - DOI - PMC - PubMed

Grants and funding