

Ornidazole Transfer into Colostrum and Assessment of Exposure Risk for Breastfeeding Infant: A Population Pharmacokinetic Analysis
- PMID: 38004504
- PMCID: PMC10675695
- DOI: 10.3390/pharmaceutics15112524
Ornidazole Transfer into Colostrum and Assessment of Exposure Risk for Breastfeeding Infant: A Population Pharmacokinetic Analysis
Abstract
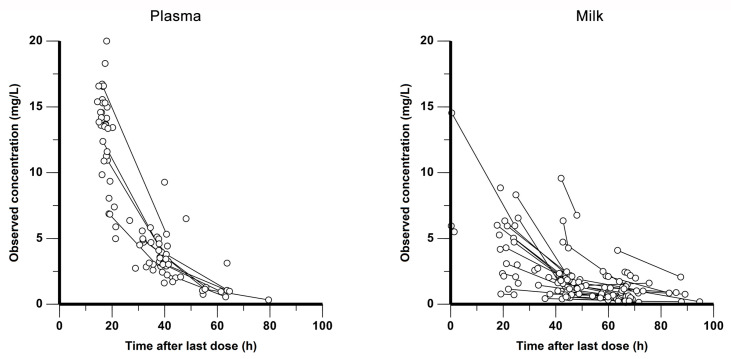
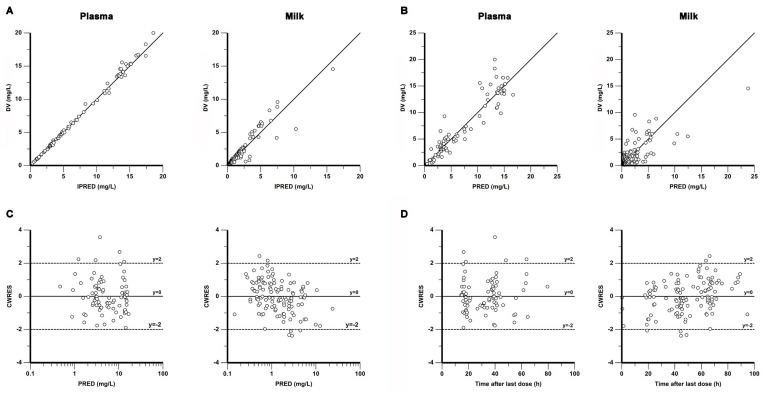
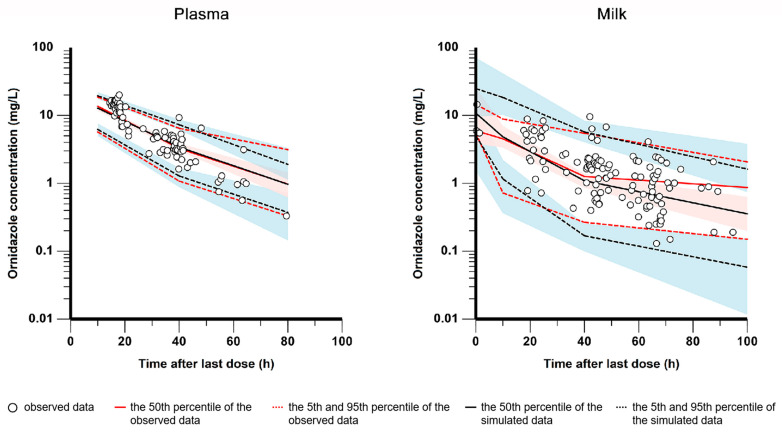
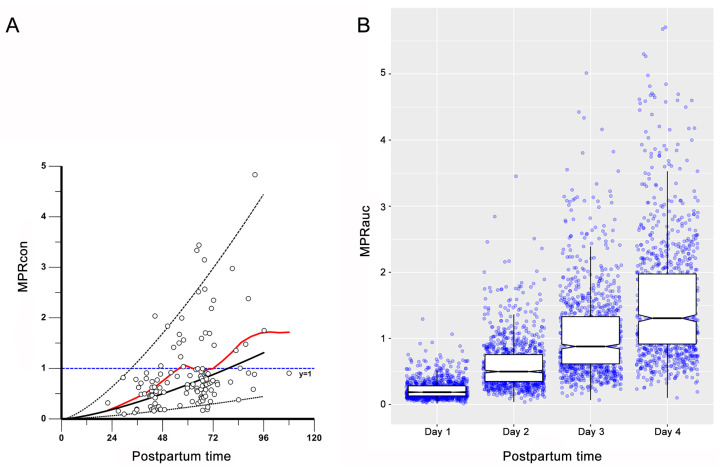
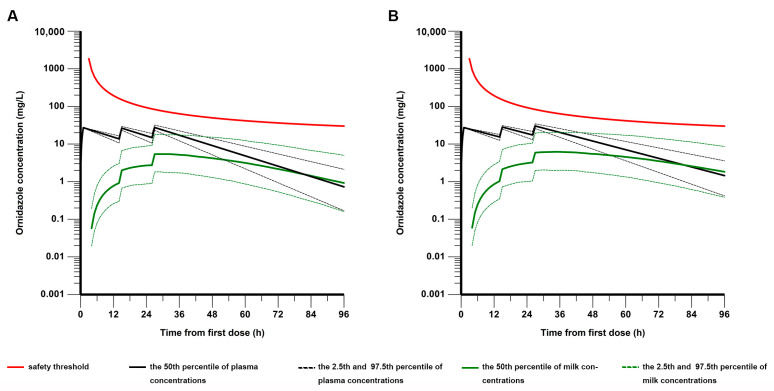
Ornidazole is frequently used for the prevention and treatment of anaerobic infections after caesarean section. There is still a lack of data on the excretion of ornidazole in breast milk. Therefore, the aim of this study was to investigate the transfer of ornidazole into colostrum and to assess the risk of infant exposure to the drug via breast milk. Population pharmacokinetic analysis was conducted using datasets of plasma and milk concentrations obtained from 77 breastfeeding women to examine the excretion kinetics of ornidazole. Various factors that may affect the excretion of ornidazole were investigated. The final model was then used to simulate ornidazole concentration-time profiles in both plasma and milk. The drug exposure in body fluids and the potential risk for breastfeeding were assessed based on the safety threshold. Plasma ornidazole concentration data could be described well by a one-compartment model, and concentrations in breast milk were linked to this model using an estimated milk-to-plasma concentration ratio (MPRcon). Significant variables that influenced drug exposure and MPRcon were identified as total bilirubin levels (TBIL) and postnatal sampling time, respectively. Simulations showed that women with abnormal liver function (TBIL > 17 μmol/L) had higher ornidazole levels in plasma and milk than those with normal liver function (TBIL < 17 μmol/L), but the exposures through colostrum of lactating women from both groups were below the safety threshold. This work provides a simple and feasible strategy for the prediction of drug exposure in breast milk and the assessment of breastfeeding safety.
Keywords: breast milk; infant dose; modeling; ornidazole; population pharmacokinetic.
Conflict of interest statement
The authors declare no conflict of interest.
Figures
Similar articles
-
Pre-exposure Prophylaxis Use by Breastfeeding HIV-Uninfected Women: A Prospective Short-Term Study of Antiretroviral Excretion in Breast Milk and Infant Absorption.PLoS Med. 2016 Sep 27;13(9):e1002132. doi: 10.1371/journal.pmed.1002132. eCollection 2016 Sep. PLoS Med. 2016. PMID: 27676257 Free PMC article.
-
Pharmacokinetics, Placental and Breast Milk Transfer of Antiretroviral Drugs in Pregnant and Lactating Women Living with HIV.Curr Pharm Des. 2019;25(5):556-576. doi: 10.2174/1381612825666190320162507. Curr Pharm Des. 2019. PMID: 30894103 Review.
-
A population pharmacokinetic model for escitalopram and its major metabolite in depressive patients during the perinatal period: Prediction of infant drug exposure through breast milk.Br J Clin Pharmacol. 2020 Aug;86(8):1642-1653. doi: 10.1111/bcp.14278. Epub 2020 Apr 14. Br J Clin Pharmacol. 2020. PMID: 32162723 Free PMC article.
-
Infant Exposure to Dolutegravir Through Placental and Breast Milk Transfer: A Population Pharmacokinetic Analysis of DolPHIN-1.Clin Infect Dis. 2021 Sep 7;73(5):e1200-e1207. doi: 10.1093/cid/ciaa1861. Clin Infect Dis. 2021. PMID: 33346335 Free PMC article. Clinical Trial.
-
Ornidazole.2023 Dec 15. Drugs and Lactation Database (LactMed®) [Internet]. Bethesda (MD): National Institute of Child Health and Human Development; 2006–. 2023 Dec 15. Drugs and Lactation Database (LactMed®) [Internet]. Bethesda (MD): National Institute of Child Health and Human Development; 2006–. PMID: 38163331 Free Books & Documents. Review.
References
-
- Andersson K.E. Pharmacokinetics of nitroimidazoles. Spectrum of adverse reactions. Scand. J. Infect. Dis. Suppl. 1981;26:60–67. - PubMed
Grants and funding
LinkOut - more resources
Full Text Sources
