. 2023 Nov 2;15(11):2570.
doi: 10.3390/pharmaceutics15112570.

The Freeze-Drying of Pharmaceuticals in Vials Nested in a Rack System-Part II: Primary Drying Behaviour

Affiliations

The Freeze-Drying of Pharmaceuticals in Vials Nested in a Rack System-Part II: Primary Drying Behaviour

Fiora Artusio et al. Pharmaceutics. .

Abstract

The freeze-drying of biopharmaceuticals is a common strategy to extend their shelf-life and facilitate the distribution of therapeutics. The drying phase is the most demanding one in terms of energy consumption and determines the overall process time. Our previous work showed how the loading configuration can impact freezing. This paper focuses on primary drying by comparing the thermal behaviour of vials loaded in direct contact with the shelf or nested in a rack system. The overall heat transfer coefficient from the apparatus to the product was evaluated at different chamber pressures (5-30 Pa) and shelf temperatures (from -10 °C to +30 °C), and in the case of various vial positions (central, semi-border, and border vials). Because of the suspended configuration, the heat transfer coefficient was less affected by chamber pressure in vials nested in a rack system. The two loading configurations displayed comparable heat transfer efficiency below 10 Pa. For higher chamber pressure, the heat transfer coefficients of nested vials were lower than those of vials in direct contact with the shelf. Nevertheless, the rack system was beneficial for reducing the inter-vial variability as it promoted higher uniformity in the heat transfer coefficients of central vials. Eventually, thermal image analyses highlighted limited temperature differences between the vials and the rack system.

Keywords: freeze-drying; heat transfer; mannitol; primary drying; rack system; sublimation flux; sucrose.


Conflict of interest statement

Roberto Pisano, Antonello A. Barresi and Davide Fissore have received funding from Stevanato Group. Maria Chiara Frare is an employee of Stevanato Group. All the authors declare no conflict of interest.

Figures

Figure 1
Figure 1
(a) Schematic of the position of points investigated with the thermal imaging camera on the cross-section of the rack system. (b) Experimental set-up used for thermal imaging investigation. (c) Thermal image of the vials nested in the rack system as recorded with the thermal imaging camera. Schematics of the loading of vials in (d) direct contact with the shelf and (e) nested in the rack system. Dashed positions refer to vials containing thermocouples.
Figure 2
Figure 2
Jq and Kv as a function of PC and TS for (■) central, (formula image
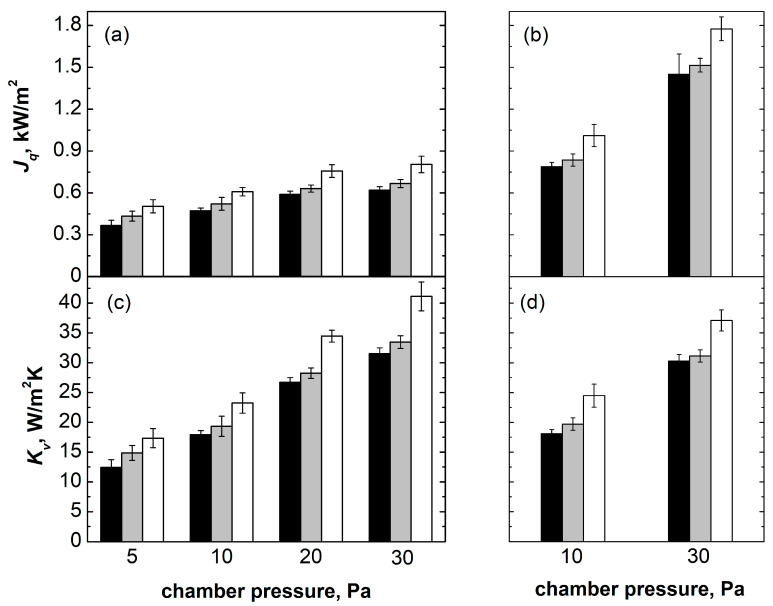
) semi-border, and (☐) border vials in direct contact with the shelf. Data reported in (a) and (c) refer to TS = −10 °C for various chamber pressures; data reported in (b) and (d) refer to TS = +10 °C for PC = 10 Pa and TS = +30 °C for Pc = 30 Pa.
Figure 3
Figure 3
Jq and Kv as a function of Pc and Ts for (■) central, (formula image
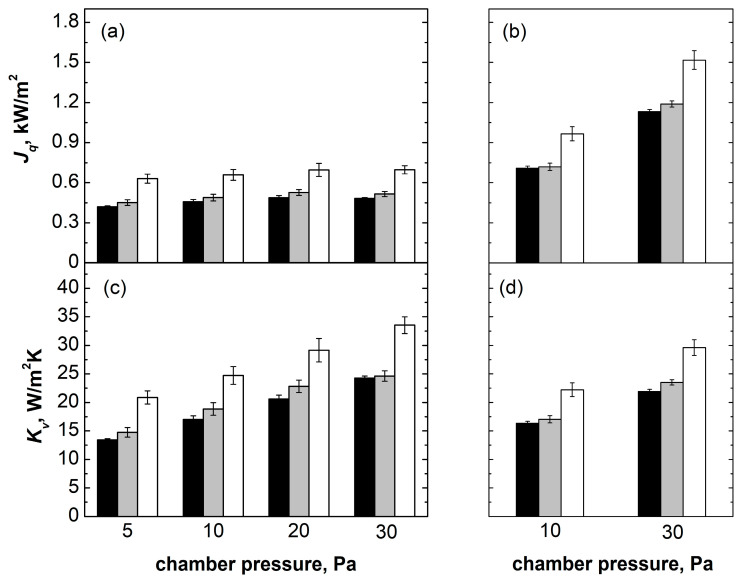
) semi-border, and (☐) border vials nested in the rack system. Data reported in (a) and (c) refer to TS = −10 °C for various chamber pressures; data reported in (b) and (d) refer to TS = +10 °C for PC = 10 Pa and TS = +30 °C for PC = 30 Pa.
Figure 4
Figure 4
Kv probability density distributions obtained for central vials in direct contact with the shelf (black symbols) and nested in a rack system (white symbols). Figure panels refer to PC = (a) 5, (b) 10, (c) 20, and (d) 30 Pa.
Figure 5
Figure 5
(a) Mathematical model predictions of Kv as a function of PC for central vials, and (b) comparison of the A parameter in Equation (3) for central, semi-border, and border vials in the two loading configurations. Black symbols/bars refer to vials in direct contact with the shelf, white symbols/bars refer to vials nested in the rack system.
Figure 6
Figure 6
IR profiles obtained during the ice sublimation phase of (a) the average temperature of the sublimation interface (red dotted line) and average maximum temperature of the thermal axial profile in the vial (red dashed line) and average temperature of the vial bottom (black line), (b) the top (blue dotted line) and bottom (blue dashed line) areas (see Figure 1a for reference) of the rack system and vial bottom (black line), and (c) the rack system fin at 10 Pa. (df) Analogous thermal profiles obtained at 30 Pa.
Figure 7
Figure 7
Evolution of (a) product temperature and (b) thermal heat flux Jq inside central vials during primary drying as monitored through thermocouples. Black symbols refer to a vial placed in direct contact with the shelf, whereas white symbols refer to a nested vial. 5 wt% mannitol was used as a model product. Primary drying conditions were TS = −10 °C and PC = 10 Pa.
Figure 8
Figure 8
(a) Extraction points of vials nested in the rack system and in direct contact with the shelf. (b) Comparison between the evolution of the non-dimensional position of the minimum temperature of vials loaded in the rack system (blue curve) and in direct contact with the shelf (red curve). Evolution of (c) vial bottom, (d) average, (e) minimum, and (f) maximum temperature during primary drying. Red curves refer to vials in direct contact with the shelf, blue curves refer to vials nested in the rack system, and black curves refer to shelf temperature.

References

    1. Tang X., Pikal M.J. Design of freeze-drying processes for pharmaceuticals: Practical advice. Pharm. Res. 2004;21:191–200. doi: 10.1023/B:PHAM.0000016234.73023.75. - DOI - PubMed
    1. Abla K.K., Mehanna M.M. Freeze-drying: A flourishing strategy to fabricate stable pharmaceutical and biological products. Int. J. Pharm. 2022;628:122233. doi: 10.1016/j.ijpharm.2022.122233. - DOI - PubMed
    1. Maltesen M.J., van de Weert M. Drying methods for protein pharmaceuticals. Drug Discov. Today Technol. 2008;5:81–88. doi: 10.1016/j.ddtec.2008.11.001. - DOI - PubMed
    1. Walters R.H., Bhatnagar B., Tchessalov S., Izutsu K.I., Tsumoto K., Ohtake S. Next generation drying technologies for pharmaceutical applications. J. Pharm. Sci. 2014;103:2673–2695. doi: 10.1002/jps.23998. - DOI - PubMed
    1. Giordano A., Barresi A.A., Fissore D. On the use of mathematical models to build the design space for the primary drying phase of a pharmaceutical lyophilization process. J. Pharm. Sci. 2011;100:311–324. doi: 10.1002/jps.22264. - DOI - PubMed

LinkOut - more resources