

A Physiologically Based Pharmacokinetic Approach to Recommend an Individual Dose of Tacrolimus in Adult Heart Transplant Recipients
- PMID: 38004558
- PMCID: PMC10675244
- DOI: 10.3390/pharmaceutics15112580
A Physiologically Based Pharmacokinetic Approach to Recommend an Individual Dose of Tacrolimus in Adult Heart Transplant Recipients
Abstract
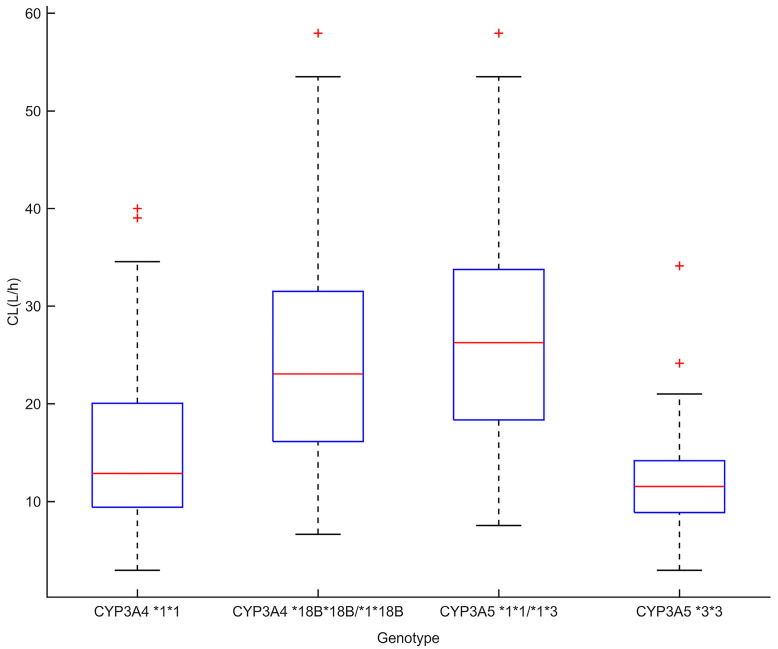
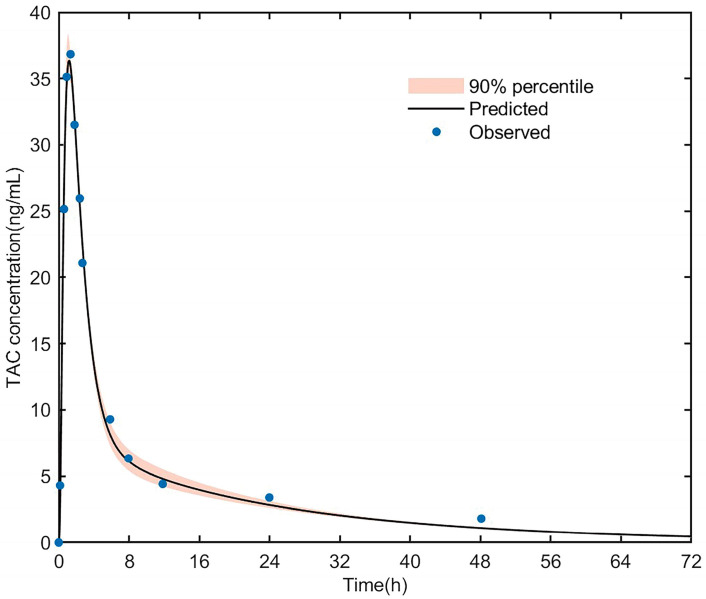
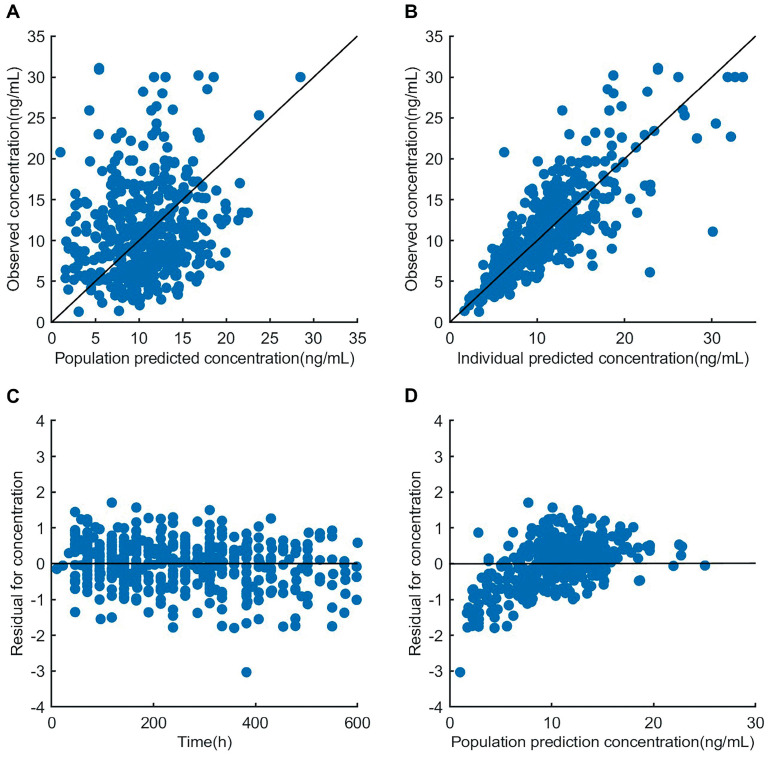
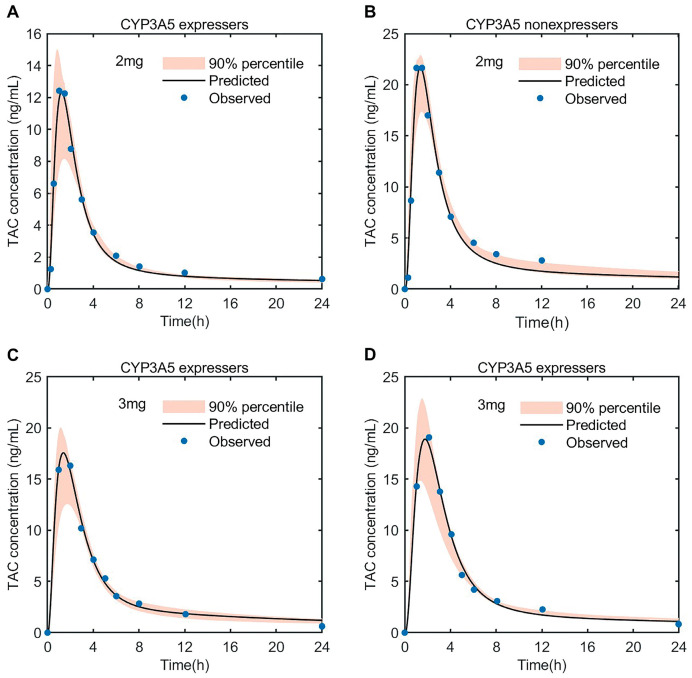
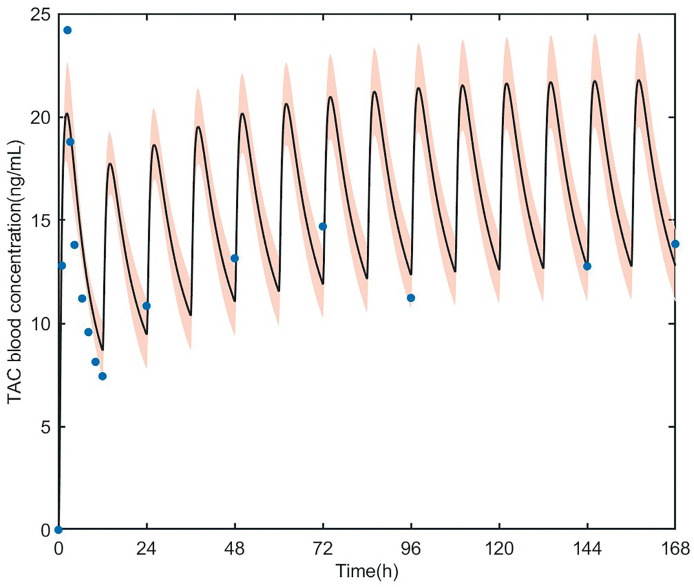
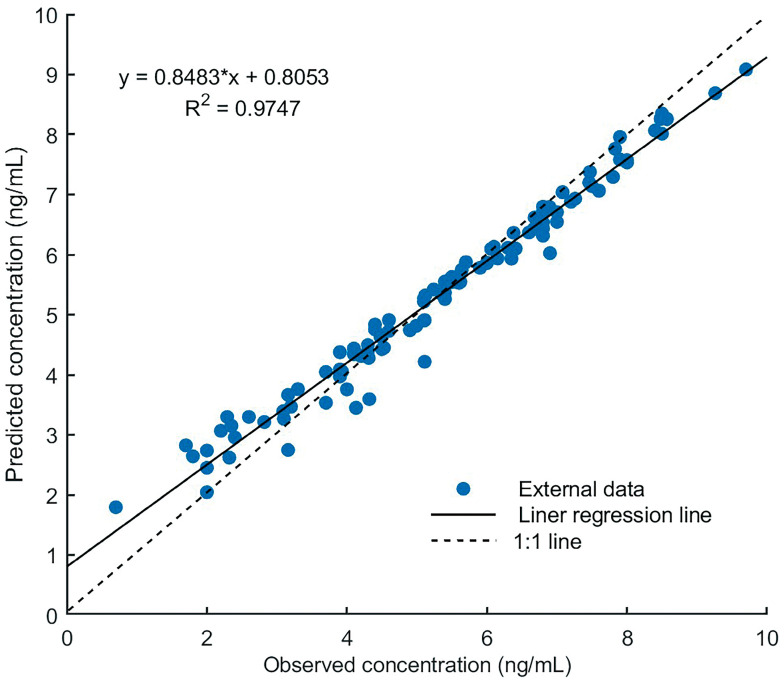
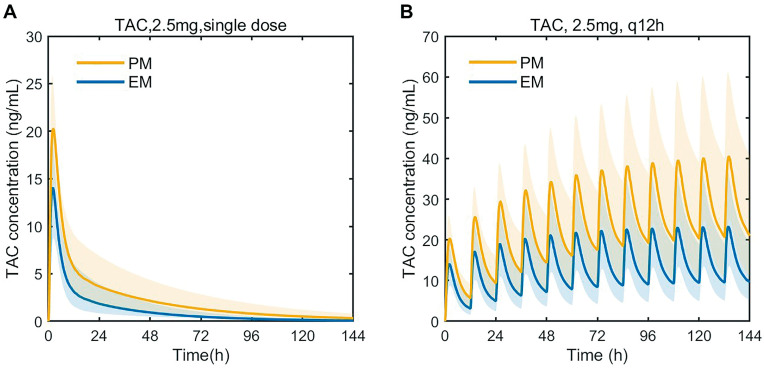
Tacrolimus is the principal immunosuppressive drug which is administered after heart transplantation. Managing tacrolimus therapy is challenging due to a narrow therapeutic index and wide pharmacokinetic (PK) variability. We aimed to establish a physiologically based pharmacokinetic (PBPK) model of tacrolimus in adult heart transplant recipients to optimize dose regimens in clinical practice. A 15-compartment full-PBPK model (Simbiology® Simulator, version 5.8.2) was developed using clinical observations from 115 heart transplant recipients. This study detected 20 genotypes associated with tacrolimus metabolism. CYP3A5*3 (rs776746), CYP3A4*18B (rs2242480), and IL-10 G-1082A (rs1800896) were identified as significant genetic covariates in tacrolimus pharmacokinetics. The PBPK model was evaluated using goodness-of-fit (GOF) and external evaluation. The predicted peak blood concentration (Cmax) and area under the drug concentration-time curve (AUC) were all within a two-fold value of the observations (fold error of 0.68-1.22 for Cmax and 0.72-1.16 for AUC). The patients with the CYP3A5*3/*3 genotype had a 1.60-fold increase in predicted AUC compared to the patients with the CYP3A5*1 allele, and the ratio of the AUC with voriconazole to alone was 5.80 when using the PBPK model. Based on the simulation results, the tacrolimus dosing regimen after heart transplantation was optimized. This is the first PBPK model used to predict the PK of tacrolimus in adult heart transplant recipients, and it can serve as a starting point for research on immunosuppressive drug therapy in heart transplant patients.
Keywords: genetic polymorphism; heart transplantation; physiologically based pharmacokinetics model; tacrolimus; therapeutic drug monitoring.
Conflict of interest statement
The authors declare no conflict of interest.
Figures
Similar articles
-
Population pharmacokinetic modelling and design of a Bayesian estimator for therapeutic drug monitoring of tacrolimus in lung transplantation.Clin Pharmacokinet. 2012 Mar 1;51(3):175-86. doi: 10.2165/11594760-000000000-00000. Clin Pharmacokinet. 2012. PMID: 22339449
-
Effects of CYP3A4 and CYP3A5 polymorphisms on tacrolimus pharmacokinetics in Chinese adult renal transplant recipients: a population pharmacokinetic analysis.Pharmacogenet Genomics. 2013 May;23(5):251-61. doi: 10.1097/FPC.0b013e32835fcbb6. Pharmacogenet Genomics. 2013. PMID: 23459029
-
Population pharmacokinetic analysis and dosing guidelines for tacrolimus co-administration with Wuzhi capsule in Chinese renal transplant recipients.J Clin Pharm Ther. 2021 Aug;46(4):1117-1128. doi: 10.1111/jcpt.13407. Epub 2021 Mar 25. J Clin Pharm Ther. 2021. PMID: 33768546
-
Effect of CYP3A and ABCB1 single nucleotide polymorphisms on the pharmacokinetics and pharmacodynamics of calcineurin inhibitors: Part I.Clin Pharmacokinet. 2010 Mar;49(3):141-75. doi: 10.2165/11317350-000000000-00000. Clin Pharmacokinet. 2010. PMID: 20170205 Review.
-
The role of pharmacogenetics in the disposition of and response to tacrolimus in solid organ transplantation.Clin Pharmacokinet. 2014 Feb;53(2):123-39. doi: 10.1007/s40262-013-0120-3. Clin Pharmacokinet. 2014. PMID: 24249597 Review.
Cited by
-
Integrating In Vitro Dissolution and Physiologically Based Pharmacokinetic Modeling for Generic Drug Development: Evaluation of Amorphous Solid Dispersion Formulations for Tacrolimus.Pharmaceutics. 2025 Feb 10;17(2):227. doi: 10.3390/pharmaceutics17020227. Pharmaceutics. 2025. PMID: 40006594 Free PMC article.
-
Assessing the cost-effectiveness of replacing antimetabolites with mTOR inhibitors in heart transplant immunosuppression in China: a network meta-analysis-based economic evaluation.Int J Clin Pharm. 2024 Dec;46(6):1472-1481. doi: 10.1007/s11096-024-01793-z. Epub 2024 Sep 24. Int J Clin Pharm. 2024. PMID: 39316305
-
Clinical significance and gene prediction of a novel classification system based on tacrolimus concentration-to-dose ratio in the early post-liver transplant period.Front Pharmacol. 2025 Jul 21;16:1614753. doi: 10.3389/fphar.2025.1614753. eCollection 2025. Front Pharmacol. 2025. PMID: 40761401 Free PMC article.
-
Guidance on Selecting Optimal Steady-State Tacrolimus Concentrations for Continuous IV Perfusion: Insights from Physiologically Based Pharmacokinetic Modeling.Pharmaceuticals (Basel). 2024 Aug 8;17(8):1047. doi: 10.3390/ph17081047. Pharmaceuticals (Basel). 2024. PMID: 39204152 Free PMC article.
-
A preliminary exploration of liver microsomes and PBPK to uncover the impact of CYP3A4/5 and CYP2C19 on tacrolimus and voriconazole drug-drug interactions.Sci Rep. 2025 Feb 21;15(1):6389. doi: 10.1038/s41598-025-91356-7. Sci Rep. 2025. PMID: 39984708 Free PMC article.
References
-
- De Gregori S., De Silvestri A., Cattadori B., Rapagnani A., Albertini R., Novello E., Concardi M., Arbustini E., Pellegrini C. Therapeutic Drug Monitoring of Tacrolimus-Personalized Therapy in Heart Transplantation: New Strategies and Preliminary Results in Endomyocardial Biopsies. Pharmaceutics. 2022;14:1247. doi: 10.3390/pharmaceutics14061247. - DOI - PMC - PubMed
-
- Brunet M., van Gelder T., Åsberg A., Haufroid V., Hesselink D.A., Langman L., Lemaitre F., Marquet P., Seger C., Shipkova M., et al. Therapeutic Drug Monitoring of Tacrolimus-Personalized Therapy: Second Consensus Report. Ther. Drug Monit. 2019;41:261–307. doi: 10.1097/FTD.0000000000000640. - DOI - PubMed
-
- European Medicines Agency Modigraf. 2022. [(accessed on 26 May 2023)]. Available online: https://www.ema.europa.eu/en/documents/product-information/modigraf-epar....
-
- U.S. Food and Drug Administration Prograf. [(accessed on 26 May 2023)];2021 Available online: https://www.accessdata.fda.gov/drugsatfda_docs/label/2021/050708s053,050....
Grants and funding
LinkOut - more resources
Full Text Sources
